A Facebook page report should sound familiar to you if you’re a social media manager or you’re running a Facebook profile for your company. Once in a while, you’ll need to download such a report, so it’s good to know how it can be done in the most effective way.
By diving into Facebook analytics data, businesses and individuals can gain a clear picture of how their content is performing, who their audience is, and what strategies are driving the best results. Facebook analytics data is important for monitoring competition and evaluating the performance of a brand’s marketing strategy.
When analyzing your Facebook page, it’s crucial to track core metrics such as conversions, engagement, reach, and ROI. These core metrics are essential for measuring campaign success and aligning your data with your business goals.
Leveraging analytics data allows you to refine your marketing approach. Customized reports can provide insights that help optimize your campaigns and content for better results.
Ultimately, Facebook analytics empower you to understand your audience and content performance, making informed, data-driven decisions that help you achieve your goals. These insights enable you to make smarter decisions for your business.
Introduction to Facebook analytics
Facebook analytics is an essential resource for anyone looking to understand and improve their presence on the platform. By diving into Facebook analytics data, businesses and individuals can gain a clear picture of how their content is performing, who their audience is, and what strategies are driving the best results. Key metrics such as engagement rate, reach, and conversion rate reveal how well your content resonates with your audience and where there’s room for improvement. With these insights, you can fine-tune your content strategy, optimize your ad spend, and ultimately drive revenue. Whether you’re managing a single Facebook page or overseeing multiple Facebook pages, leveraging analytics data is crucial for making informed, data-driven decisions that help you achieve your goals.
Why do you need Facebook reports and what data they should contain
Any kind of report is basically a summary of what was done and what was the result. The Facebook report is no exception. It shows how the profile you are running was doing overtime.
Usually, such a report should contain the following data:
- how big the profile is, and how many new followers did it gain (including total page likes and follower statistics),
- how many people you were able to reach in the selected time period,
- what was the total engagement,
- what was the sentiment of users’ comments,
- how fast the moderators were replying to those comments,
- page likes,
- follower growth,
- performance metrics,
- engagement metrics (such as post reactions, comments, shares, and overall engagement rate),
- click through rates,
- audience demographics (age, gender, location, etc.),
- post reactions,
- video views,
- posting frequency.
To be honest, we could keep on listing more and more metrics here. 😉 The point is, every report can look differently, however, metrics such as reach, engagement or impressions are usually included in every Facebook report. You can also use a report template to streamline the reporting process and ensure consistency.
Which indicators you’d like to include in your report, also depends on for whom you’re preparing such a report and how detailed you want it to be. Sometimes it’ll be very general, for example: for your board, you’ll rather prepare a quick summary with key performance indicators. For a quarterly meeting with your team, on the other hand, you’ll have to collect much more data about every aspect of your Facebook performance, possibly using raw data for deeper analysis.
Also, you can craft a comparison report which will clearly show you how your competitors’ are doing and what actions do they take. With such a summary, you can take a closer look at competitive brands, and you can draw significant conclusions that can really support your social media strategy. For example, it is worth taking a look at how many fans do they have and how are their numbers growing over time, checking how often do they post on Facebook, what do they post and with what results. Analyzing competitor performance and benchmarking against industry peers helps you identify performance trends and gaps in your own strategy.
When tracking your Facebook performance, consider monitoring media type (such as static images, video content, reels, or Stories) and analyzing the performance of different content formats, including page posts and video views. Tracking facebook page activity, such as engagement and reach, is essential, and tools like page insights and the insights tab can help you access these insights metrics. For ad spend and ROI, tracking cost efficiency as part of your performance metrics is crucial to optimize your budget allocation.
Additionally, use facebook business and facebook group insights to manage and analyze different types of Facebook properties. For customer interaction metrics, track facebook messenger analytics, such as message volume and response times, to improve engagement. When tailoring reports, understanding your audience’s preferences will help you optimize content and targeting for better results.
Sotrender gives you plenty of opportunities to custom a Facebook report according to your needs and preferences. Let’s now take a look at how you can prepare and download your report.
Understanding Facebook Insights
Facebook Insights is a built-in analytics tool designed to provide detailed information about your Facebook page’s performance. Accessible through the professional dashboard or Meta Business Suite, Facebook Insights offers a comprehensive overview of metrics like page views, post reach, and engagement. By exploring these metrics, you can better understand your audience’s preferences, identify which posts generate the most engagement, and track your page’s growth over time. The detailed information available in Facebook Insights allows you to spot trends, measure the effectiveness of your content strategy, and make adjustments to boost your page performance. Whether you’re looking to increase your reach or improve your engagement rates, Facebook Insights is an invaluable resource for any page administrator.
Take your Facebook page report to the next level
If you want detailed Facebook reports which will be easy to read, you can use a reporting tool like Sotrender to autogenerate them, create, customize, and visualize Facebook analytics reports that provide insights into your social media performance.
Once you decide to use such a social media analytics tool, you will have access to plenty of metrics, analyses, and different report formats.
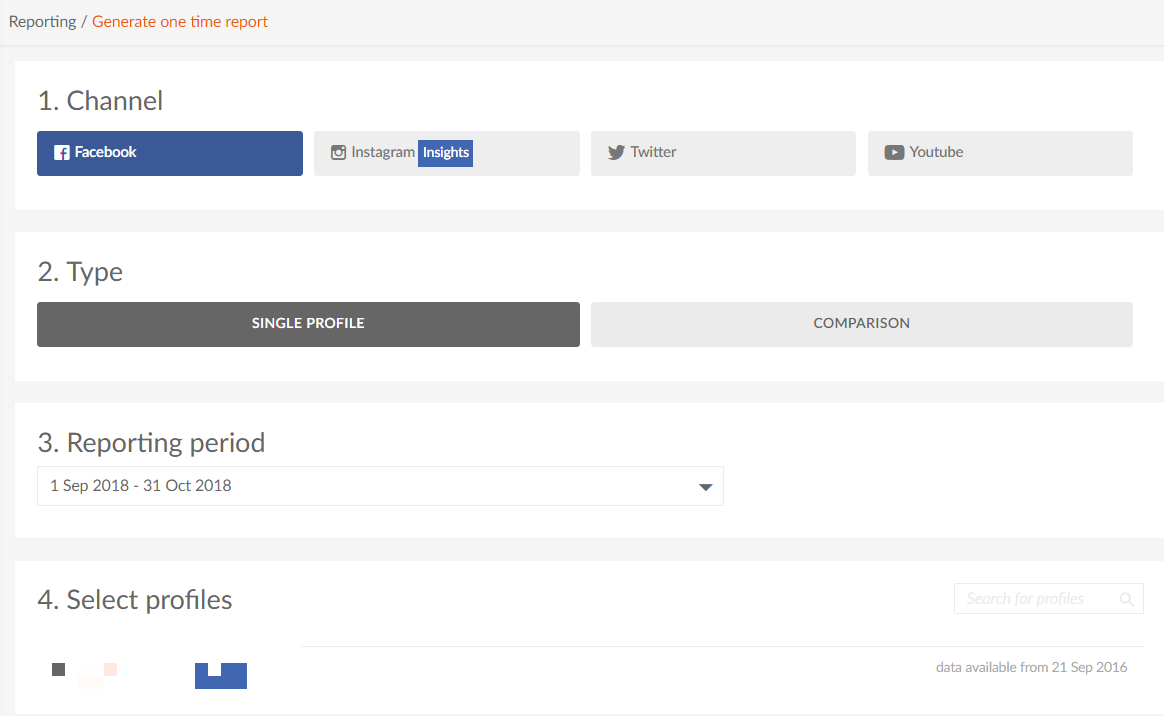
In order to create a new report with Sotrender, after logging in, click Reporting and Create new to start the process of saving an autogenerated report. You have to pick Facebook as the channel you want to be analyzed and select the rest of the options to suit your needs.

In case you’re wondering how you can generate one for yourself, here’s a step-by-step guide in pictures that should make it clear.
- Select the channel you want, the type of report, the date range, and the profiles you want.
- Choose the report format. There are four types you can choose from.
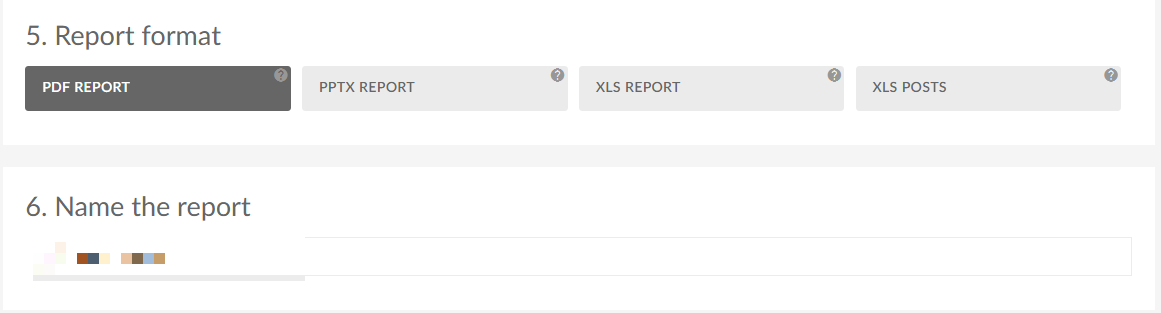
Our customers are usually choosing the PDF report the most often. 😉
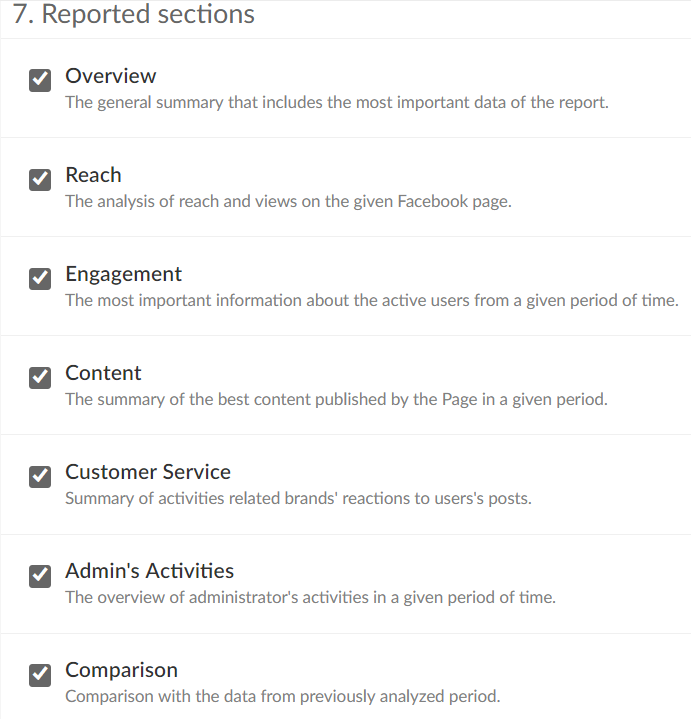
- Select the sections you want to include in the report. You can read the brief description of each metric if you aren not sure what exactly do they measure.
Finally, generate your report and wait a couple of minutes for the file to download. You can now read about your profile’s Facebook performance with ease. For more advanced tracking, consider integrating a meta pixel to monitor website conversions, page views, and optimize your advertising performance.
We have included examples of metrics and their presentation in our Facebook report below for you.
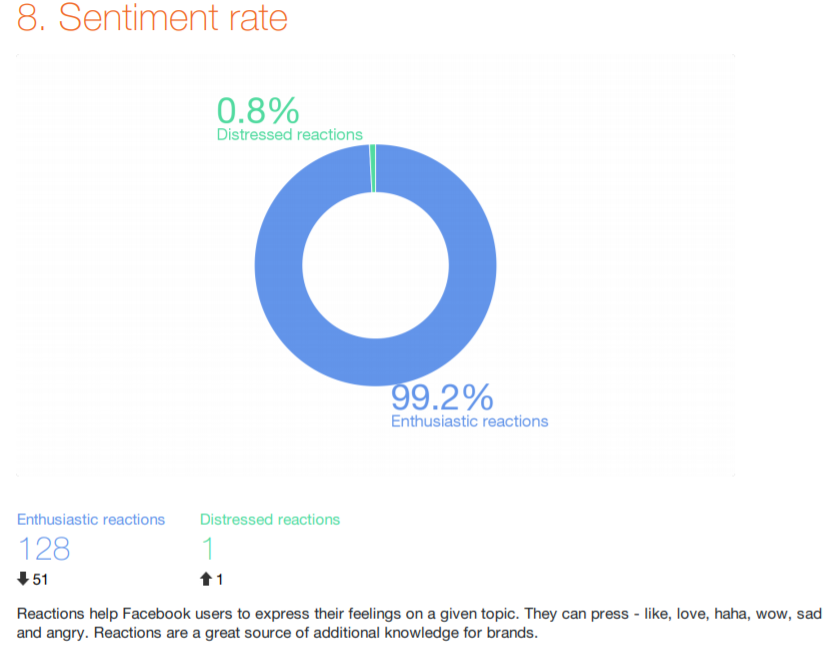
Example of Sentiment Rate in the Facebook report
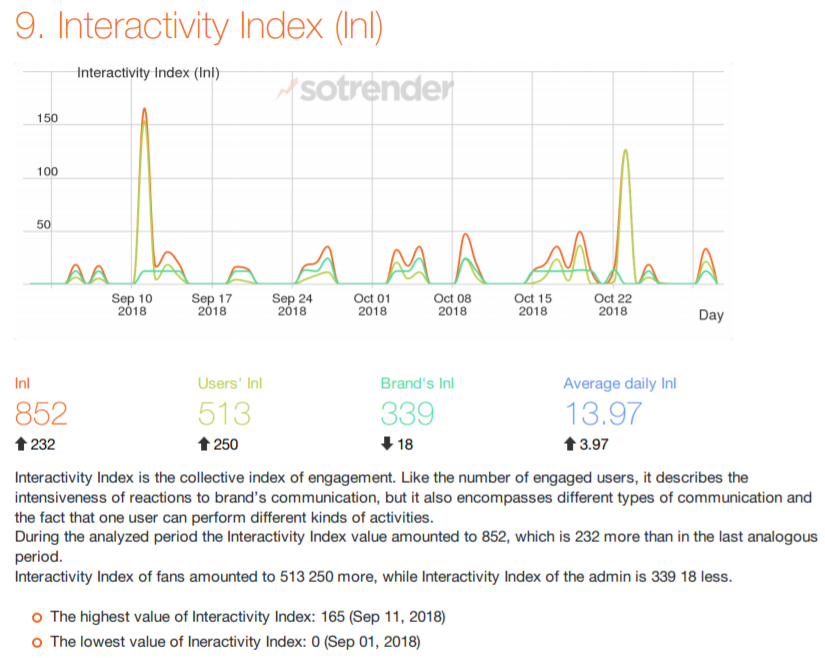
Sotrender’s Interactivity Index (InI)
In order to make marketers’ lives easier, at Sotrender it’s also possible to set recurring reports. What does it mean, exactly? Basically that you’ll have to create the desired report only once! Then, on a selected day, such a report will be sent to your email inbox automatically. No effort is needed!
If you’d like to use this option, first you’d better check the rules of creating a flawless social media report.
Facebook Audience Insights
Facebook Audience Insights is a powerful tool that helps you get to know your Facebook audience on a deeper level. By analyzing demographic data such as age, gender, location, and interests, you can create content that truly speaks to your followers. Audience Insights also reveals behaviors and preferences, enabling you to identify new audience segments and tailor your marketing efforts for maximum impact. With this data, businesses can craft campaigns that resonate with their target audience, leading to higher engagement and improved conversion rates. Understanding who your audience is and what they care about is key to creating content that drives results and helps your Facebook page grow.
Getting Facebook insights reports directly from Facebook
Facebook gives you the possibility to export your page data from the administrator panel into a report. You can download your Facebook reports by following these steps:
- Go to your Facebook Page and click on the Insights button. This will take you to the insights tab, where you can access detailed analytics and performance metrics for your Facebook page.
- Click on the Export button.
- In the export Insights data window choose type of data.
- Choose between Page data, Post data and Video data.
- Choose the date range (it has to be shorter than or equal to 180 days) and the file format (.xls or .csv format).
- Click Export and wait for your download to finish.
After you’ve completed all of these steps, your Insights data is now ready for analysis.
Need a Facebook ads report?
What we’ve talked about above was related to analyzing and reporting the organic Facebook performance. However, marketers are more and more often leaning to Facebook ads, too, as ads enable them to reach many new users.
Reporting Facebook ads, as a result, is even more important, as ad activities require an additional budget. Everyone who is spending money on this type of advertising would simply like to know if it was worth it. 😉
Regularly reviewing performance trends in your Facebook ad reports helps you identify patterns in engagement, reach, and audience behavior, allowing you to optimize your ad strategy over time.
In this case, you can also use Sotrender to generate a report. It’s actually great to have the possibility to download your Facebook report for both organic and paid performance, using one tool.
Once you log in to Sotrender and head on to Analyze Ads section, you have to start by choosing the campaigns (or ad sets or ads) you want to generate the report for. By default, all the metrics that you can download will be automatically selected, but you can unclick some if you want. The next step, which is also optional, is adding your logo or a comment, that will be shown on the first page of the report.
And that’s basically it! Your Facebook report will be ready in less than 60 seconds!
How does it look from the inside?
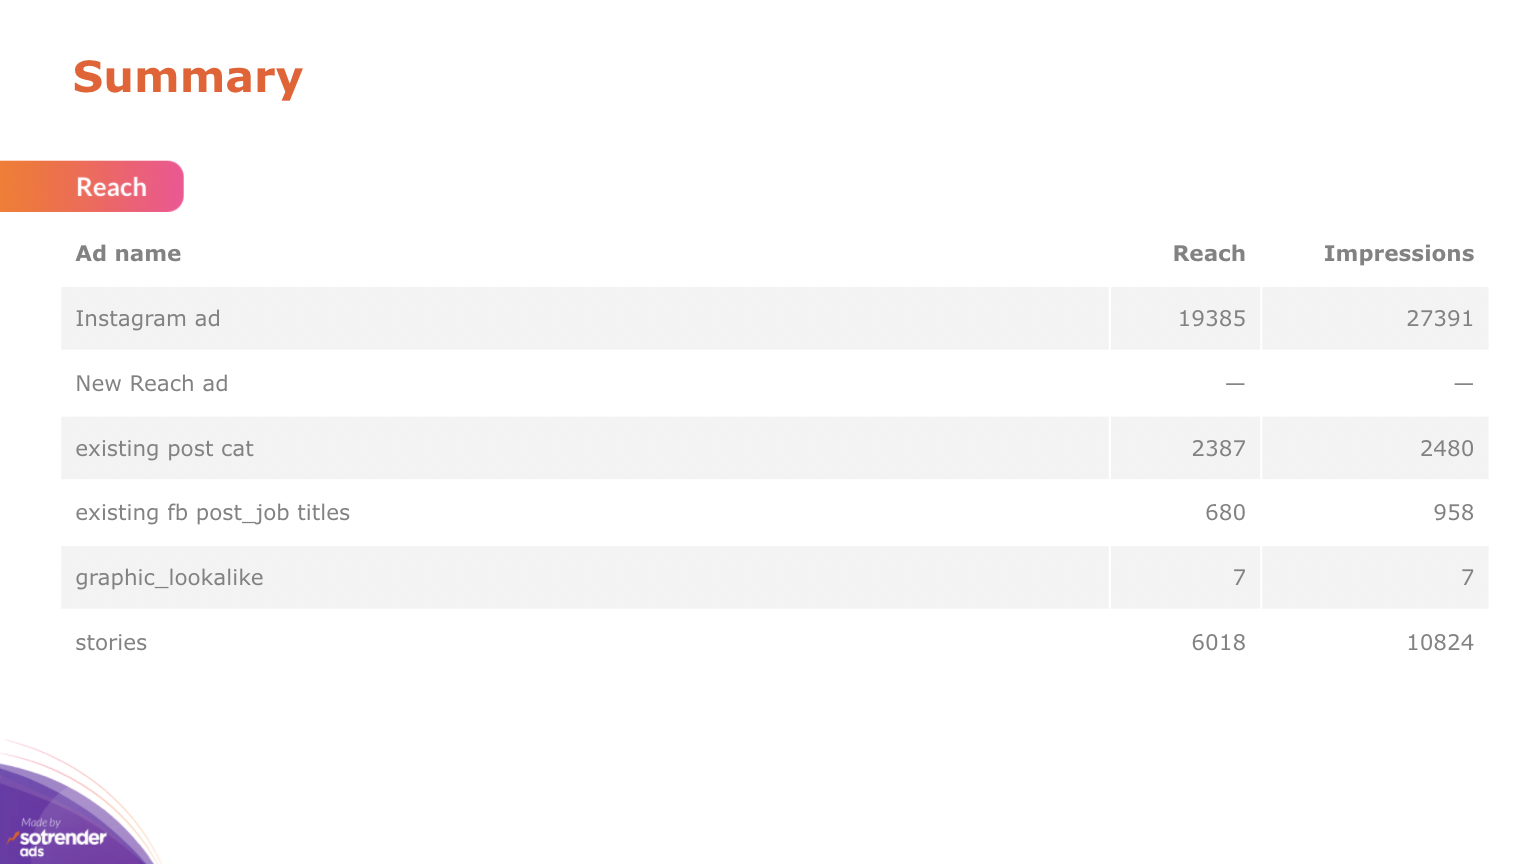
Summary page in the ad report from Sotrender
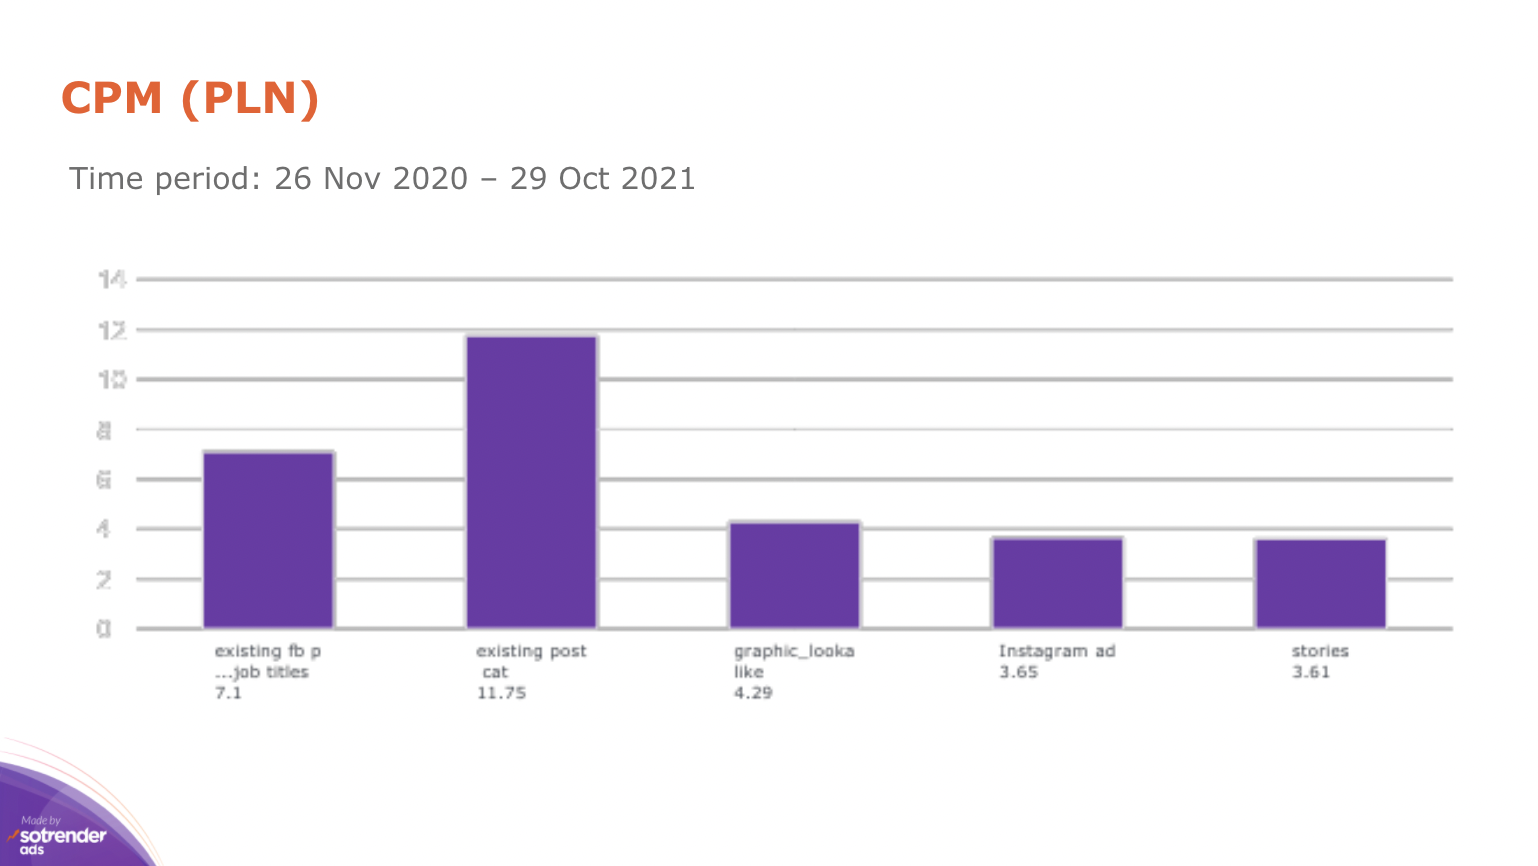
Facebook ads report, Sotrender
Looks much better than the report from Facebook Ads Manager, right? 😉
Actionable insights from Facebook
Turning Facebook analytics data into actionable insights is the key to ongoing improvement and success on the platform. By regularly reviewing key metrics like engagement rate, conversion rate, and page growth, you can pinpoint what’s working and where there’s potential for growth. Tools like Meta Business Suite and various third party tools offer detailed analysis and recommendations, making it easier to refine your content strategy and achieve your marketing objectives. With actionable insights, you can create targeted content, optimize your posting schedule, and adjust your campaigns to drive revenue and boost engagement. Leveraging these insights ensures your Facebook strategy remains effective and aligned with your business goals.
Facebook analytics tools
To get the most out of your Facebook data, it’s important to use the right analytics tools. Meta Business Suite and the professional dashboard provide robust analytics features, allowing you to track page growth, monitor engagement rate, and manage ad spend all in one place. For even deeper insights, third party tools can offer advanced reporting, competitor analysis, and social listening capabilities, helping you stay ahead of industry peers and market trends. By combining these tools, you can develop a comprehensive content strategy, measure performance across different metrics, and make data-driven decisions that drive revenue. Whether you’re focused on organic growth or optimizing paid campaigns, Facebook analytics tools are essential for understanding your audience and achieving your social media goals.
Downloading a Facebook page report can be a piece of cake
Being effective in any type of marketing requires a data-driven attitude. You can get your Facebook data in many ways, but not every report will be of the same value. You have to test various solutions and actually download quite a few Facebook page reports to know which one is the best for you.
Remember, your success in social media really depends on a well-thought strategy that will be optimized and adjusted according to the results. That is why you need to measure them systematically. It is also important that you keep an eye on competitors’ activities so you can stay on top of things. And Facebook reports will only help you to do that.
Read more about similar topics here:
Author
Klaudia Żyłka
Marketing Team Lead
Instagram, dogs, books and food lover. Former student at Warsaw University and Malmö University. Improving her marketing skills every day. Proud owner of DIMAQ certificate


