
It’s an absolute must that you represent yourself on social media, regardless of what kind of business you are running. Why? The reason is simple: your target audience is there.
And even though a budget is needed to reach out to them effectively, your social media success does not depend solely on money. To make the most of it, you need to know where you are going. In other words, you need to be able to quantify your social media efforts, and figure out what works and what doesn’t. To do that, you need to create an effective social media report.
While that may sound simple enough, the tricky part is making it easy to read and understand for your clients or your boss. That’s why we decided to put together a list of 15 rules you should stick to in order to create a flawless report. Keep on reading.
1. Don’t Complicate It
Your social media report should read well, meaning that you shouldn’t let stuff like fancy formatting or unnecessary details distract the reader from the actual report. Put the data that you have collected in the spotlight and let it speak for itself. Of course, if there is a sudden spike in a certain metric that you think warrants a discussion, don’t hesitate to include it.
2. Focus Only on Relevant Goals
Nobody knows all the ins-and-outs of your social media presence better than you, which means you know which metrics and KPIs are essential. While there is no such thing as too much data, you should focus only on those numbers which are relevant to your report.

3. Keep Your Audience in Mind
Keep in mind that there is no such thing as a one-size-fits-all social media report. In all likelihood, you will have to tailor your report according to the person you are presenting it to. If you are presenting a report to your team, you can zoom in on the fine details of each campaign. But, if you are creating one for your boss, it should only feature data that is relevant to them.
4. Focus on SMART Questions
Your social media report needs to make sure that the person reading it walks away knowing more after they have read it, and we are talking about quantifiable results. This means that the data presented in your report needs to be SMART: specific, measurable, achievable, relevant, and time-limited.
Some of you probably already started to have doubts as to whether you would be able to create such a report on your own. Maybe you think it’s too time-consuming, but at the same time, you understand that analyzing results is crucial for growth or improvement. Don’t worry, social media analytics tools like Sotrender are here to help you.
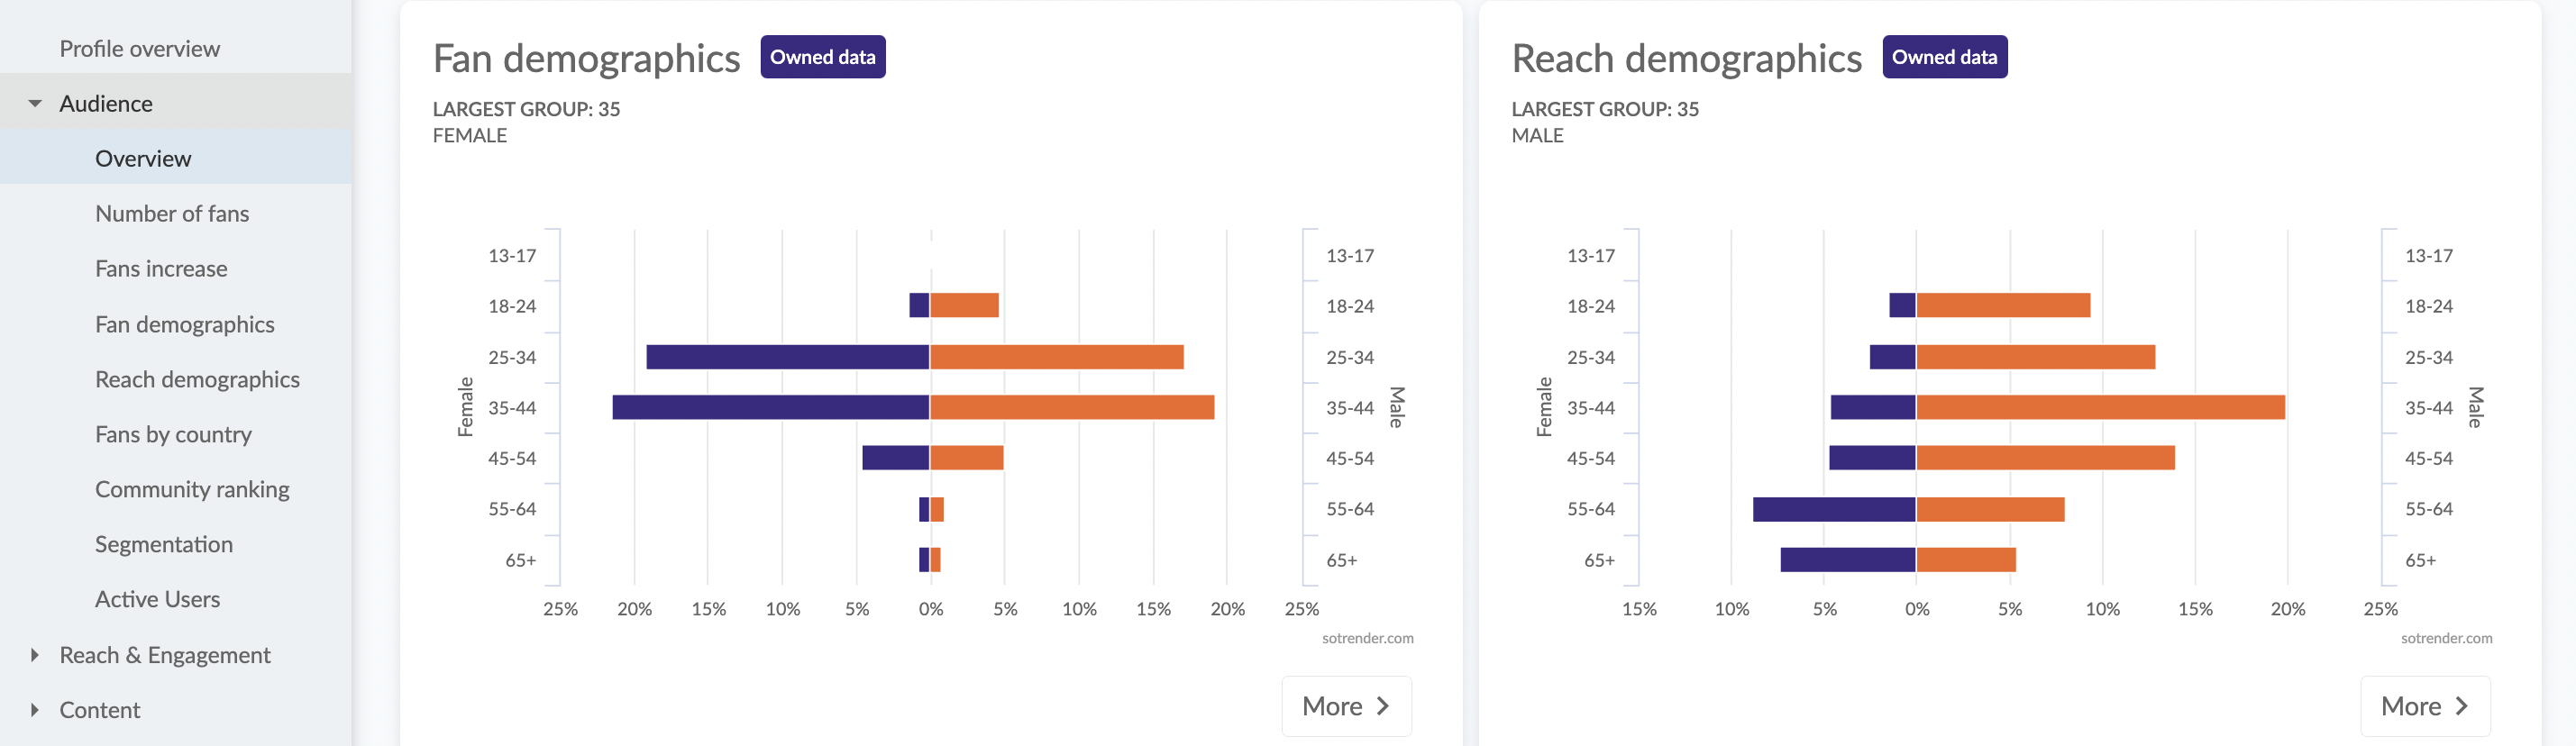
Social media audience analysis in Sotrender
Keep on reading and you will learn more about what benefits social media analytics tools can bring you.
5. Decide on the Time Frame
How often you will track your results and report on them depends on the nature of your campaigns. But, you will most likely be required to report regularly and additionally after special, seasonal campaigns.
If you need to create reports on a regular basis, you might want to consider using a social media analytics tool that will automate the process and save you a whole lot of time. Sotrender users can choose the time frame that the report should cover – last 7 days, last 30 days, last 90 days and then decide whether the report should be repeated weekly or monthly. If you choose that you want to receive it weekly, you can even pick a day of the week on which the report will be automatically sent to you. In case of a report recurring monthly, you have the possibility to choose the day of the month.
6. Use Social Media Reporting Tools
As mentioned above, social media reporting and analytics tools are a great convenience. Not only do they help you gather all your data in one place, but also visualize it and describe it on easy-to-read charts. Sotrender allows you to customize your social media reports according to the needs of your business or clients.
Sotrender’s CEO, Jan Zając, further explained the utility of using Sotrender to automate repetitive everyday marketing activities such as reporting.
It’s our belief that repetitive and mundane cognitive jobs can be automated. We give creative marketing people the luxury of time to do more creative jobs and less repetitive tasks that can be automated and performed by the software.
Jan Zając for his interview with Website Planet
First, you decide which social media profile will be the subject of your analysis and what period of time you want to analyze. Then you can decide in what format your data will be presented – it can be in PDF, PPT or XLS. Subsequently, we can decide about the contents of the report and what sections it should include. You have the following options:
-
Overview
The general summary that includes the most important data of the report.
-
Reach
The analysis of reach and views on the given Facebook page.
-
Engagement
The most important information about active users from a given period of time.
-
Content
The summary of the best content published by the Page in a given period.
-
Customer Service
Summary of activities related to the brand’s reactions to users’ posts.
-
Admin’s Activities
The overview of administrator’s activities in a given period of time.
-
Comparison
Comparison with the data from the previously analyzed period.
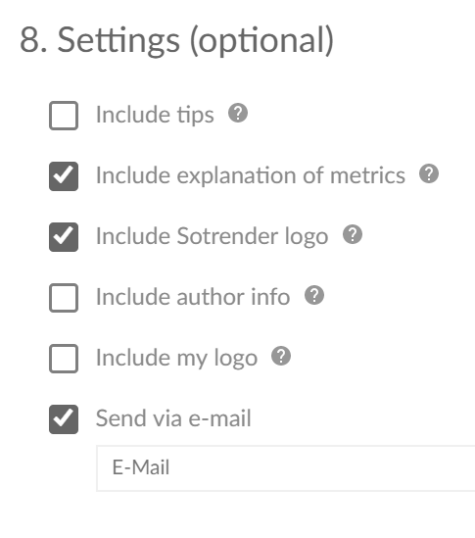
Then it’s time to decide on the settings. Again you have multiple options that you can mark as desired or unmark if you deem them unnecessary. For example, you can decide whether you want to include Sotrender’s logo or make it personalized and add your company’s logo and author’s bio.
7. Provide an Insight into the Making of Your Report
While it’s probably true that in most cases your clients or boss won’t care about how you have come up with your report, you should provide an explanation anyway. Not only to be able to explain everything in case they are actually interested, but also to show that you haven’t pulled something out of thin air.
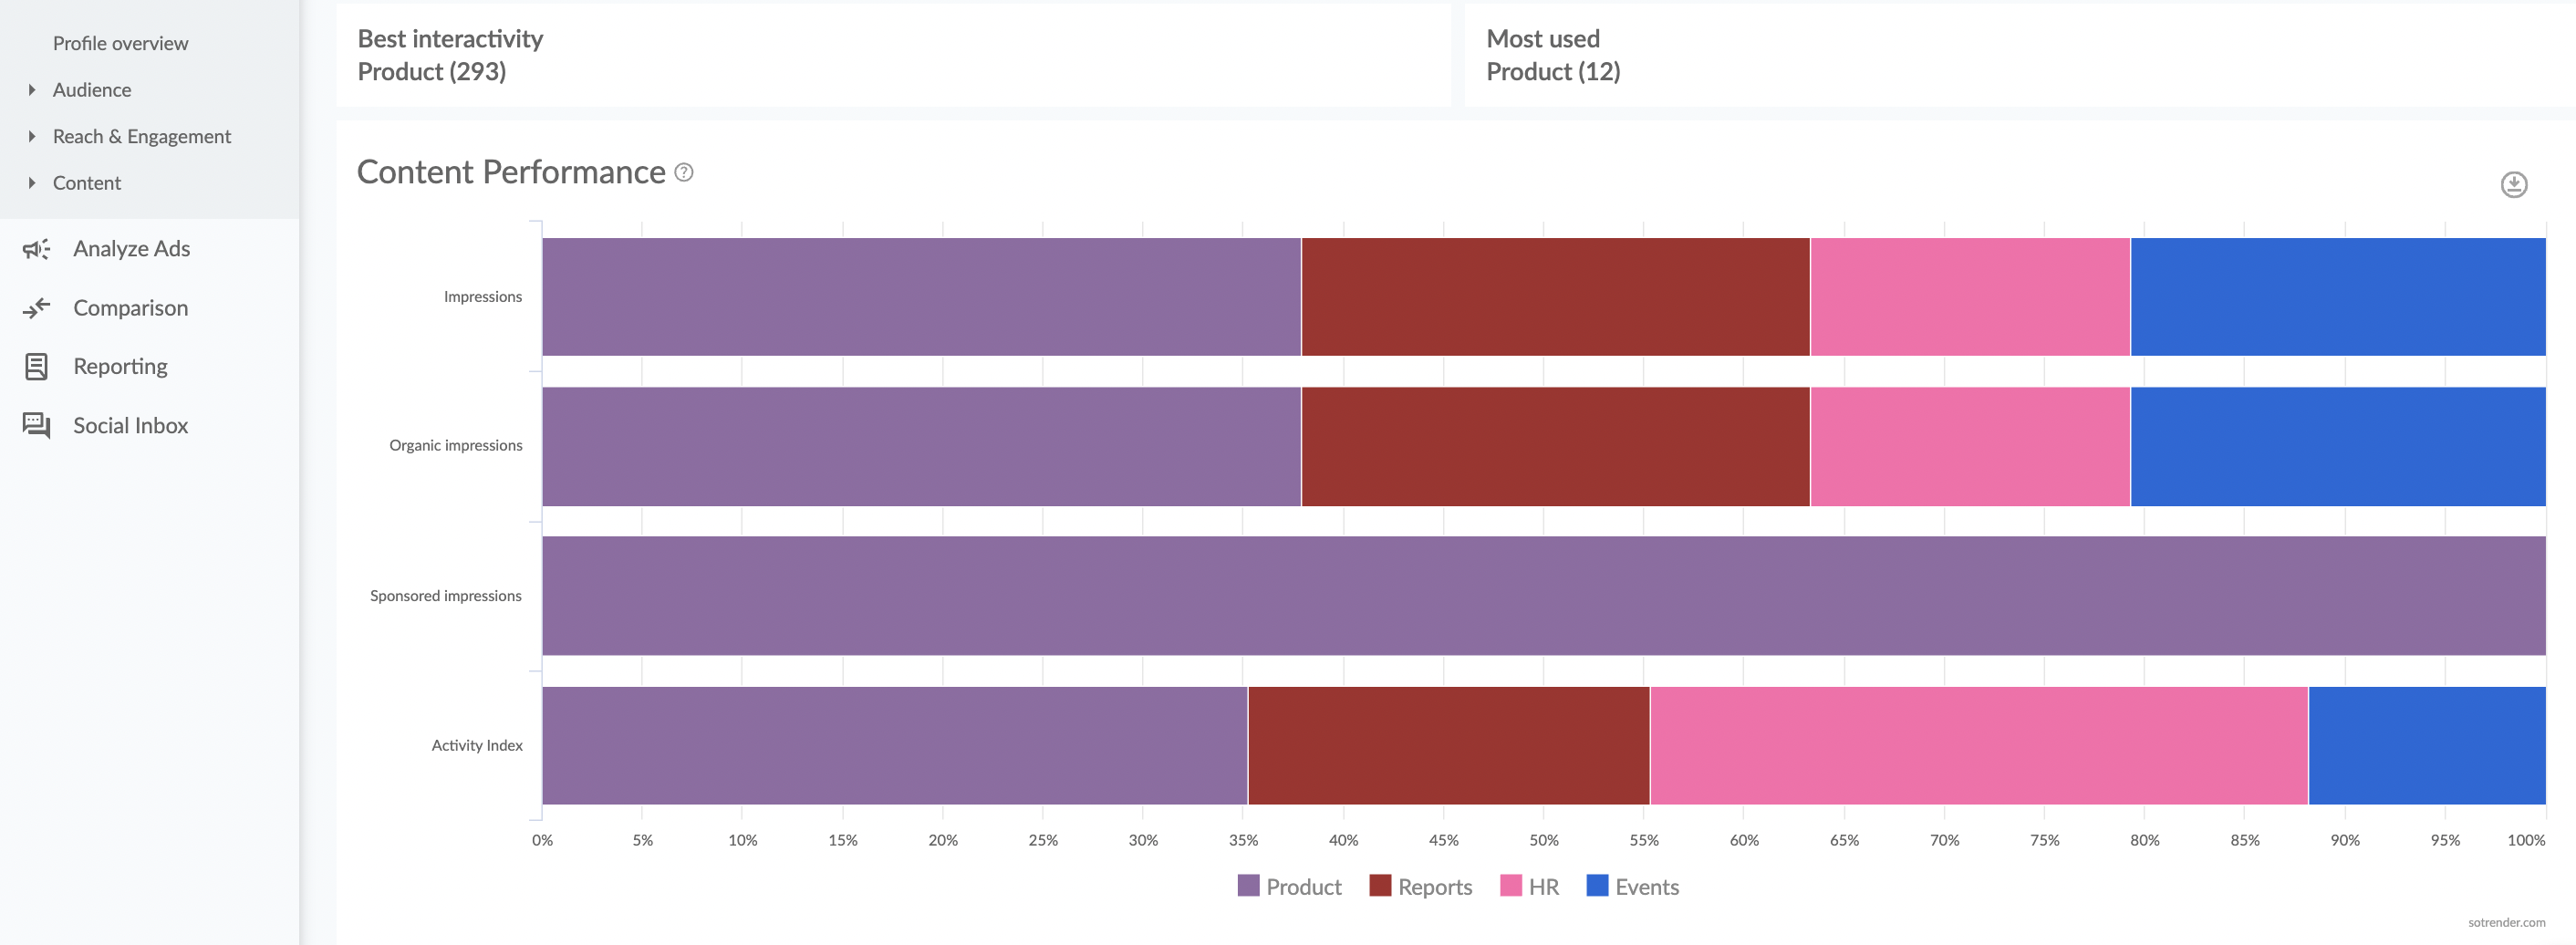
8. Include Visuals as Well
While the main element of your social media report is your data, you don’t have to stick to just text and numbers in your report.
In fact, it would be even better if you visualize that data using charts, graphs, or infographics. It will help your audience digest the subject matter more easily.
Social media management tools, like Sotrender, visualize data for you. Below you can find examples of charts generated automatically in the tool.
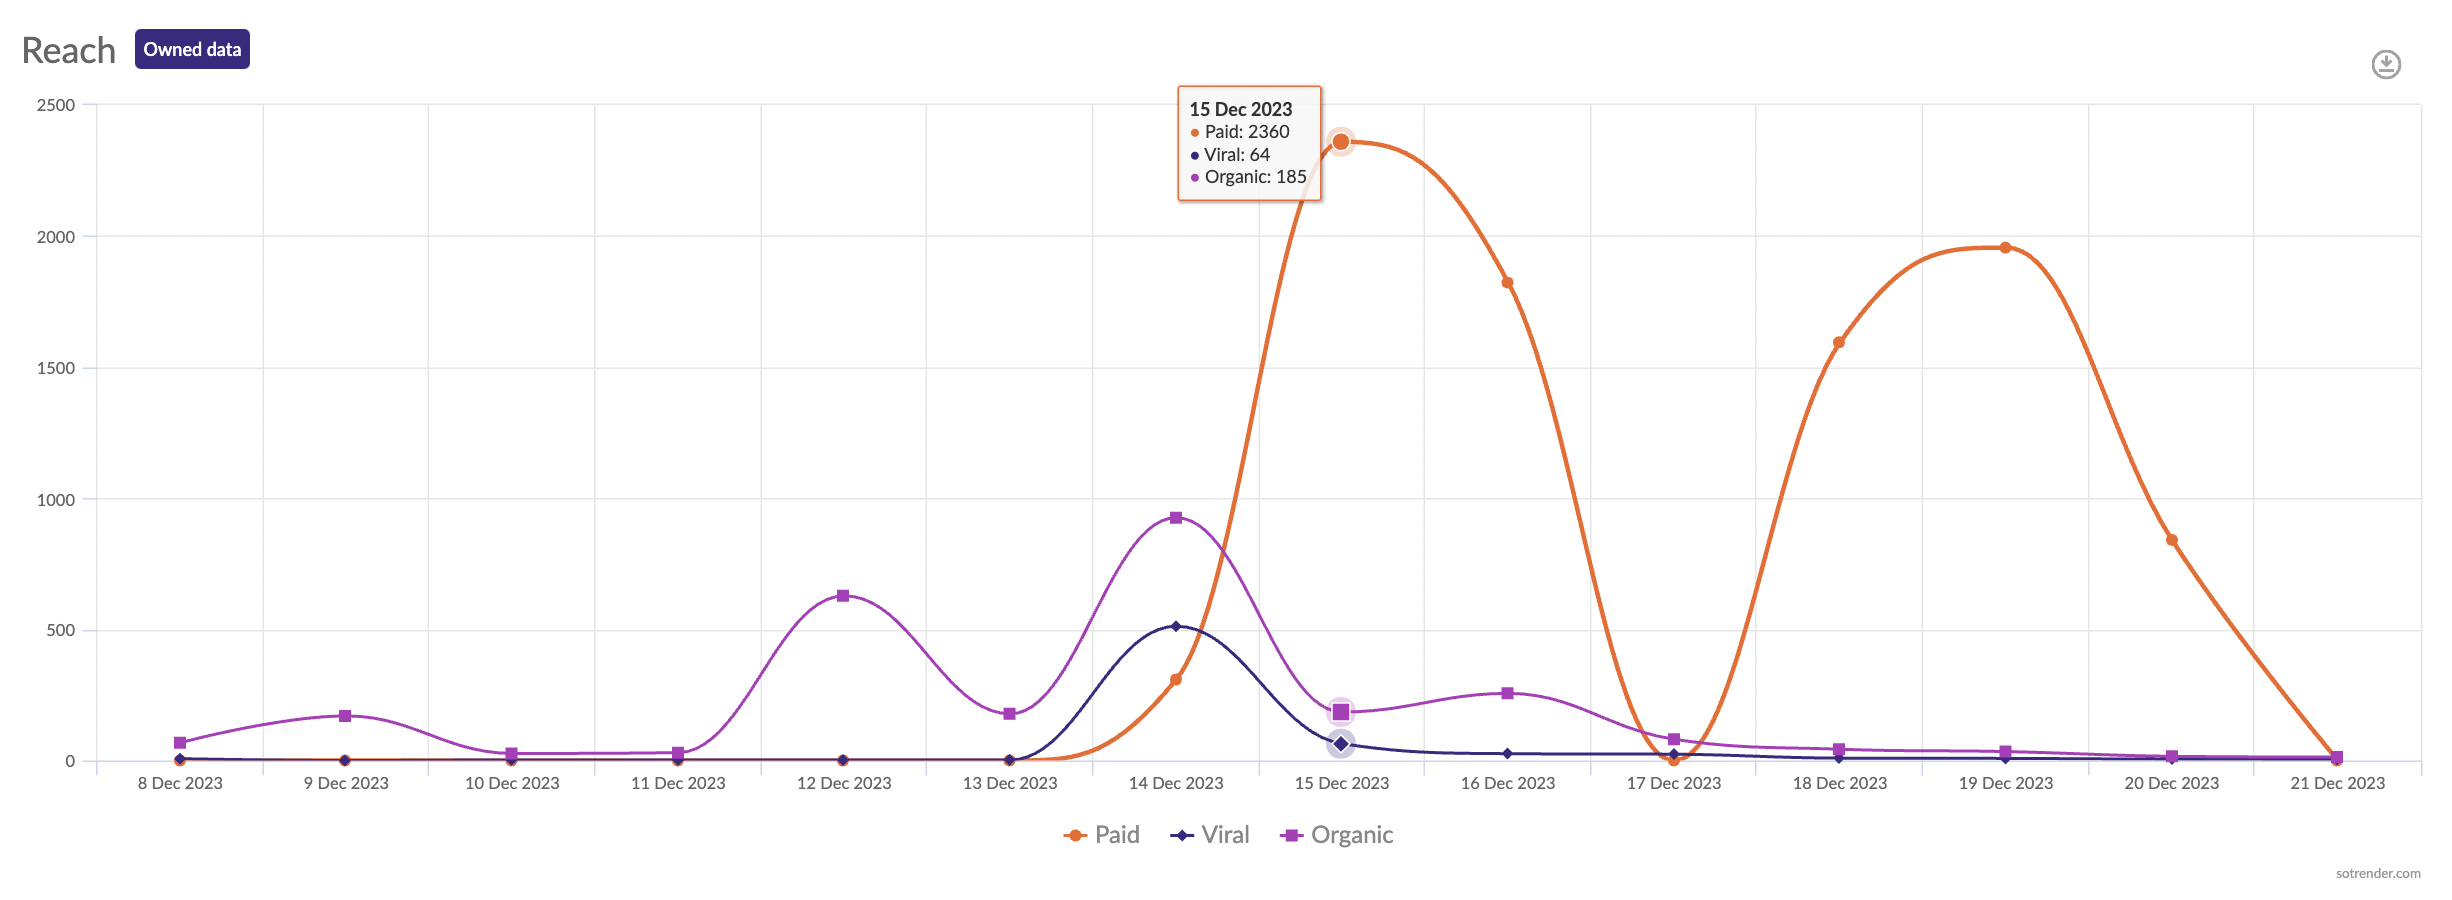
Monitoring reach day by day
9. Break Down Difficult Concepts
While it may not always be the case, your target audience might not understand all the nuts and bolts of social media. With that in mind, provide an explanation on why a particular metric matters, and why you chose to include it. Reserve some space in your report to add explanations of metrics and meaningful conclusions for your business.
Again, if you use Sotrender you can have all definitions of metrics served up on a plate. You can view them directly in the analytics dashboard by clicking on the question mark – this might help when you will be presenting data live from the tool. You can also decide to include an explanation of metrics as well as tips on what to improve and what is going great in the social media report.

10. Talk about Your Competitors
Your report doesn’t always have to focus only on your company or your department. It is always useful to analyze your competitors and compare your social media stats to theirs to draw conclusions on how you can improve. Sotrender gives you the possibility to create comparative reports and juxtapose any social media profiles you want.
For example, you can discover on what day of the week and what time of day your competitors’ fans are most active and eager to engage on the profile. You can use this insight to post engaging promoted posts targeted at your competitors’ fans at the very same time and try to intercept your competitor’s potential audience. Moreover, you can check what type of content works for your competitors or what content they are missing or using ineffectively. Then you can easily tap into this knowledge by creating better posts for your company.
11. Provide Context
Presenting your data to an audience “as is” may not always be effective because it may be difficult to draw a conclusion when presented without a proper context. For instance, your reach on social media has tripled, which is great. But, you should include other factors, such as budget, which should provide a clearer picture of the results.
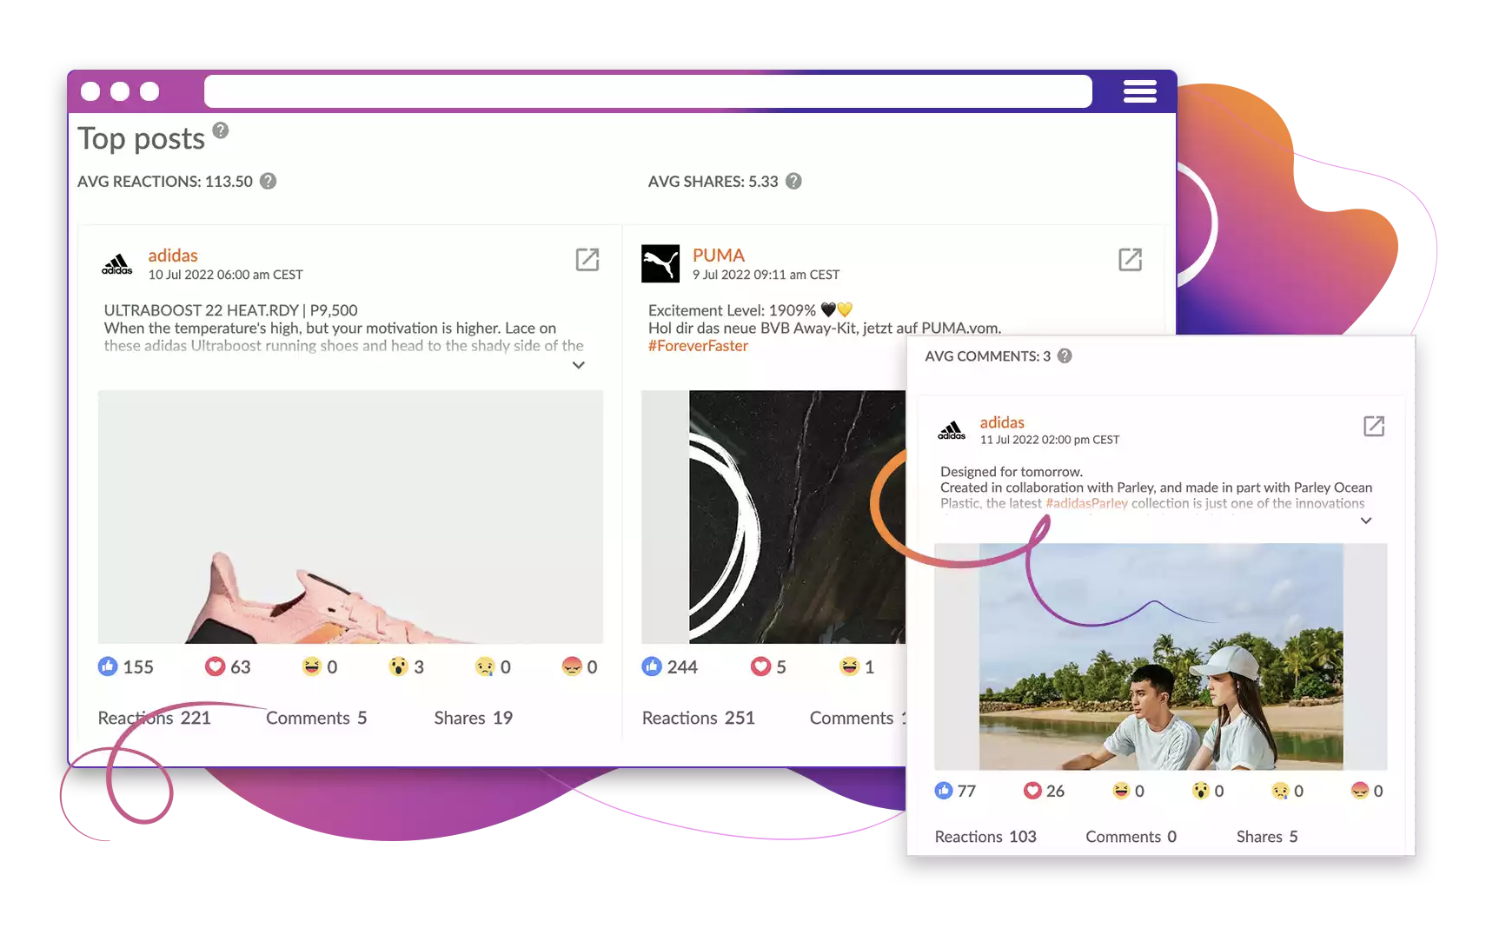
12. Include Actionable Insights
Along with your most important KPIs, you should also include stuff like “Top 10 posts” when it comes to reach, engagement, and/or clicks. This will help you single out activities, topics, and types of posts which you should focus on more. You can do the same for worst-performing posts in order to eliminate them from your strategy.
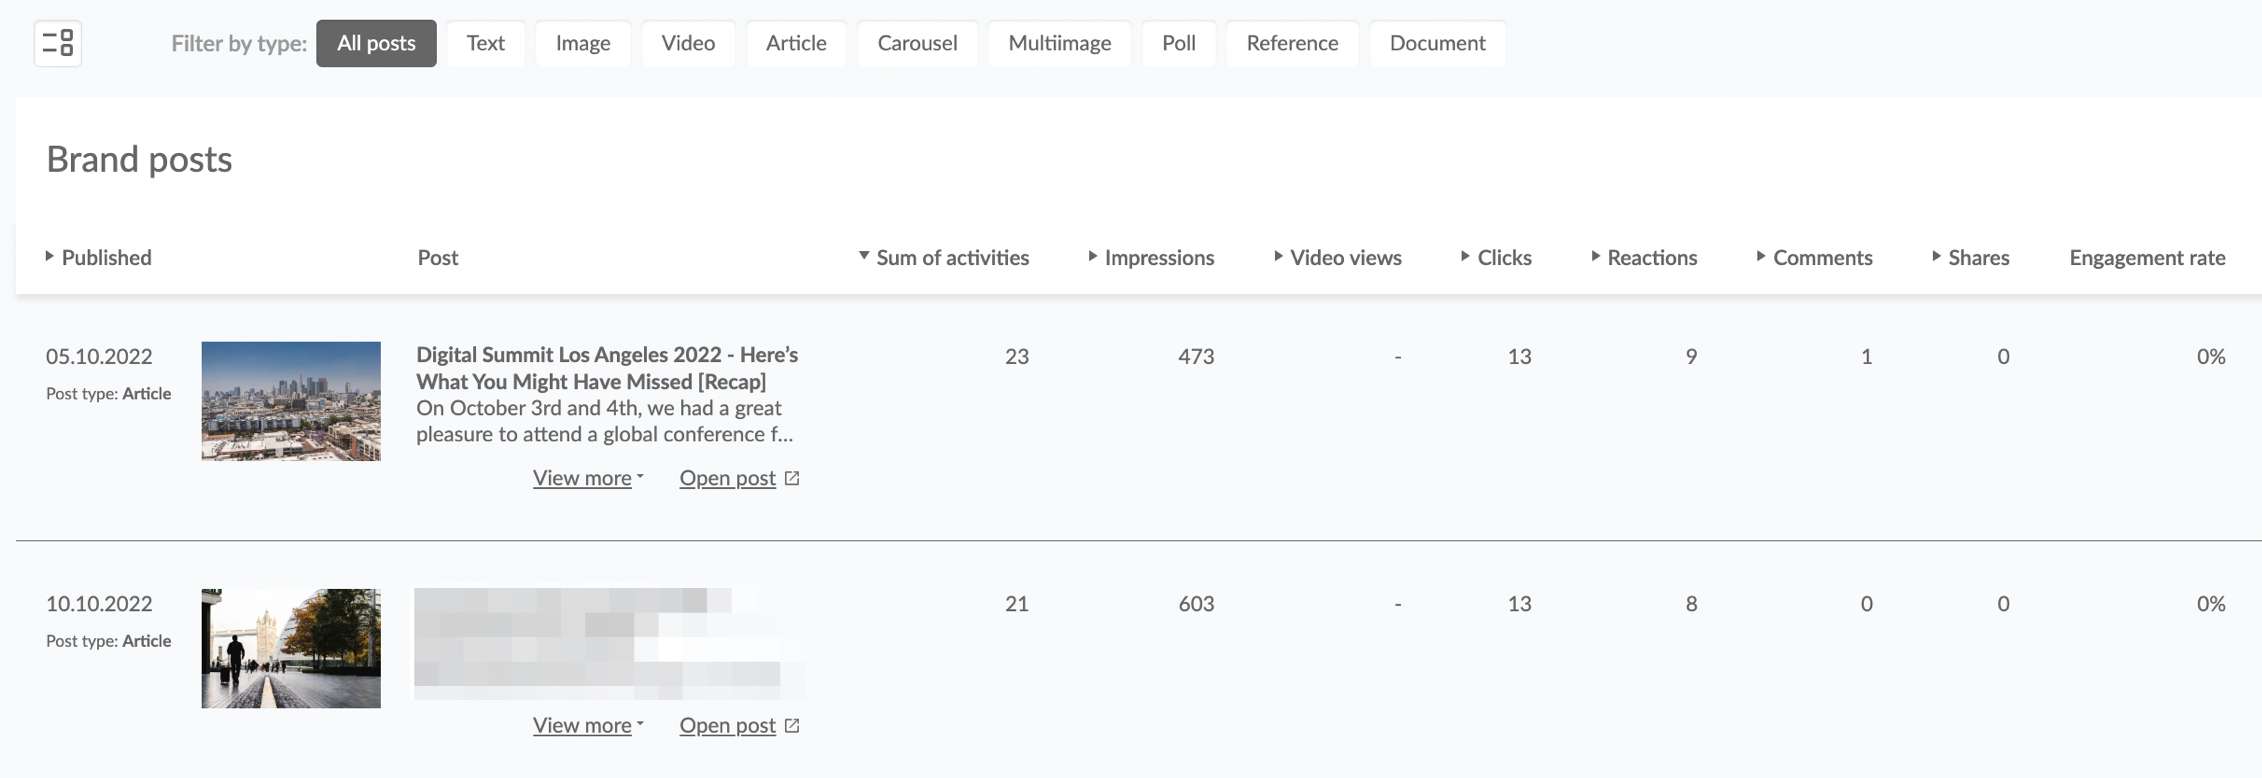
Analyze your LinkedIn post performance in Sotrender
In Sotrender you can see all of your posts embedded on a dashboard together with information about the number of reactions, comments, shares, and Interactivity Index. You can also view the most successful posts divided into format categories: picture, video, text, link.
Monitor which of your posts are the most effective
13. Include Previous Results
Another way to provide more context and to make your social data more understandable would be to sprinkle in some previous results. For example, you can choose to compare the results from your monthly reports with the results for previous months, or even the same month of the previous year.
14. Provide Your Expert Opinion
Another thing that can help your audience form a better idea about a particular social media campaign and its results is to add your expertise. Explain what went right or wrong, and give conclusions and recommendations on what can be done to improve future campaigns. Suggest the next steps, division of tasks among team members, goals, as well as deadlines.
15. Plan Out Your Presentation
Even though you are dealing with statistical data and graphs, it doesn’t mean your report has to be boring. Practice your presentation, map out where you are going to include visuals and examples, and decide how you will emphasize the most important bits of data. Try not to make it too long so that you can keep your audience’s attention.
Conclusion
And there you have it, 15 useful tips on how to make your social media reports more effective and useful. Start implementing them today and make the most out of your future social media campaigns.
Good luck!


