You open Instagram to check yesterday’s post.
Five minutes later, you’ve got LinkedIn open. Then TikTok. Then Google Analytics. Then another dashboard.
You’ve looked at the numbers, but you’re still not sure what actually happened.
That’s the curse of too much data across too many screens.
How are you supposed to track social media metrics when every platform is shouting a different number at you? The answer usually isn’t more dashboards or more reports. It’s choosing fewer metrics, aligning them with your social media goals and business goals, and reading the right numbers together so you can see the bigger picture without connecting every dot by hand.
You should probably track more social media metrics then, right?
Nope. You need to track them smarter.
You have to know which essential social media metrics and key metrics belong together and what they actually tell you. That’s how marketing teams, social media managers, agencies, and brands spot what’s working, what’s not, and what to do next – without getting buried in dashboards. This is what turns scattered platform data into insights you can use to understand audience behavior, optimize campaigns, and tie social performance back to real business results.
Here’s how you do that. 👇
Highlights
- Build benchmarks that tell you what’s normal for your brand.
- Read social media metrics together to spot meaningful patterns.
- Track the actions that lead to real business results.
- Follow content themes and leading indicators before results show up in revenue.
- Use AI and tools like Sotrender to surface insights, consolidate reporting, and speed up analysis.
- Review your data regularly and turn insights into action.
How social media metrics reveal performance patterns
Social media metrics are clues. They’re the breadcrumbs that lead you to what your audience likes and how they’ll behave next. For teams creating a social media app, the same signals can also show which interactions keep users engaged, which features encourage return visits, and where people drop off before taking the next step.
The trick is knowing which question each one answers through social media analysis.
If you’re asking …
- Do they care about my content? Check saves, shares, comments, and watch time; these engagement metrics show how your audience engages.
- Is my strategy getting better? Compare your results over time, not just one post.
- Are they taking action? Track profile visits, link clicks, and conversions.
- Are they even seeing my content? Look at reach and impressions.

But no single metric tells the whole story.
True insight comes from looking at the right numbers together and knowing what those combos mean in social media analytics, especially when you want to understand audience behavior and improve social media performance.
Anyone can track social media metrics. Start by setting goals, then choose fewer key social media metrics and other performance metrics that tie directly to business goals.
Let’s take a closer look. 👇
How to track social media metrics the right way
You’ve already got all the data you need. Now it’s time to turn it into actionable insight.
These are the habits I see good social media managers use again and again. They’re simple, easy to stick with, and they’ll help you understand your results without spending hours buried in dashboards, using social media analysis to turn the numbers into a clearer view of performance.
They’re the breadcrumbs that lead you to what your audience likes, reveal audience behavior, and show how people are likely to respond next. The trick is knowing which key performance indicators answer which question, so your social media strategy supports real business objectives and keeps your social strategy focused.
1. Build your own benchmark
Start by working out what’s normal for you.
Go back through your last 30 to 50 posts and calculate your average for:
- Engagement rate
- Link clicks
- Shares
- Reach
- Saves
You can do this in your own tracking spreadsheet to review historical data over time, including follower growth and audience growth alongside post-level results.
Now you’ve got context to measure against.
Choose key performance indicators that support your business objectives and social media strategy. This also gives you a better base for competitive analysis.
You can see what’s genuinely performing well, what’s just having an average day, and what’s worth digging into.
Keep updating that benchmark every month or two. (Both your audience and content change. Your benchmark should change, too.)
Psst … your last 50 posts are the standard you’re trying to beat.
2. Stop tracking posts. Start tracking patterns.
Go and grab your five or ten best-performing posts from over the last few months.
Now get your detective hat on.
What keeps showing up?
- A certain type of call to action?
- The same day or time?
- A similar opening line?
- A favorite format?
- A particular topic?
If your data is spread across platforms, keep your own tracking spreadsheet for the key numbers from those social media posts.
Those similarities are the signals to pay attention to.
One great post can happen for all sorts of random reasons. But five great posts with the same ingredients? This usually means you’ve found the secret sauce your target audience genuinely wants more of, which gives you a clearer content strategy and helps you judge specific marketing campaigns more accurately.
3. Read metrics together, not in isolation
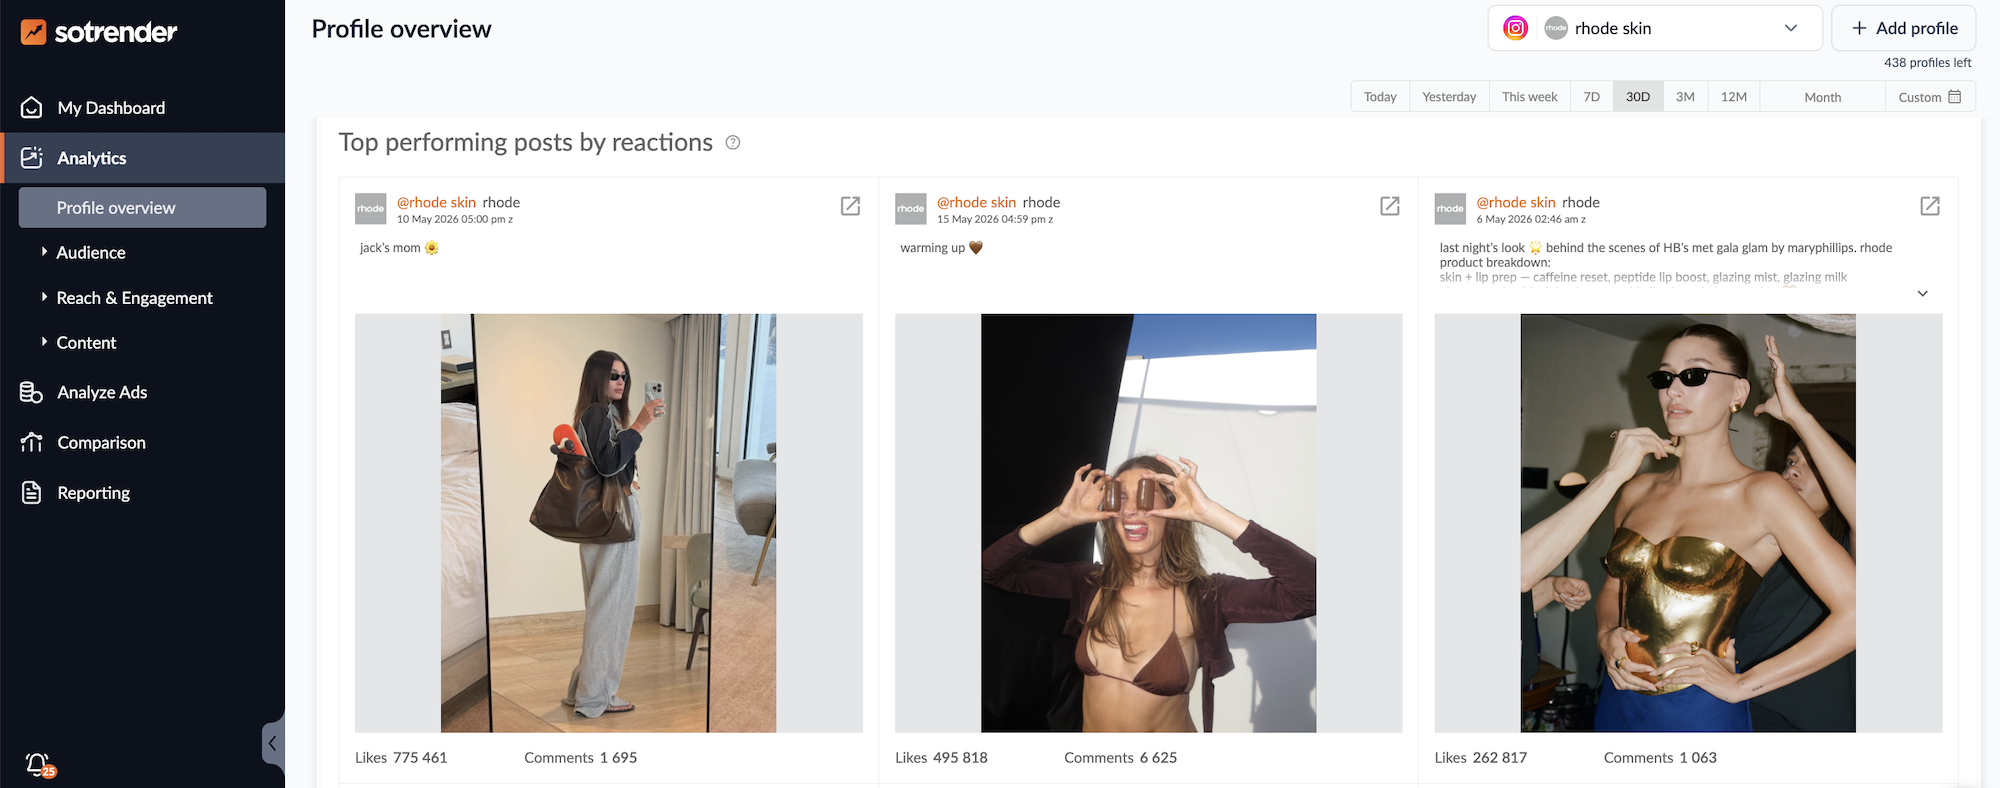
Pull up your latest post and look at how your metrics work together.
That’s where the bigger picture starts to emerge.
That’s why, as Gartner’s 2024 Marketing Analytics Survey found, CMOs who prove the value of their marketing well use a more sophisticated mix of metrics than those who rely on isolated channel metrics.

By looking at social metrics together, it’s clearer which social posts genuinely move people closer to becoming customers – and which just create noise. That gives you actionable insights into what supports real business outcomes, not just engagement, especially when you add traffic and conversion metrics and check the conversion rate from specific marketing campaigns.
Here are a few examples.
| If you see… | It usually means… |
|---|---|
| High reach + low engagement | Your hook grabbed attention, but the content didn’t keep it. |
| Low reach + high saves | The right people found it useful. More people probably needed to see it. |
| High comments + low clicks | People enjoyed the conversation, but the CTA didn’t convince them to take the next step. |
| High views + low watch time | Your opening sparked curiosity, but people quickly lost interest. |
| High profile visits + low follows | Your post sparked interest, but your profile didn’t persuade people to stick around. |
4. Find the metrics that move first
Pick one result you really care about. It should be an outcome related to your overall goals.
Maybe it’s leads. Maybe it’s sales. Maybe it’s sign-ups.
Now work backward.
What usually happens before someone becomes a customer?
For lots of brands, it looks something like this:
Shares → Profile visits → Website clicks → Leads → Revenue

For example, imagine an educational LinkedIn post receives twice as many shares as usual. That increase leads to more profile visits and website clicks over the following week. Even before new leads appear, those earlier metrics tell you the campaign is moving in the right direction and is worth repeating.
Revenue is one of the last numbers to change. By the time it drops, your campaign has probably been heading in the wrong direction for a while.
The earlier numbers give you a chance to step in.
Maybe people are sharing your content but not visiting your profile. Maybe they’re clicking through but not filling in your form. Every stage gives you a useful data point, including whether conversion rate shows that social posts are actually leading to action.
Click-through rate (CTR) is clicks divided by impressions, and it’s one of the clearest traffic and conversion metrics.
Those early signals are called leading indicators. Find yours, keep an eye on them, and you’ll spot problems long before they show up in your sales figures.
5. Follow people to the next step
Ask yourself one question about your last post: What did people do next?
A like is nice.
A comment is great.
But neither one tells you whether someone took the action you wanted.
Look for these next steps instead:
- Newsletter sign-ups
- Demo requests
- Website clicks
- Profile visits
- Purchases
For e-commerce brands heavily reliant on product discovery, evaluating these next steps often goes hand in hand with optimizing your catalog using a reliable Google shopping feed guide Shopify to ensure those clicks translate into actual sales.
The right “next step” metric for you depends on what your campaign is trying to achieve.
Here are a few examples.
| Campaign goal | Metrics to watch |
|---|---|
| Brand awareness | Reach, impressions, and profile visits |
| Website traffic | Link clicks and click-through rate |
| Lead generation | Form submissions and demo requests |
| UGC, reviews, or referrals | Content submissions and completed actions |
This matters even more when your campaign asks people to do something specific.
For example, maybe you’re collecting reviews. Or running a referral campaign. Or asking customers to share photos or complete a survey.
In these scenarios, likes won’t show you whether the campaign worked. Shares, visits, clicks, and leads form a useful chain of leading data points. Now work backward. The same logic applies when comparing social media campaigns with paid search campaigns. Revenue is one of the last numbers to change. For paid efforts, cost per conversion shows total ad spend divided by conversions, while ROAS shows revenue earned for each dollar spent; a good CPC often lines up with a 5:1 revenue-to-ad-spend ratio.
One way to make that easier is to give people a reason to take part that also doubles as a tracker. Incentives like digital reward cards can encourage more people to complete the action. They also give you a clear way to measure whether the reward improved completion rates, especially when you review results in one analytics platform.
6. Track your content by theme
Forget the platforms for a minute. Look at the content itself.
Group your posts into a few simple themes, like:
- Memes or entertainment
- Educational content
- Behind-the-scenes
- Customer stories
- Product updates
You can easily do that with Sotrender’s Content Performance analysis, which lets you tag all your posts with custom tags.
Now see how each theme performs across every platform.

You might find your customer stories do well everywhere. Your educational posts might get loads of saves on LinkedIn and Instagram. Your memes might get plenty of laughs but very few clicks.
Those patterns are much more useful than knowing Instagram grew by 2% or LinkedIn got a few more comments this month, especially when you compare themes across different social media channels.
One helpful habit is to review these themes monthly rather than judging them after a single campaign. For social media campaigns focused on action, the right “next step” metric depends on what you want people to do, and conversion rate often matters more than reach. Audience interests change over time, and content that performed well six months ago may no longer resonate.
Looking at long-term trends helps you decide whether a theme deserves more investment or simply had a temporary spike in popularity. It also helps you use audience analytics to spot shifts in audience demographics, tailor content more precisely, and see which themes support broader social media efforts. It also prevents you from abandoning valuable content ideas after one average-performing post.
Connecting social data to your website or analytics platform makes this much more useful because you can see what happens after the click.
Once you know which themes your audience keeps coming back to, you know what to create.
7. Bring your metrics into one place
Remember the six tabs you had open at the start of this article? This is where you close them.
Jumping between platforms and spreadsheets makes it much harder to see the full story. Built-in analytics can help at the channel level, but they still leave you switching views.
You need a tool like Sotrender to bring it all into one place.

Instead of switching between separate platform dashboards, you can compare performance using the same reporting framework. That makes trends easier to spot because every important metric is displayed in one consistent view. Unlike native platform analytics, a unified social media analytics platform pulls data from different social media accounts into one dashboard.
Instead of piecing everything together by hand, you can:
- Track multiple social platforms in one place
- Compare your performance over time
- Build automated, shareable reports
- Benchmark your competitors
Many social media management tools and social media management software combine publishing with analytics, but dedicated social media analytics tools usually go deeper on benchmarking and analysis. If you already use Meta Business Suite or other social media tools, connecting your social accounts here gives you broader reporting capabilities and more reliable automated reporting across channels. Audience analytics also helps explain why some themes work better on different social media channels. In a monthly review, audience demographics such as age, gender, and location can show which themes fit which audiences, helping tailor content to target audiences.
Now you’ve got one clear view of what’s working, instead of six dashboards competing for your attention.
If you’re an agency, social media reporting is usually just one part of the service you offer. You’re probably reporting on reviews and ratings too.
While Sotrender takes care of your social media reporting, white-label reputation management software can help you monitor, manage, and report on customer reviews. That means less time jumping between review sites and social platforms, and more time focusing on the insights your clients actually care about. In 2026, many platforms also provide psychographic and behavioral data, which helps refine social media efforts and future social media campaigns.
8. Let AI find the patterns for you
Give AI your performance data and see what it notices.
It can:
- Flag a post you haven’t noticed is outperforming the rest
- Explain a sudden spike in engagement
- Spot a trend you’ve missed
- Suggest what to test next
Sometimes all it takes is another pair of eyes. AI just happens to be very good at reading social signals and turning social data into actionable insights.
More marketers are catching on, too. As Gartner’s 2025 research found, 47% of CMOs using genAI say it’s improving the way they evaluate campaigns.

And this is just the beginning for AI in marketing reporting.
More tools are starting to build AI directly into the reporting experience. That means you get insights while you’re already looking at your data, without having to go digging for them. Automated reports also help present data clearly to stakeholders.
It’s the same idea behind an AI IDE, where AI is built into the development environment so developers get contextual guidance without breaking their flow.
Find patterns in your best posts
The story is already in the data, and AI can scan social data faster to surface actionable insights you might miss. Your job is to recognize it.
That’s what good social media tracking is really about. It helps connect day-to-day metrics to your broader marketing strategy and the business outcomes you need to prove.
Ask better questions and look for patterns that support smarter decisions. Start by choosing three metrics that match your current campaign goal, then review them together every week so your social media efforts stay focused. Expand your dashboard only after you’ve built a habit of acting on those core signals.
Sotrender helps you do exactly that. It brings your social media data together so marketing leaders can uncover the insights that matter.
No more shuffling through spreadsheets. No more juggling social analytics tabs. You get ONE clear view.
Ready to see the bigger picture? Try Sotrender today.
FAQs on social media metrics
Which social media metrics matter most for engagement?
Look at likes, comments, shares, saves, and engagement rate. Don’t stop at one number, though. Overlay the metrics to see what they tell you about the wider success of a post.
How often should I track social media metrics?
A quick check once a week is plenty for most teams. Then take a deeper look each month to spot patterns, review your benchmarks, and decide what to do next.
What are vanity metrics in social media?
Vanity metrics look impressive but don’t tell you much on their own. Follower count is a classic example. If your audience is growing but nobody’s clicking, commenting, or buying, it’s time to reassess your campaigns because nobody’s converting.