
If you’re a social media marketer, you definitely want to measure engagement on Instagram accurately and efficiently. To do that, you need a tool that will put all of your Insights data in one place for your convenience. Here’s how Sotrender can help you measure and reach conclusions about your Instagram profile.
Defining engagement
Engagement is a social media metric that indicates how and how often your target audience interacts with your brand online. Users can interact with your brand in different ways: they can like, share, comment, and respond to your InstaStories and stickers. It isn’t all taken into account when you look at the metric, though. What bigger picture do you get from this metric in that case?
Basically, it measures the dialogue between your audience and you. The barrier that is typically there between a business and consumers doesn’t exist on Instagram. Instagram combines both business and personal content on your feed, so users will feel more comfortable talking to you than they might on LinkedIn, for example. This helps build a relationship with your audience, and it’s this mix of banter, loyalty, and personalization that drives sales on their platform. That’s why marketers strive for growing engagement.
However, Trust Insights reported that since May 2019, engagement rates for businesses have gone down on Instagram. You need to find ways to stay relevant to your audience, but it isn’t effective to just post random, chaotic content. If you do that, you won’t know to what extent you are engaging your audience and what content to post until you check your analytics.

Where can I find engagement data?
If you understand the article up until now, then so far so good. But do you know how to measure engagement on Instagram on your own? There are two ways you can do it: you can use our tool to measure it precisely, or you can use Instagram Insights within the Instagram app itself.
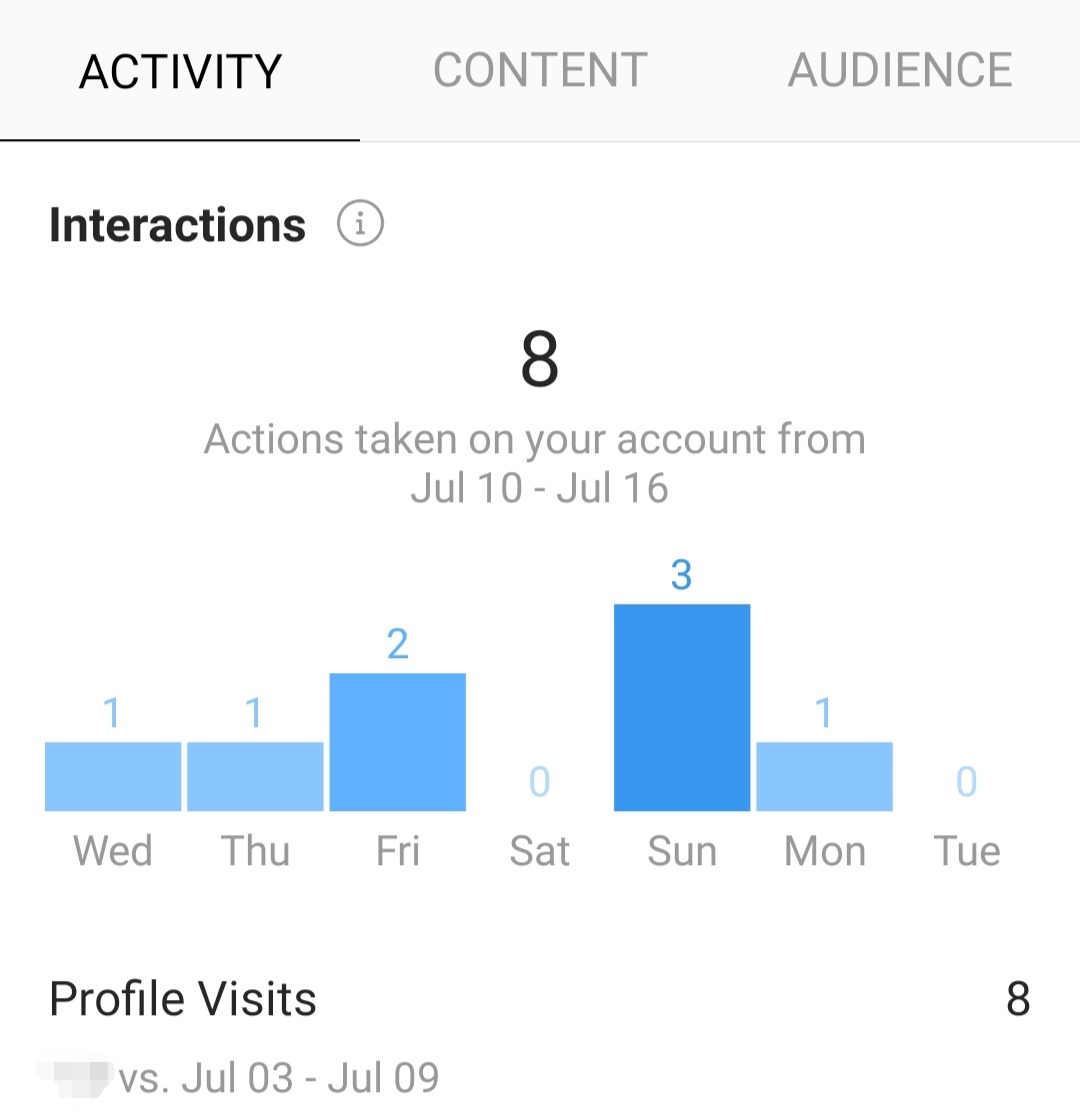
Unfortunately, Insights doesn’t tell you directly how you can measure engagement on Instagram. In fact, their metric is limited to “activity”. You won’t be able to track your “activity” over an adjustable period of time either. You can click on individual posts from your profile and see post Insights, but counting number of comments and likes isn’t going to give you a good understanding of how active your followers are over time.
Since you can’t get this information straight from the horse’s mouth, you can get it from us. 😉 We’ll guide you through all of our engagement metrics that you can find in both our tool and reports. Let’s get started.
You generally want to answer these questions:
- When should I post? When are my followers online?
- What should I post to get the highest engagement?
- How do my followers interact with my content?
With Sotrender, you’ll get to answer those questions rather quickly just by looking at our engagement metrics in the app.
Deep-diving with Sotrender
If you don’t have a subscription for our service, don’t worry, this article includes screenshots that should help you follow along. If you want to try it out for yourself, you can use the 14-day free trial version of the tool. All of the features we’ve included in this guide are available to trial users.
This is what our Reach & Engagement tab overview looks like. You can see diverse graphs displaying different components of reach and engagement metrics.
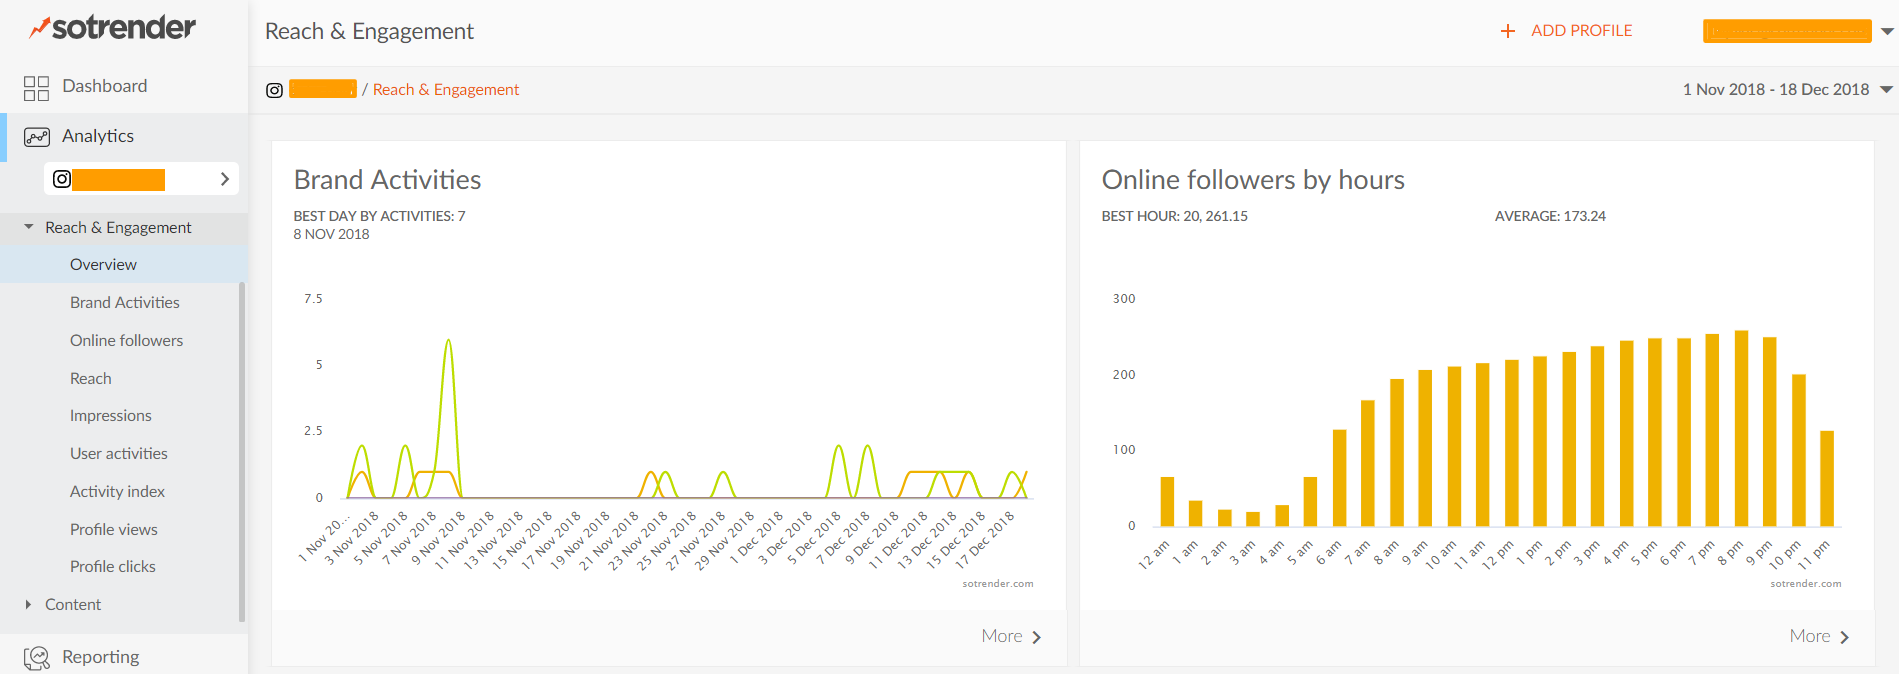
When you scroll through this section, you should be able to see general patterns and results from Insights. If you want to look at more specific results, just click on the collapsed menu to select a metric you want to know more about.
Open up the Online followers tab.
Let’s try to answer the first question. How can you figure out when to upload your posts? One way is through the heatmap. As you can surmise from the name, the hotter, the better. The heatmap is divided into days and hours, so you’ll see when your followers are most and least active on Instagram.
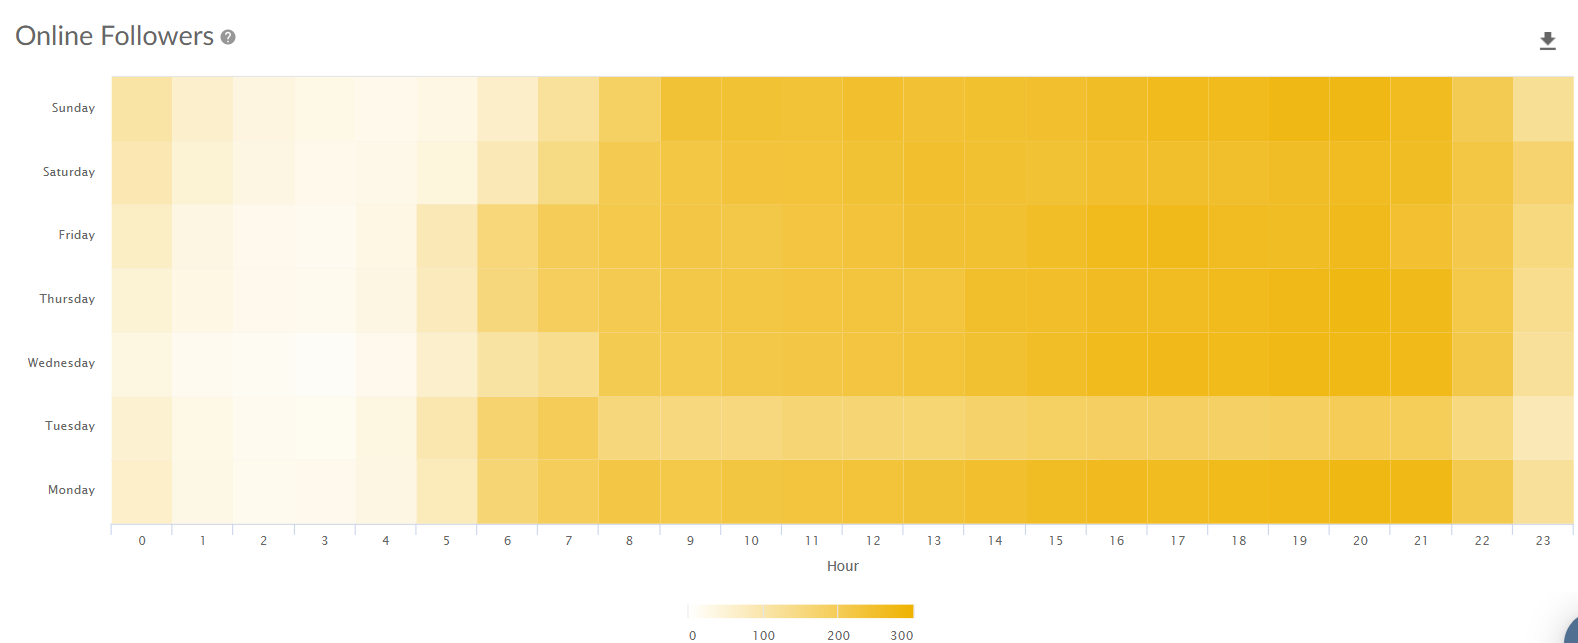
You should modify your content strategy according to the results because that’s when your followers are most likely to engage. If you’re posting content at 3 AM, it’s no wonder your followers aren’t engaging with your content – they’re not even awake! Although there are some general findings on the best posting times, that may not be the case with your target audience. Parents have different schedules than students, and those groups have different schedules in comparison to second shift workers.
You don’t have to check this metric every time, but it helps significantly to know when you should schedule your posts.
User activities
Now let’s find out “how” your followers interact with your content.
Open up the User activities tab. The first thing you’ll see is a bar graph displaying the types of activities by your users. This graph is organized by date, and the activities are stacked. As you can see from this graph, there are usually more likes than comments or shares. Hovering your mouse over each bar will tell you the exact number of each activity type.
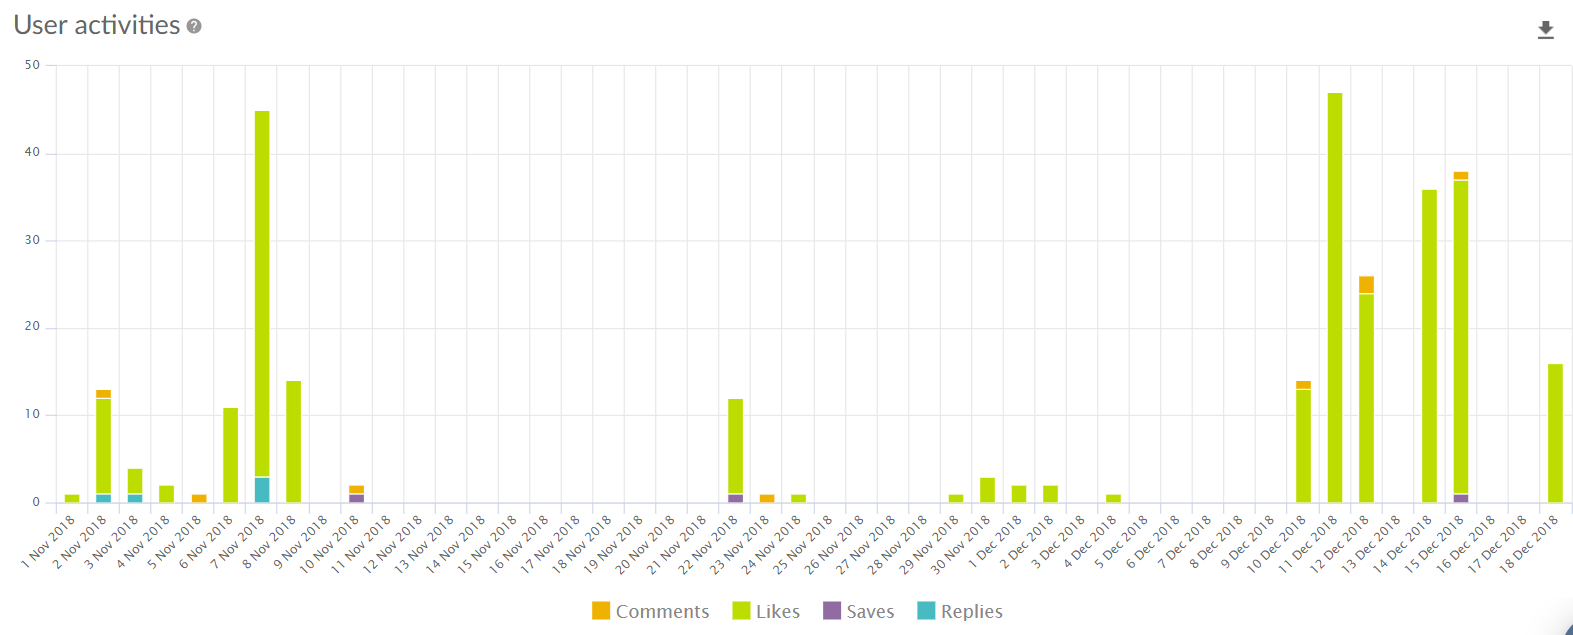
You should generally pay attention to the days that had more variety or comments. That indicates what type of content is getting people to interact with it. Although it’s good to have a high number of likes, having more comments shows you that there’s a conversation happening under your post.
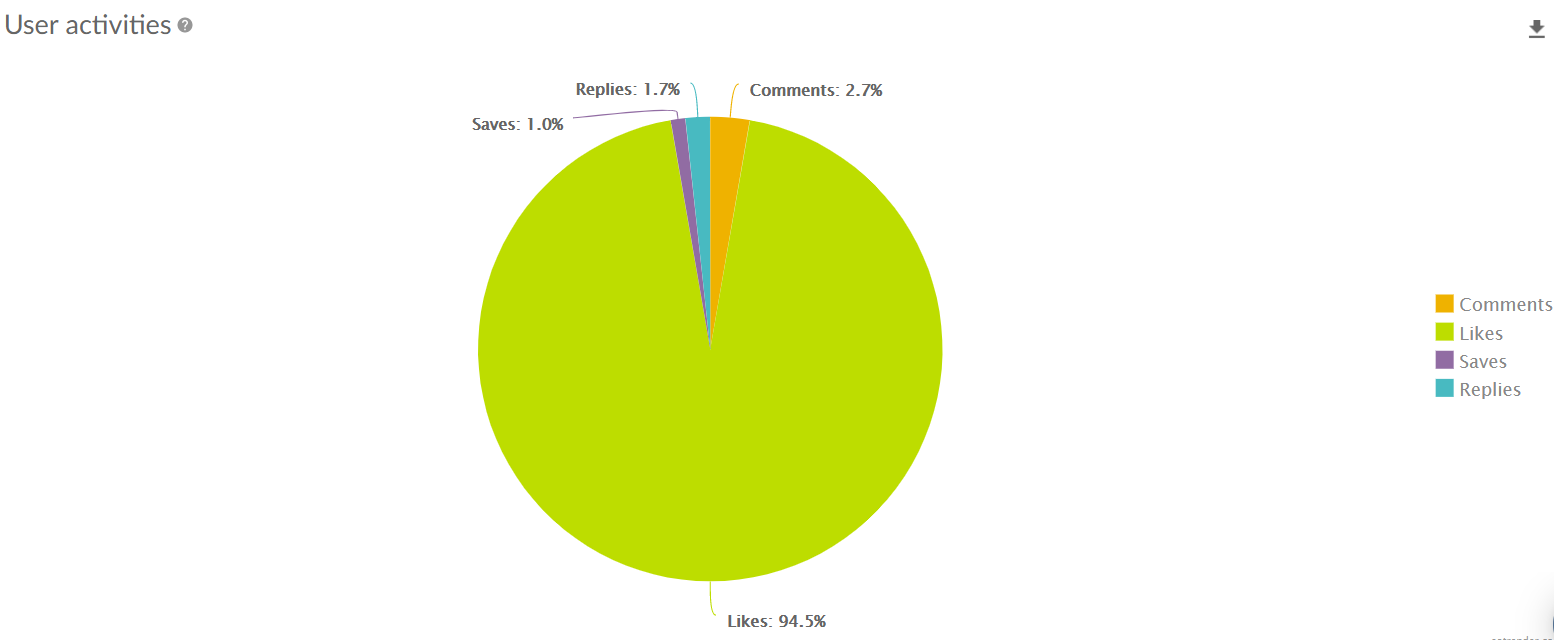
If you want to visualize proportionality, look at the graph below. You’ll see user activities presented in a pie chart with their respective percent. This should make it easier to see what kind of interactions are the most and least popular among your followers. If you want to see what was the best and worst day on average, that information is underneath the pie chart.
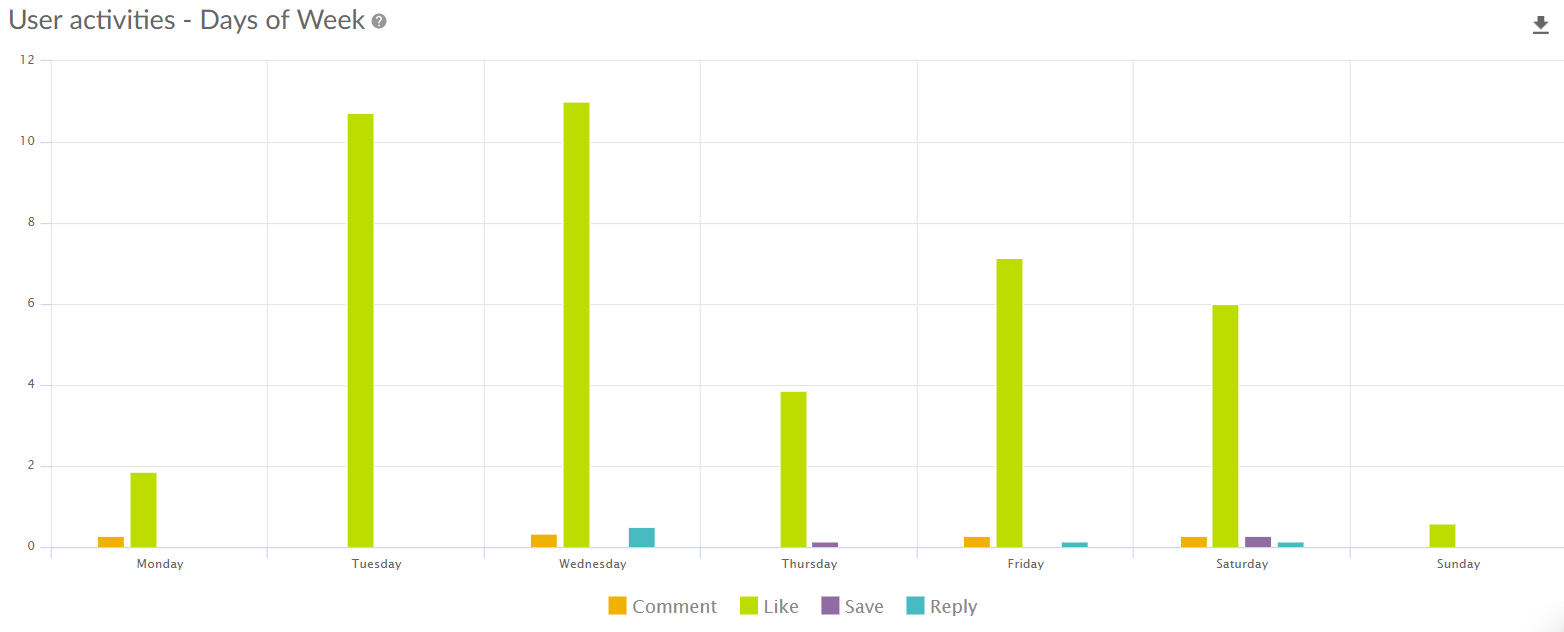
Now we have the user activities by days of the week. This shows you the average number of activities every week. If you’re wondering what’s a good posting time, that’s a good starting point. You’ll see what days had the most and least activities on average, and can plan your content calendar based on that.
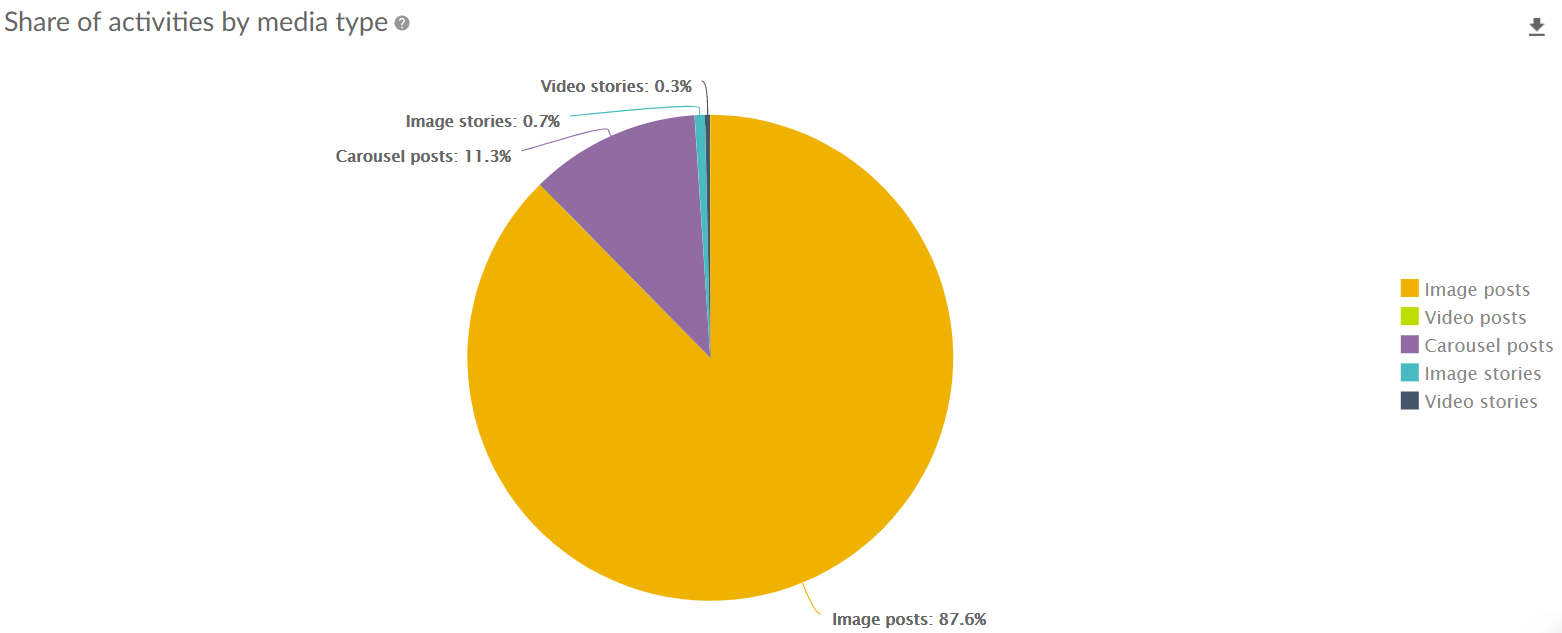
What if you want to know what type of content had the most activity? Then there’s the pie chart that represents shares of activities by media type. Based on this chart, you should be able to tell that image posts got the most interactions from followers. Now you can answer the question of “what” to post.
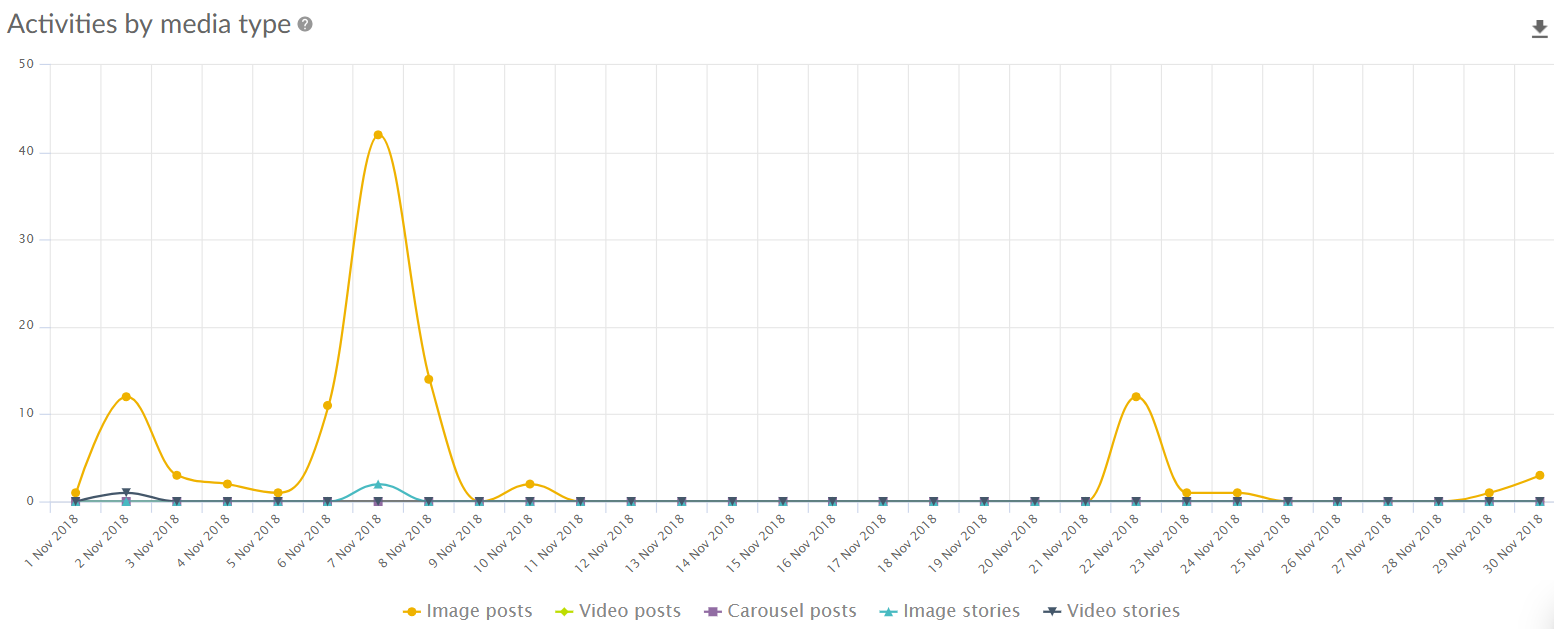
Alright, so now you might want a summary of the time you wanted to examine. This next graph indicates whether there is a trend in the amount of activity, dates, and post type. You would benefit from examining the activities by media type line graph so you can see the progress. Here, you can see the dates, so you’ll know which posts got you the most and least activity.
This graph is also really helpful when you want to generalize. For example, planning your content strategy in December and January will become easier since you’ll have a good idea of when exactly your clients are off for the holidays.
Activity Index
Before we deep dive into the next set of engagement metrics, I want to quickly direct your attention to Sotrender’s Activity Index.
As you can imagine, not all interactions are equally engaging. It’s easy to passively like content, but that doesn’t directly influence sales or revenue. It’s indicative of interest and loyalty when your followers leave comments and share your posts in their stories or to other users. Here’s how it’s calculated in our tool:
- Likes → 1
- Comments→ 8
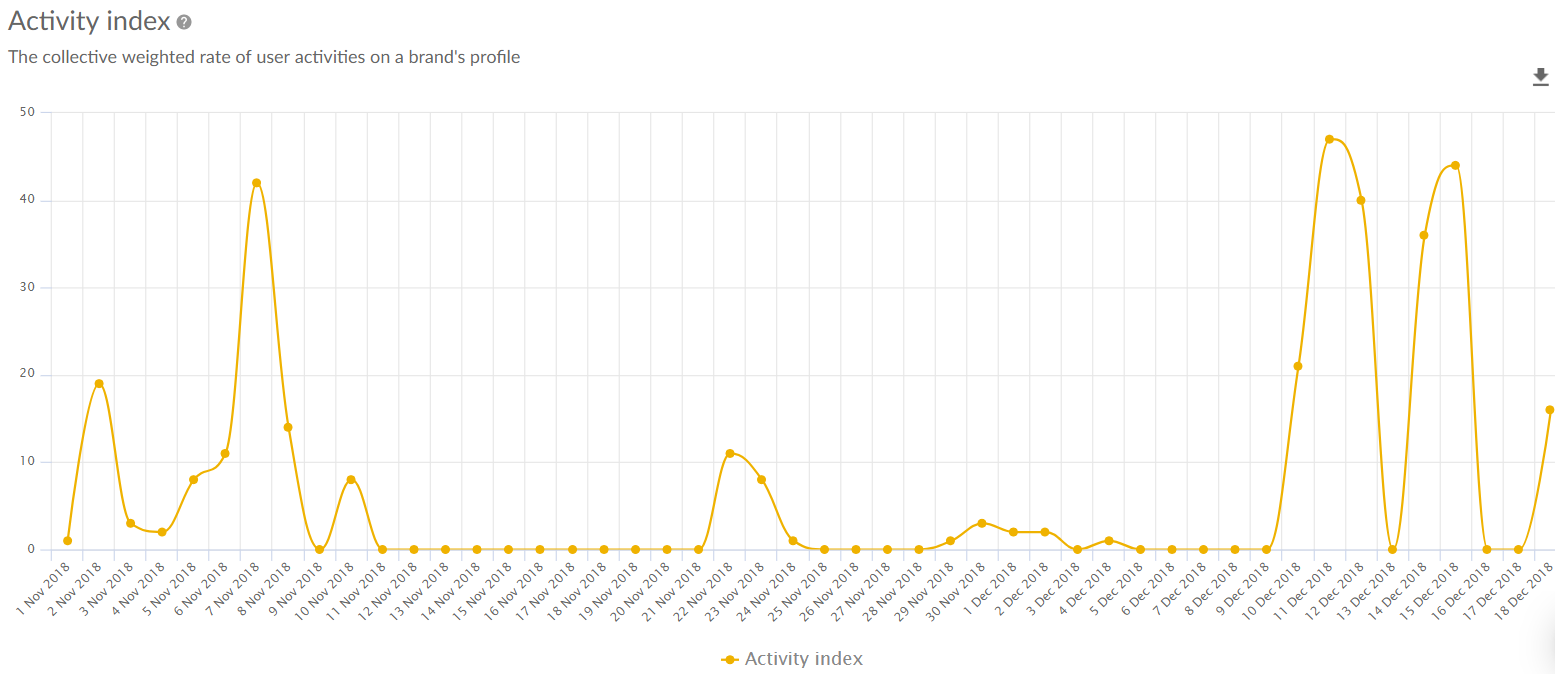
The Activity Index line graph shows you the general pattern of activity on your profile. This is, of course, after the activity types were assigned weights. Now you can see that your followers were particularly active towards the end of the time-frame. You can then click on the points on the graph to see what specifically gets a reaction out of your followers.
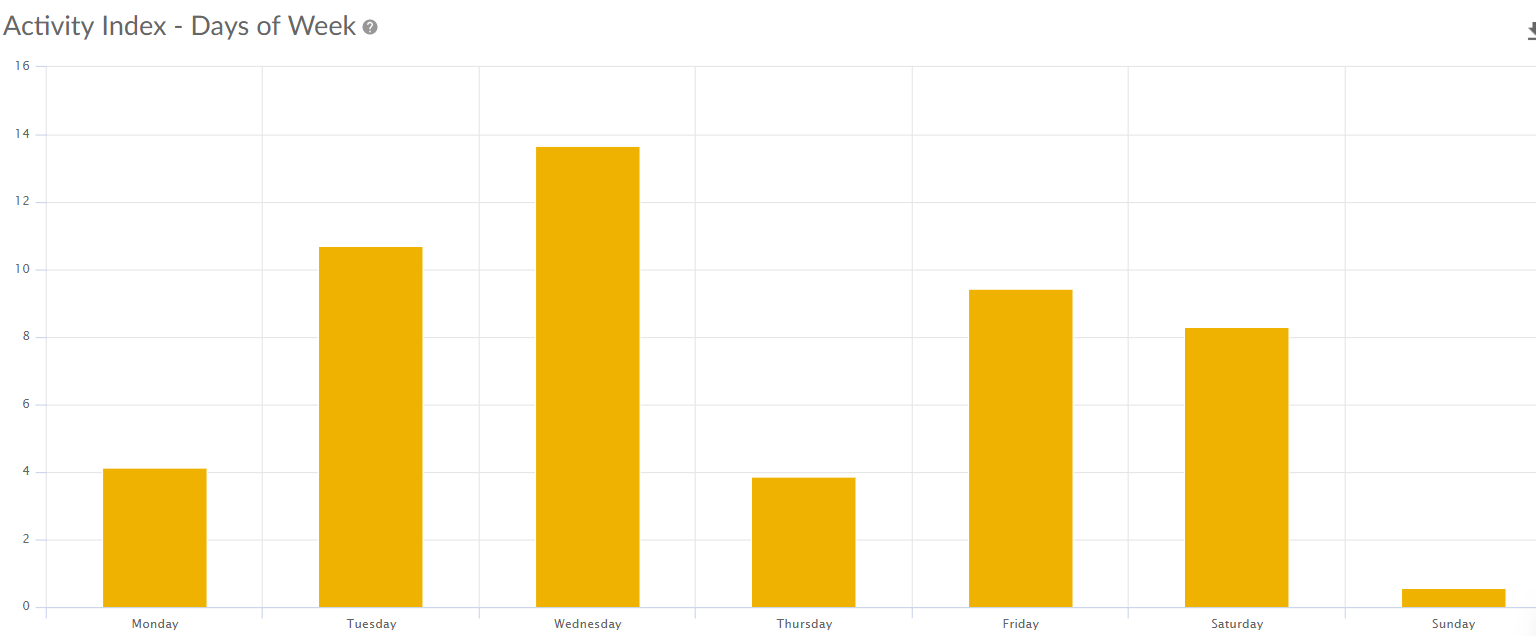
Remember the user activities by days of the week graph? That one didn’t weight user activities according to the Activity Index, but this one does. Perhaps you want to see the data on a daily basis to decide what days you should be posting to improve your odds of getting comments or likes. It’s a helpful way to plan your strategy over a week. Based on this graph, you can see that Tuesday and Wednesday had quite a lot of meaningful interactions compared to Sunday.
Reporting made easy
Good job! At this point, you know how to interpret the results of your profile’s engagement metrics. To make life even easier, you can generate an automatic report that includes all the metrics you want from the application. It’s all of the same data as on the app, but summarized in a PDF along with tips to improve your profile’s performance. Now you don’t have to spend time creating a presentation or report on your own.
Comparative reports
Now that you know how to measure and report engagement on Instagram using our tool, I’ll introduce you to another helpful feature. Sotrender’s comparative report for Instagram helps you compare yourself to the competition on many different levels:
- Engagement using the Relative Activity Index (Activity Index / 1000 followers)
- Activity variation under posts
- Posting times
- Differences in post types
- Hashtags used
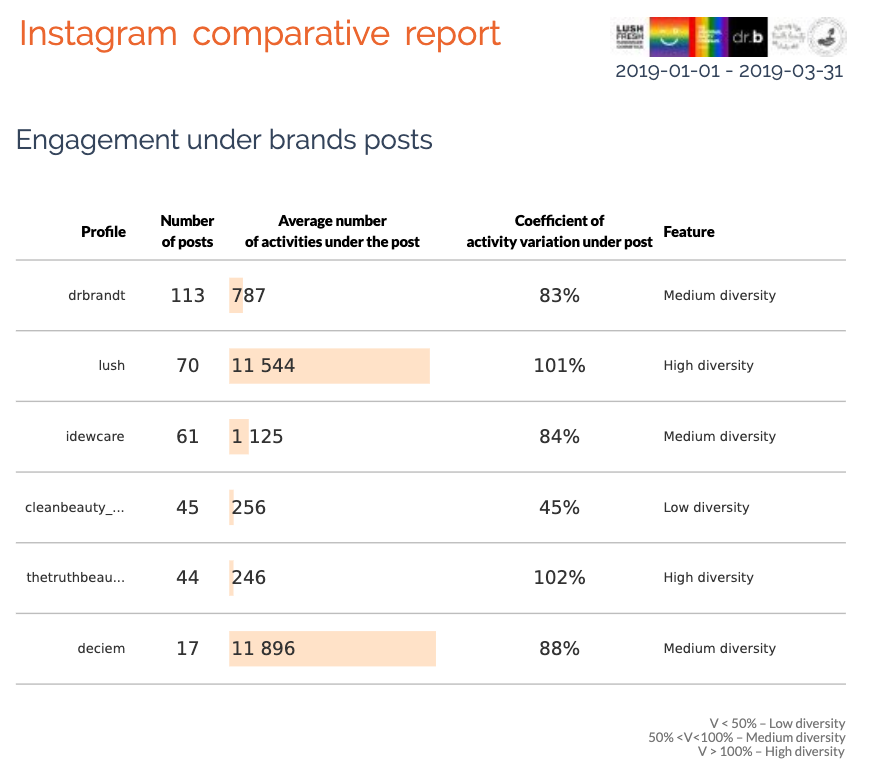
Engagement under brands posts
We recommend you read about the comparative report in more detail in our other blog post.
Although the report provides you with detailed data, you will not be able to see all of the same metrics for your competitor’s profile. This is because the API does not allow for you to access Insights other than your own. Therefore, depending on what the API provides, no one can get anything more.
Ready, set, engage
Engagement is everything on Instagram. It’s what helps the algorithm determine whether your content is going to appear in your followers’ feeds or sink into irrelevance. You have to know when your target audience is on, what kind of posts they like, and how do they behave with your content.
Sotrender is a handy tool when you want to measure engagement on Instagram while saving time and resources on doing it yourself. So if the graphs made it easier for you to answer the right questions to improve your content strategy, you should try it out. ?
If you want to know more about how to analyze other metrics, check out our other posts:
- Complete Guide to Sotrender’s Instagram Business Analysis
- Why Facebook Engagement Matters and How You Can Increase It
- Measuring Engagement in Social Media


