
Instagram is booming! The platform recently surpassed 1 billion users worldwide. And it’s not just user growth that’s moving in the right direction; Instagram is seeing a big-time rise in ad dollars coming to the platform. It seems brands have found greener pastures on Instagram over Facebook’s News Feed.
Edit: This post was edited in July 2019 to reflect the changes in Instagram’s application, as well as our own reports and application.
These facts shift the balance of power and call for changes in the way we prioritize and analyze social media data.
At Sotrender, we’re constantly improving our product to always deliver a better user experience and life-saving features.
Although the implementation of these new elements wasn’t an easy task, we’ve been working hard to exceed the expectations of social media experts. Our goal was to create an insightful, versatile social media analytics platform that gives you a full picture of your social media data and ideas on how to grow your channels.
And here’s the result!
Today, we’re launching a new product called “Instagram Business Analysis”. This update is a big one.
Welcome to Sotrender’s New Instagram Business Analysis!

If you want a basic summary of your business profile’s social media metrics, you can get it by using Instagram Insights. Insights display metrics in a rather simple way, so you’ll be able to see basic metrics such as follower demographics and reach. Insights allow you to filter your posts by engagement, comments, likes, or reach per post. In case you are curious about specific posts, you can also view those Insights under the post itself. Unfortunately, for some metrics, Insights only offer a basic dataset for the last 7 days only, so sometimes it’s hard to collect long-term data and measure progress over time.
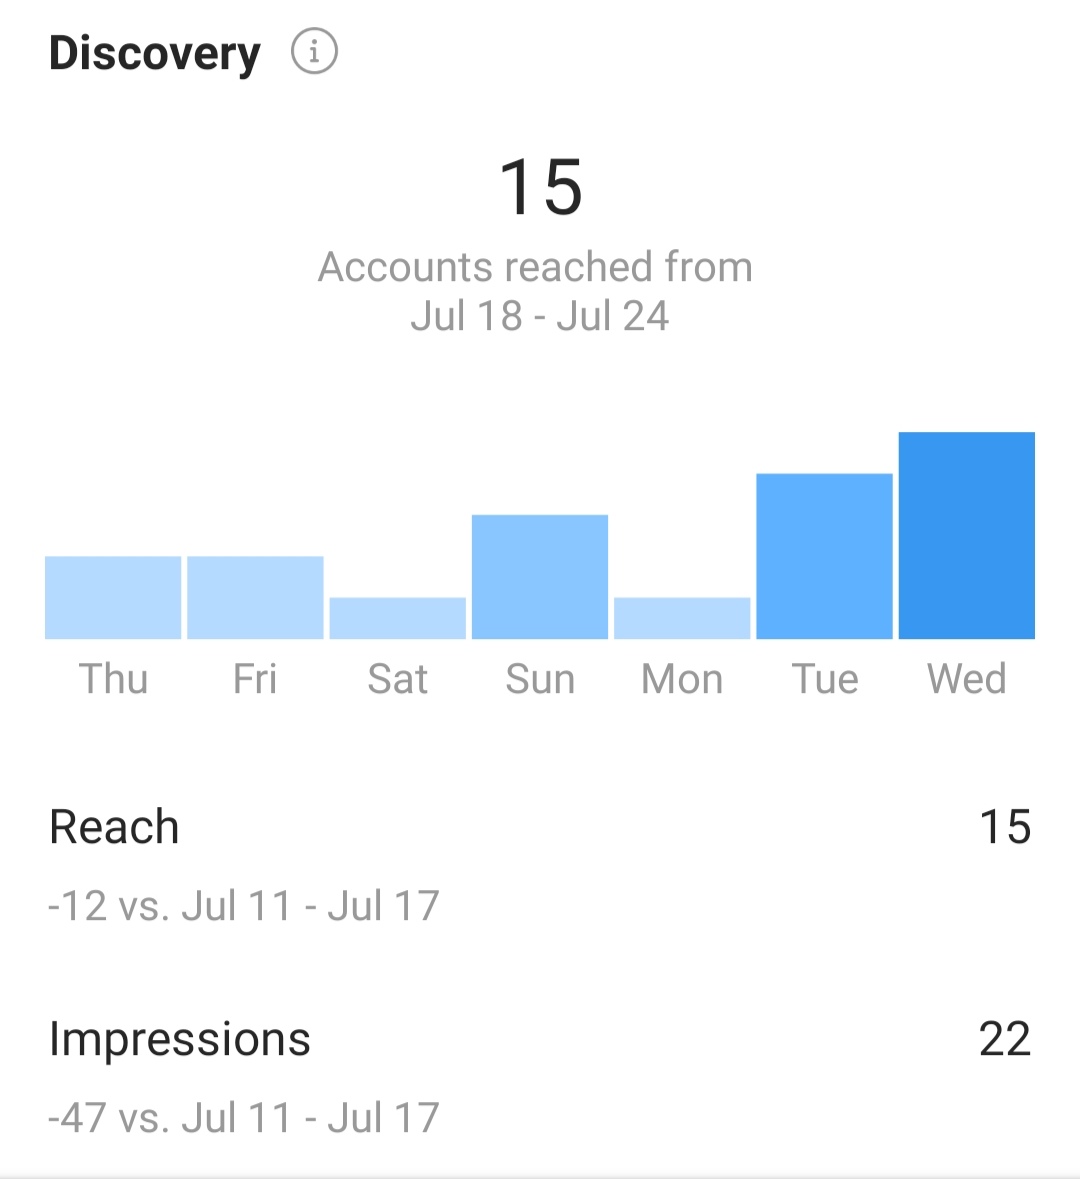
Instagram Insights: reach
Although Insights provide a quick look, tools such as Sotrender give you a detailed picture of your content strategy and individual post performance. All of the relevant metrics are nested together, while the date range is easier to change. The information that Sotrender gathers for you is succinctly presented in graphs with tooltips to help you better understand how we present the metrics. It’s also thoroughly explained in auto-generated reports, where you can get tips and comments about what you can change to improve your performance.
From now on, you can get a complete, meeting-ready social performance analysis of your Instagram business profiles with Sotrender, posts, and Stories included! Our advanced analytics software is much more precise, granular and flexible to use than Instagram Insights. Here’s what Sotrender can do for you; discover how to read and apply our statistics to your daily work to get the best results.
Our New Instagram Business Analysis is divided into three extensive sections:
- Profile Overview
- Audience
- Reach and engagement
- Content
For a thorough understanding, I’m going to guide you through each and every section. I’ll also discuss how to start analyzing your profiles with Sotrender.
Let’s jump right in.
Instagram Audience Analysis
The first section of Instagram Business Analysis takes you to the world of audience statistics. At this point, Sotrender breaks down your follower data into:
- Total Number of your follower base
- Location data
- Language data
- Demographics
*Every chart is clickable and will share the details of the specific point of reference.
Number of followers
First, you’ll find three downloadable charts that tell you everything about the volume of your Instagram follower base. Use these factors to check if your profile implies stable and healthy growth.
- See your total follower volume and track how it evolves day by day.
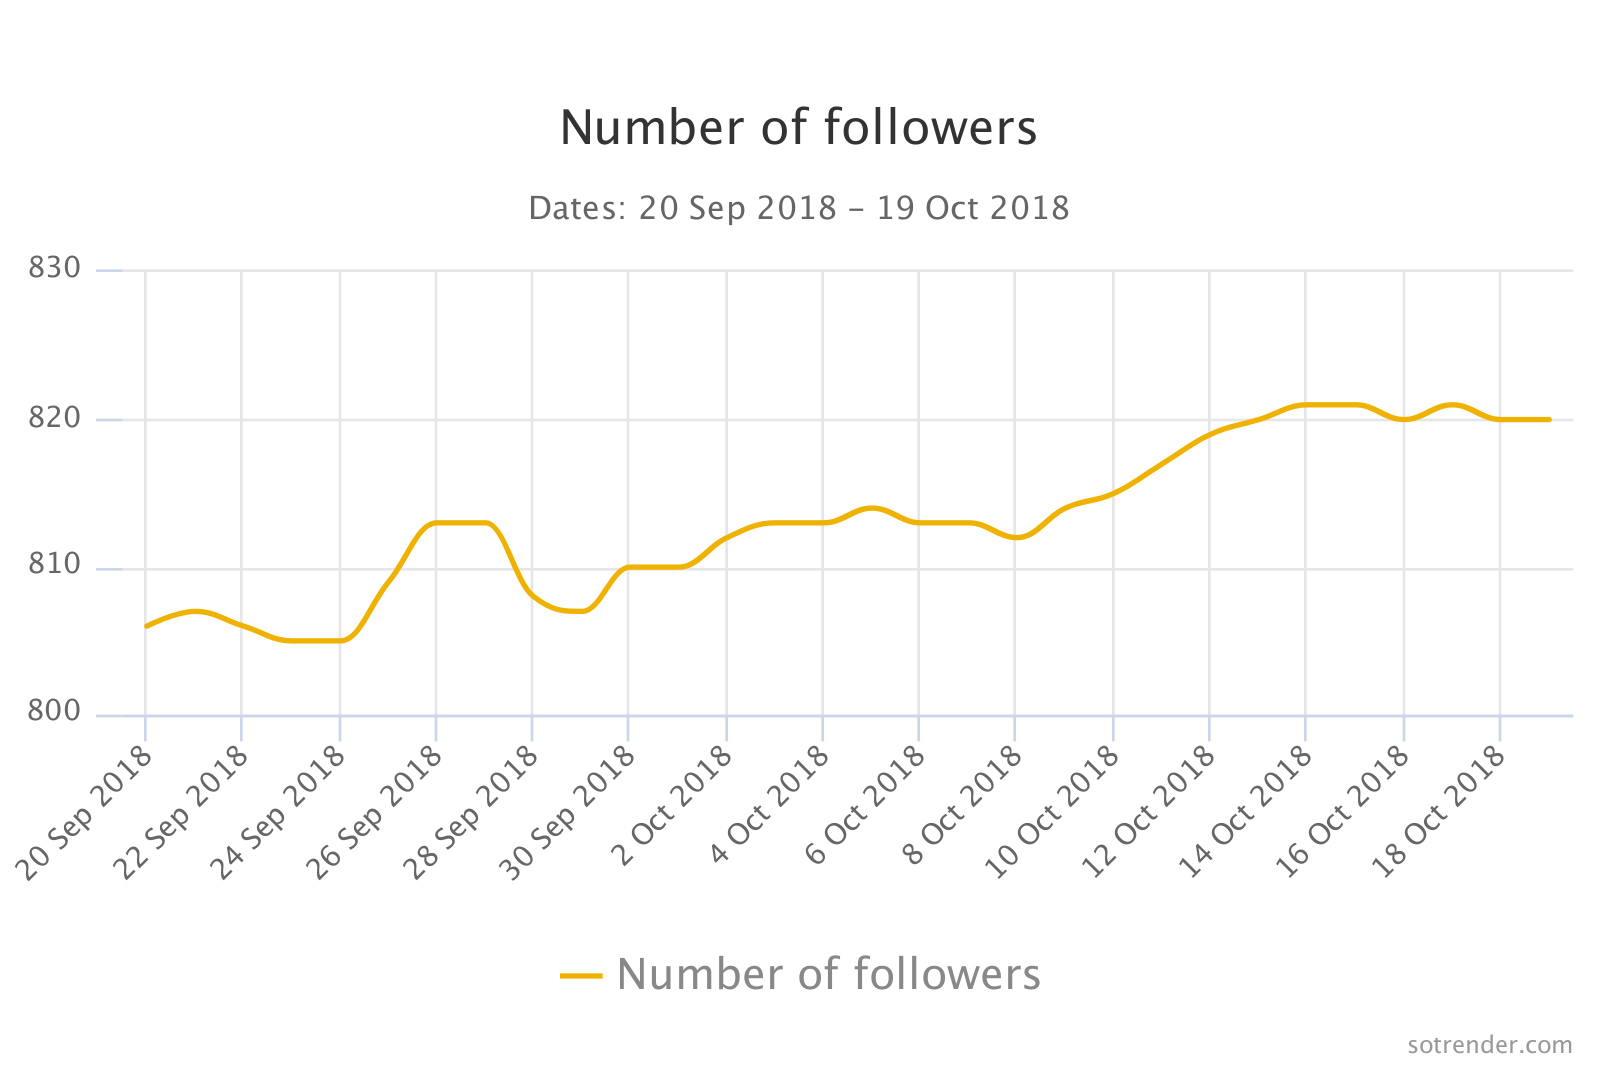
Number of followers
- Look into your exact follower growth day by day.
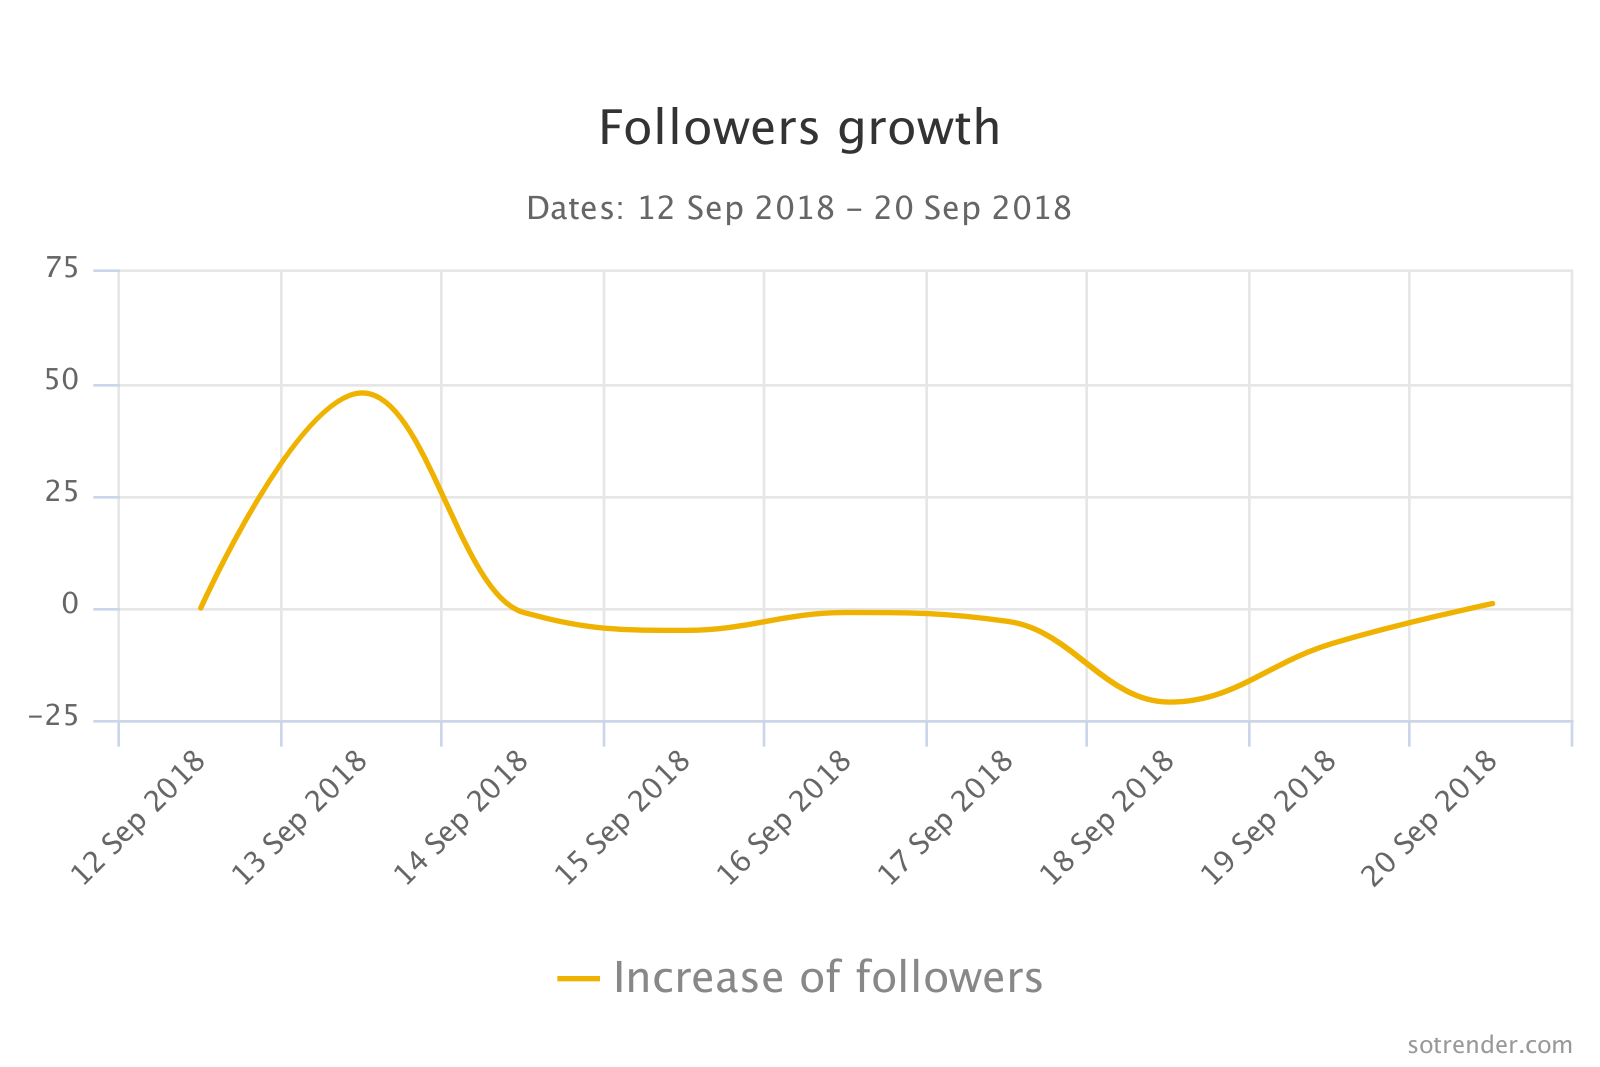
Followers growth
- Understand your follower growth rate over a defined period of time. This specific metric tells you more about the dynamic of your profile’s following growth. Are these rapid jumps? Or perhaps an upward line? Get to know it and relate it to your brand activities.
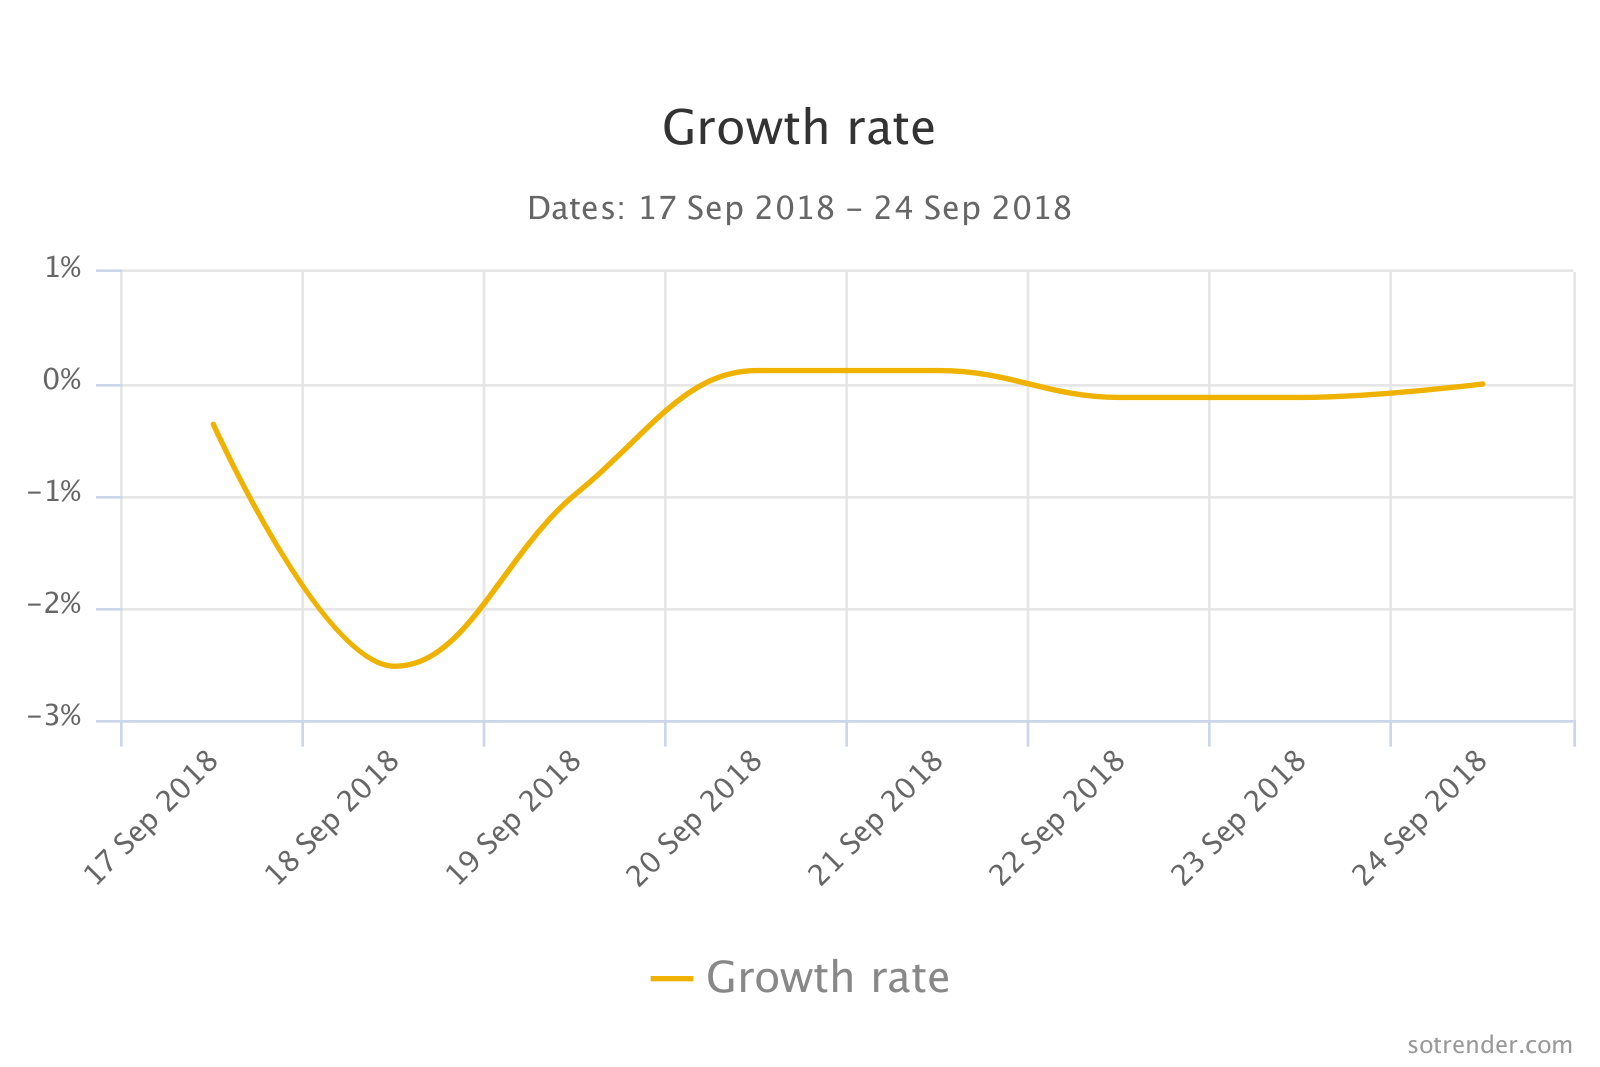
Growth rate
Follower Location
Second, we’ve included follower location data to let you identify where your fans are coming from and better optimize your marketing campaigns. Basically, in this section you’ll find three things:
- Your total follower number categorized by a specific country.
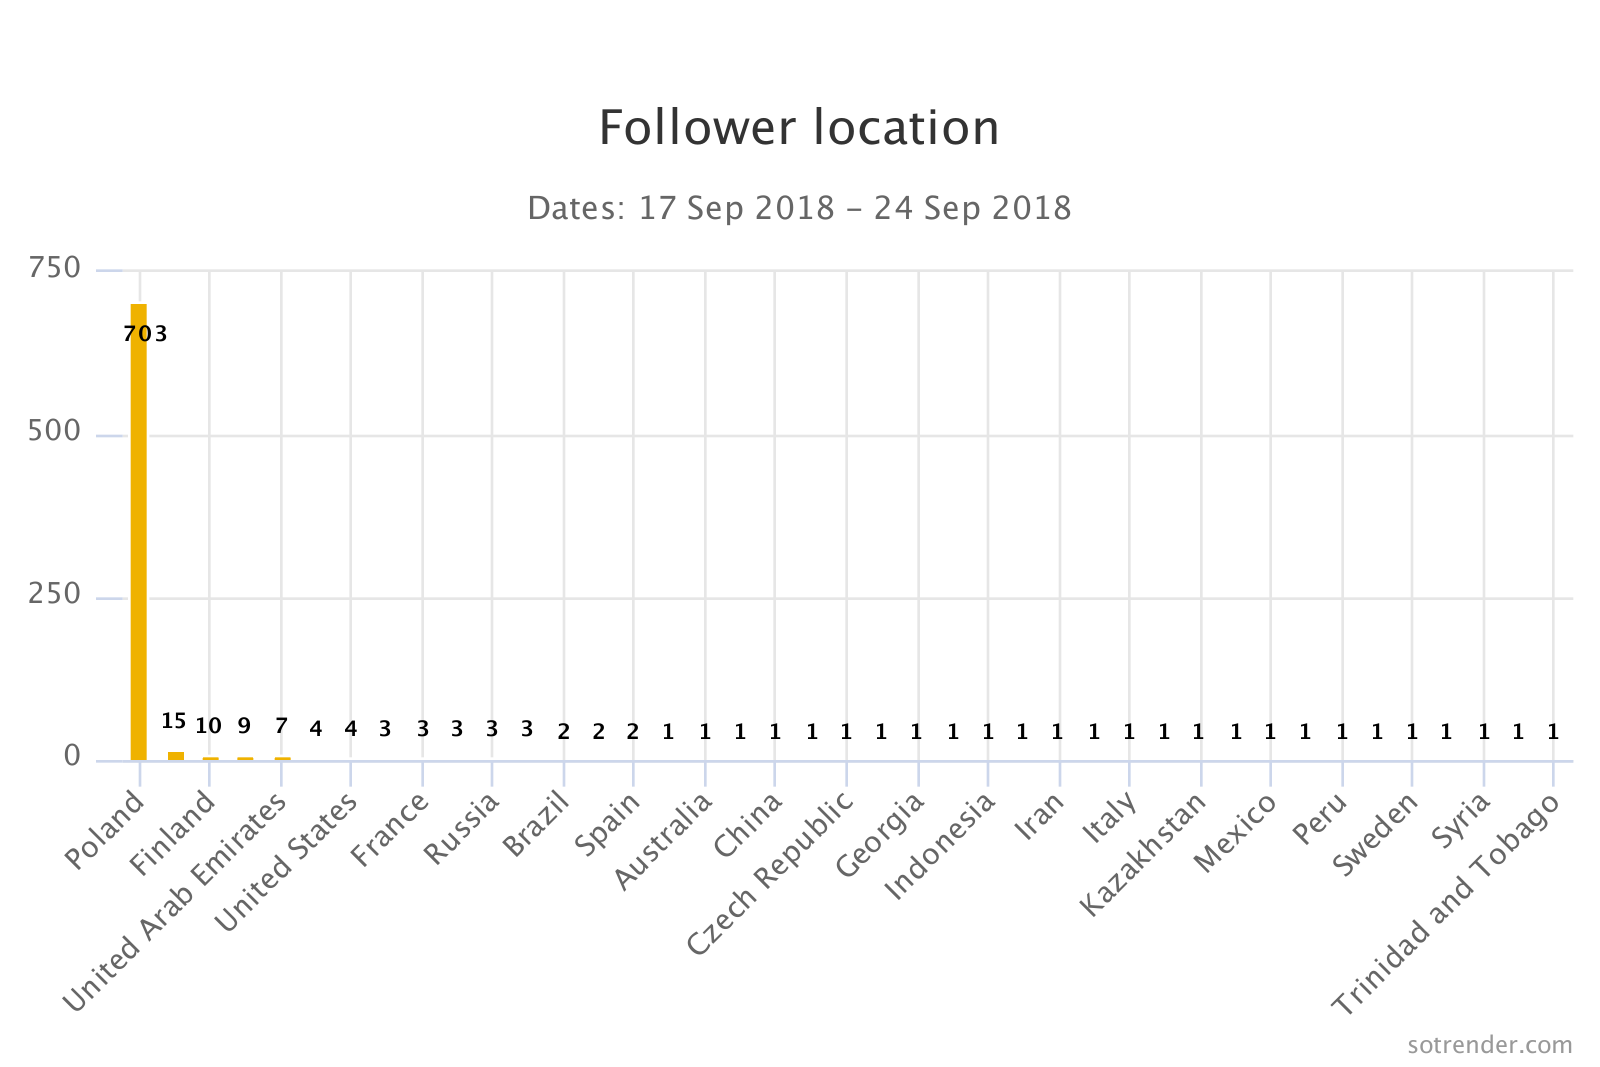
Follower location
- Two lists of the top countries and top cities your followers are from.
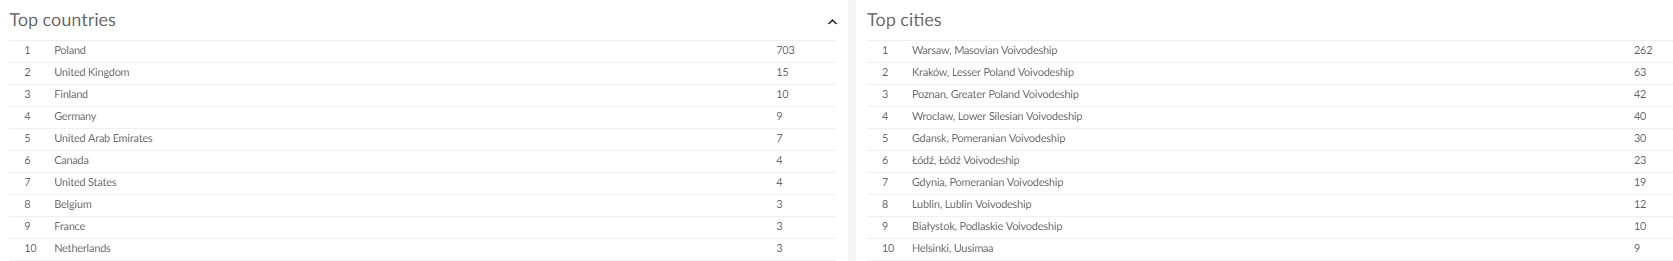
Top countries & top cities
- Observe how the number of followers changes by country. This chart is editable, so you can include and exclude any follower locations.
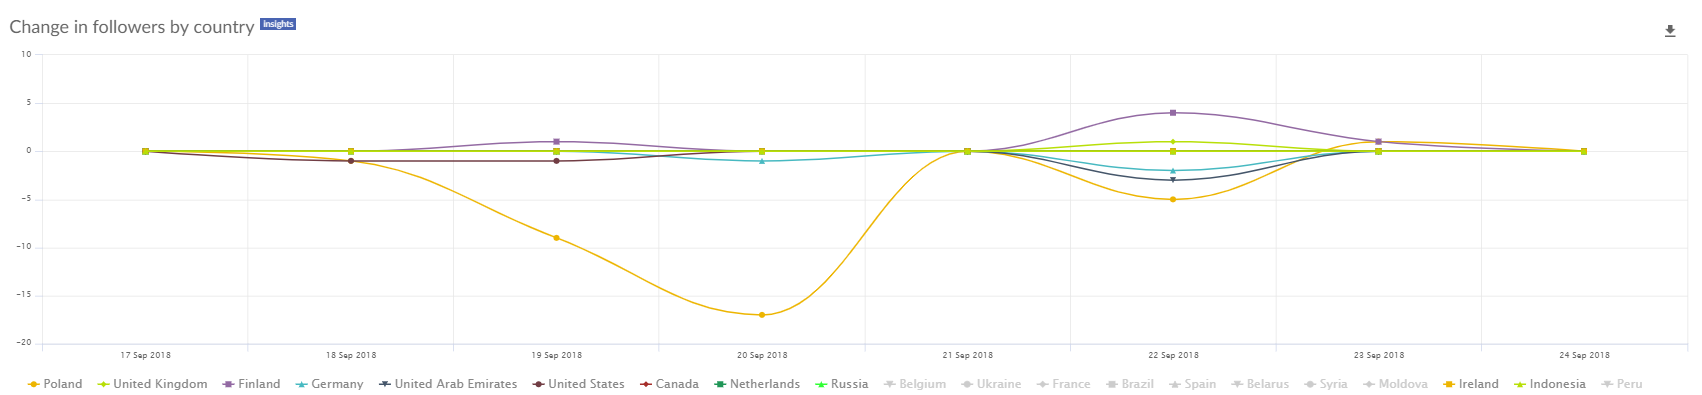
Change in followers by country
Followers by language
This dataset breaks down everything about the language of your follower base.
And so, you’ll be able to do two things here:
- See the total follower number categorized by a specific language.
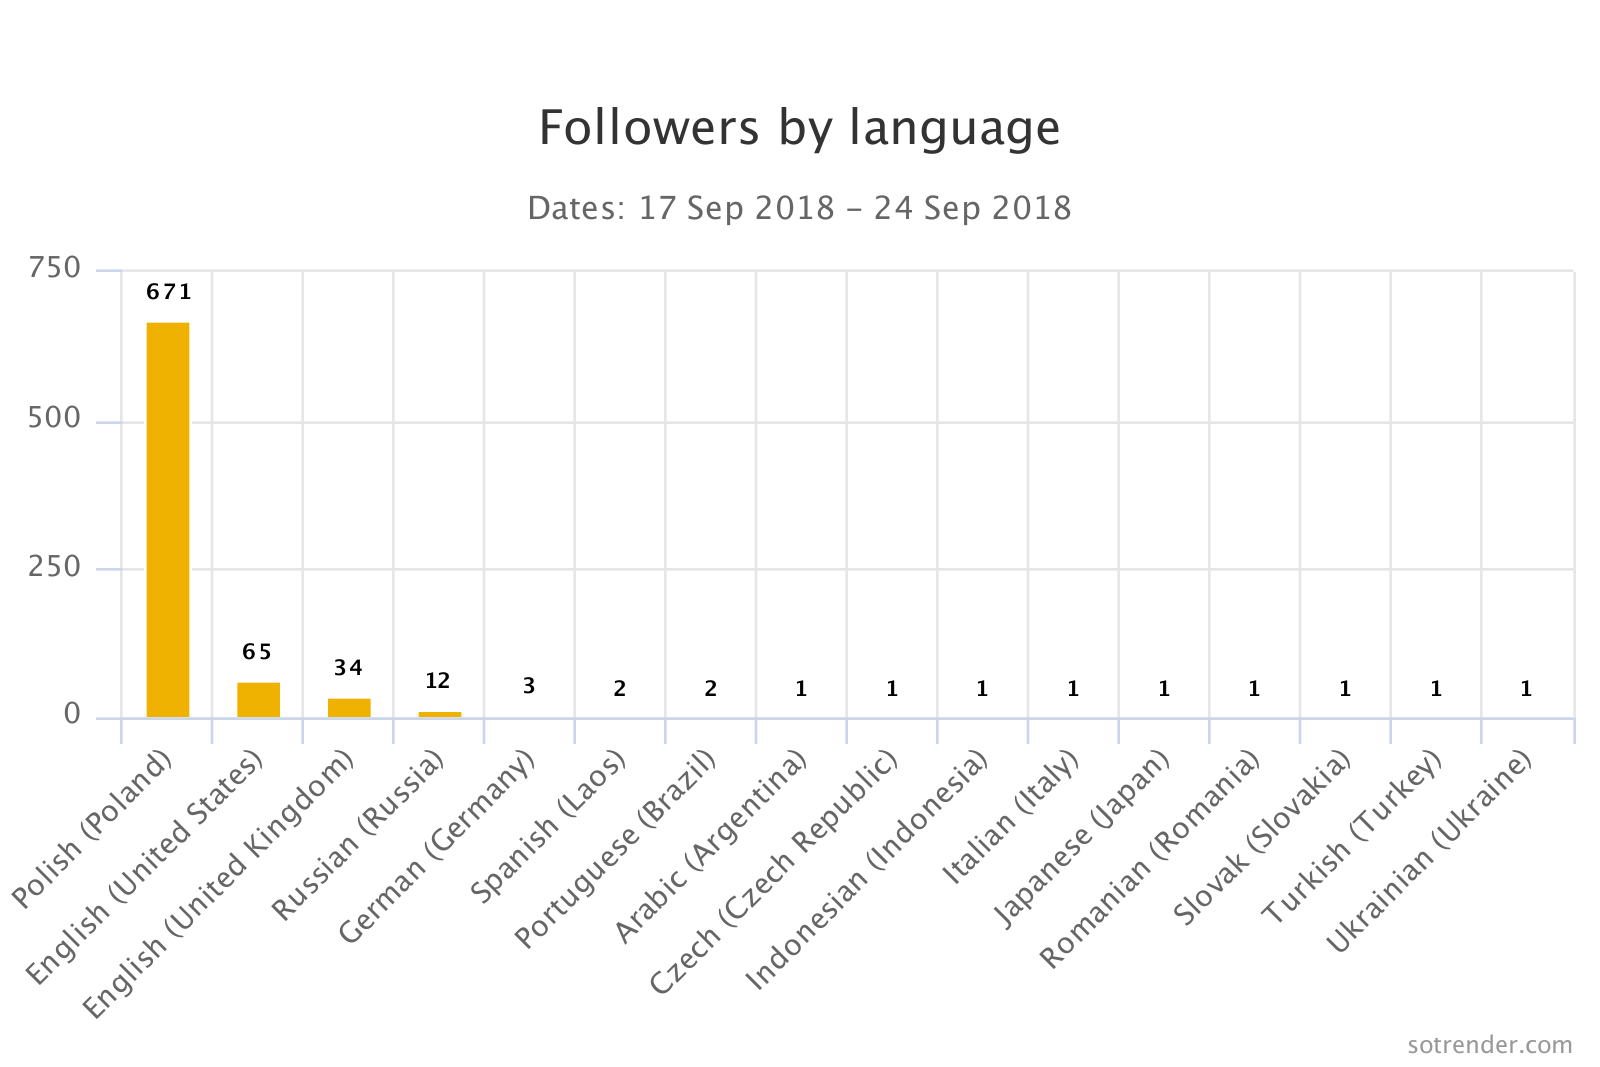
Followers by language
- Observe how your number of followers changes for a given language. This chart is editable, so you can include and exclude just the preferred follower languages and see how this number changes over time.
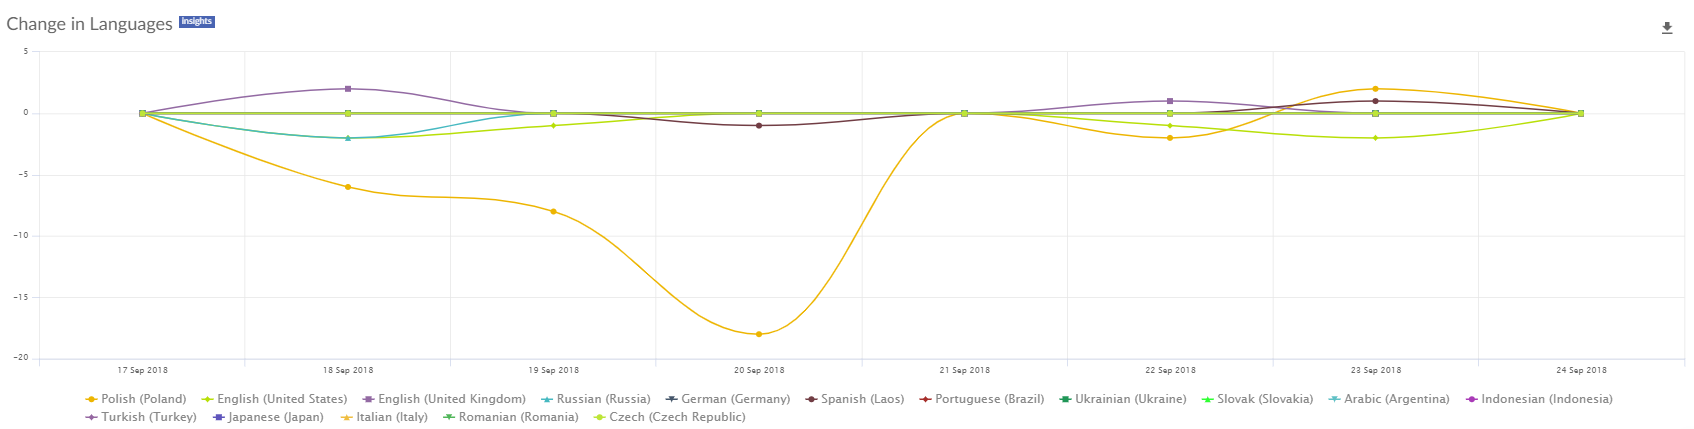
Change in languages
Follower demographics
Next, our new Instagram audience insights will provide you with detailed Follower demographics. Here again, you’ll find two beautiful charts to:
- Understand which age and gender bracket your followers fall into.
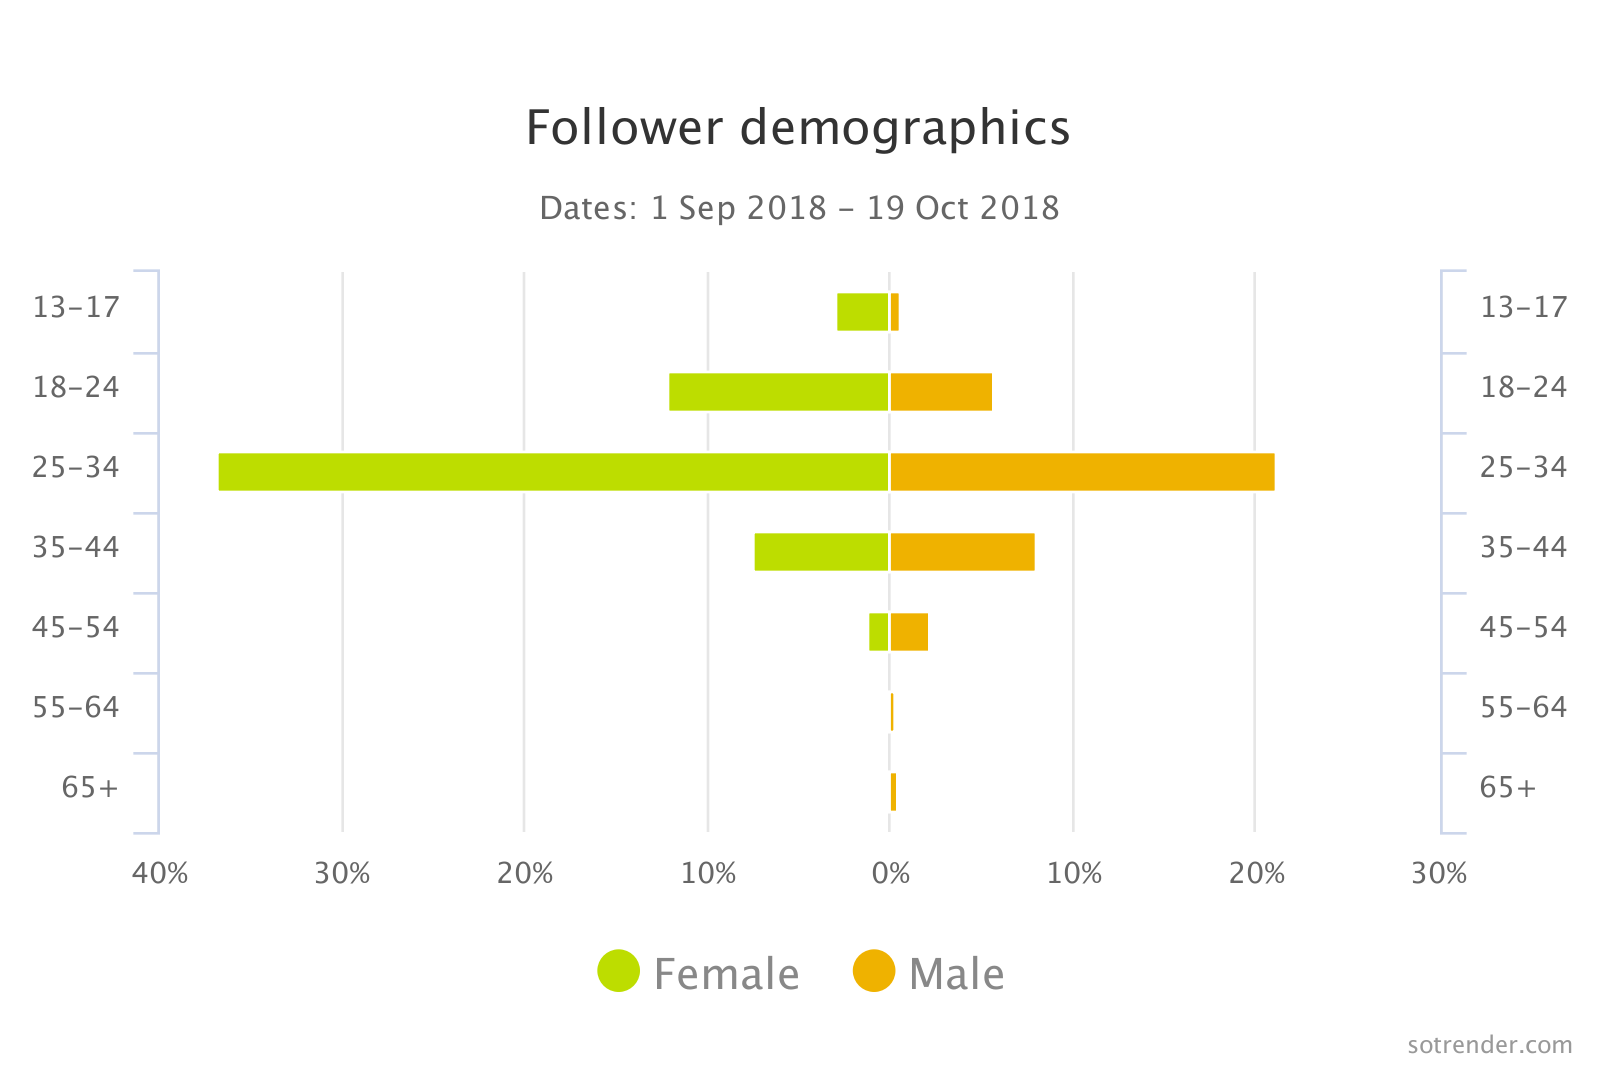
Follower demographics
- See how the volume of followers changes daily for each age category.
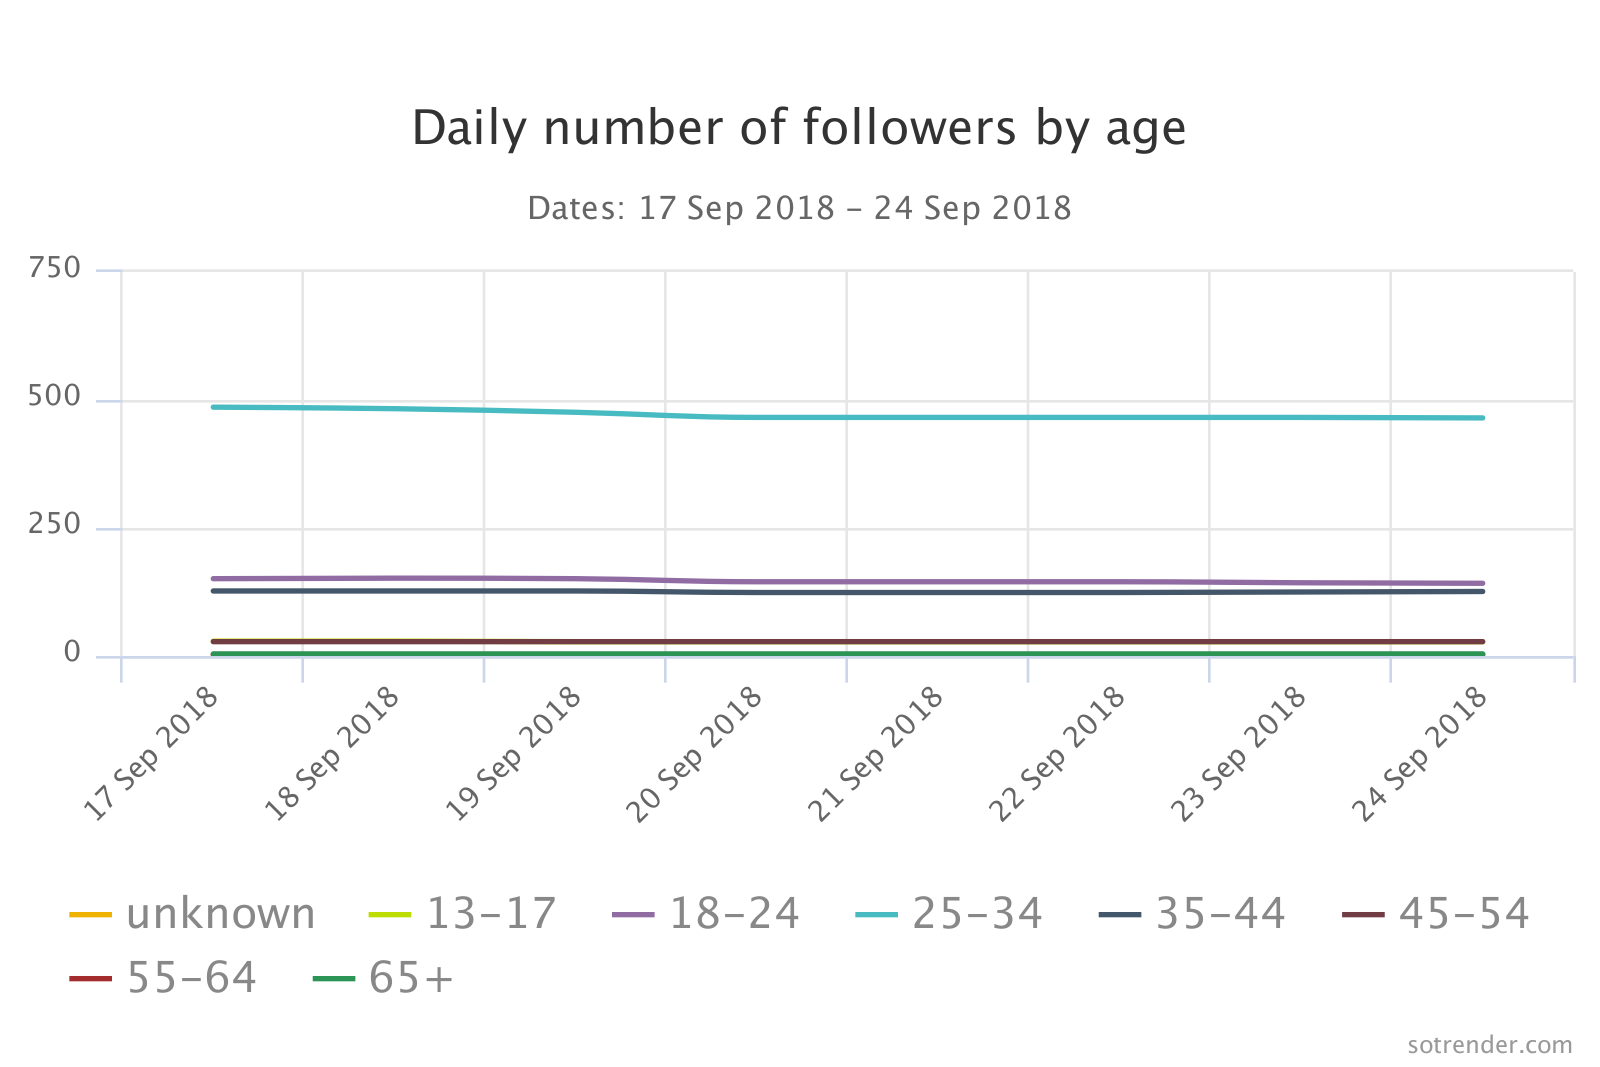
Daily number of followers by age
The goal of Sotrender’s audience analysis is to provide all the necessary information to allow you to track, evaluate and compare your follower base.
Use Sotrender’s audience analysis to decide:
- What (first or secondary) language to apply to your Instagram business profiles.
- Which countries and cities love you most and offer promising ground for targeted campaigns.
- When to add your posts and stories.
Timing is everything and countries have different time zones. That means you have to know the best posting hours and try to hit your followers’ sweet spot. - How to approach your social media content and what strategy to choose.
Oftentimes, a specific country defines customer expectations. So, if you really want to attract a specific localization, these charts will let you identify which social media trends to follow for any given location.
Instagram Reach and Engagement Analysis
This part takes you to the world of Instagram Reach and Engagement. Here you’ll find all the important metrics to give you a clear picture of your business profile activities.
And so, Sotrender will show you:
- Brand Activities
- Online followers by hours
- Reach
- Impressions
- User Activities
- Activity index
- Profile views
- Profile clicks
- Engagement rate
Brand Activities
Brand activities summarize what happened on a profile over a given period of time. That’s specifically useful when your Instagram business profile is managed by a social media agency and you need a detailed report to know if they are actually keeping the profile active and what’s the frequency of posts and what exactly they do.
Set a time range and see all the activities of your brand, such as posts, Stories, and comments shared day by day.
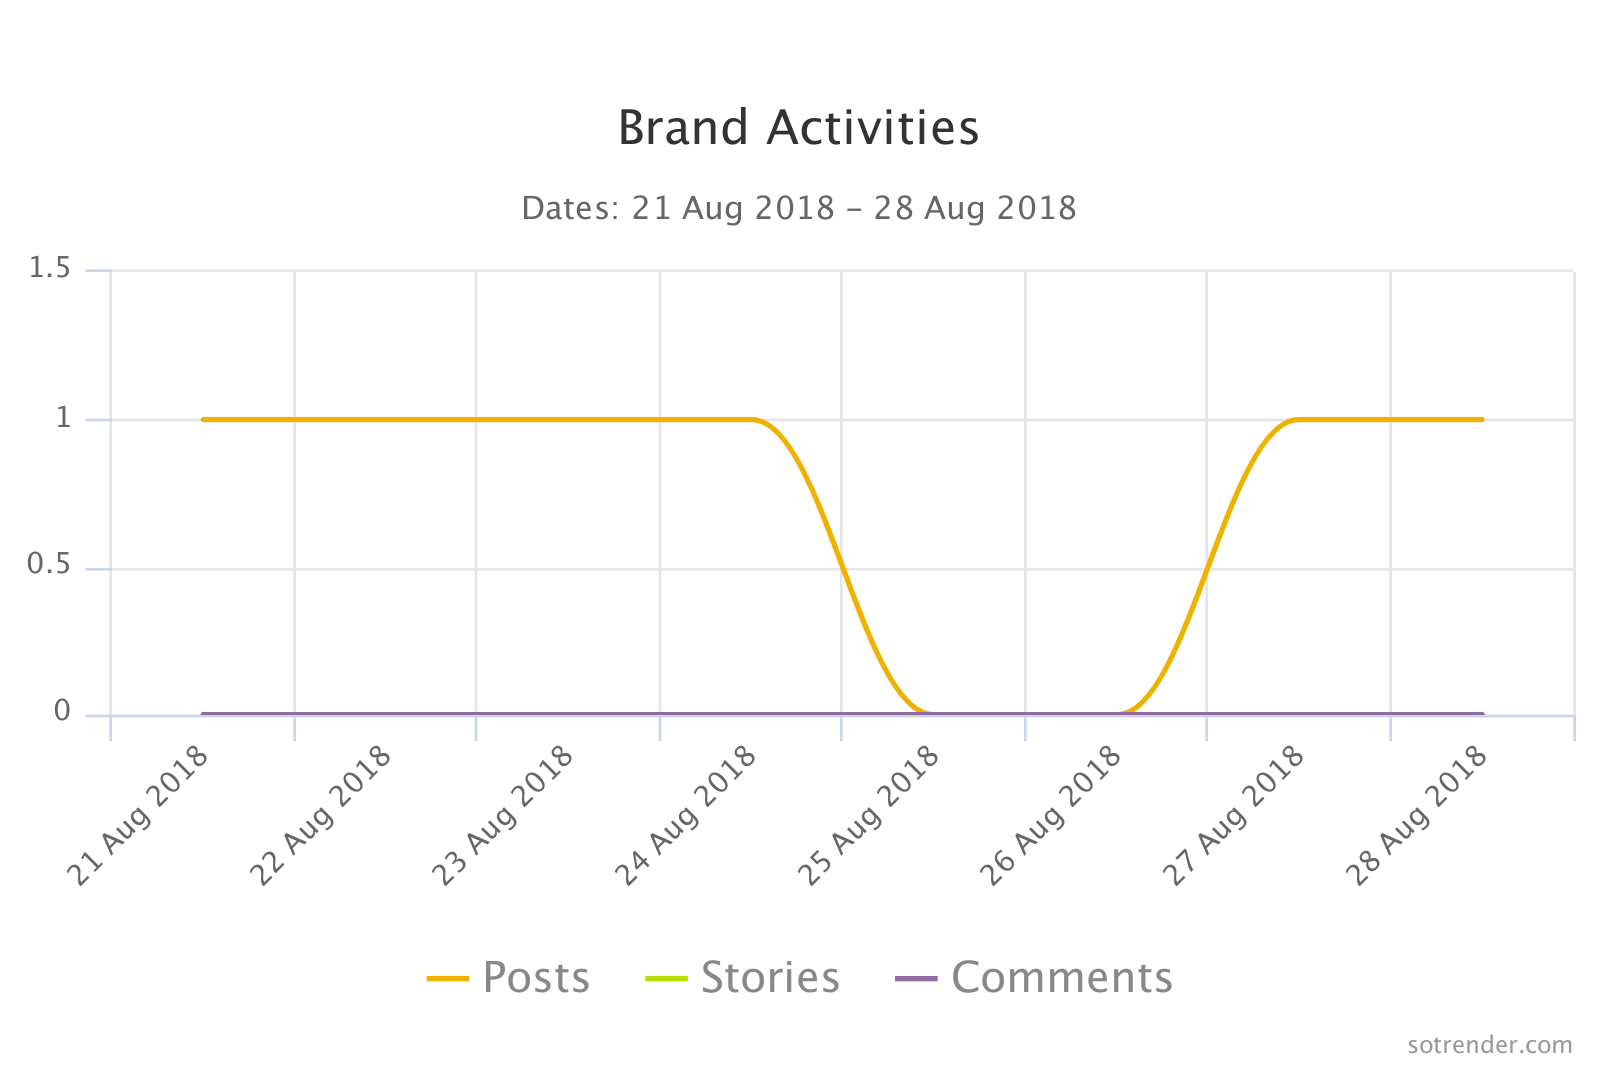
Brand Activities
Review your number of brand activities from Monday to Sunday with ease. Then relate them to other measures to see what affects your progress or depends on another event.

Brand Activities – Days of the week
These graphs are clickable, so you can decide whether you want to keep or exclude a type of brand activity.
Online followers by hours
This part keeps you aware of when your followers go online; what’s the average and what’s your best hour in terms of online followers. Use this dataset to decide what’s the best time to post on your Instagram profile to yield the best reach and engagement.
Sotrender applies online followers data to two charts, a bar graph, and heatmap, to better illustrate your stats and make them easy to understand.
While a bar graph highlights the sum of your online followers per hour…
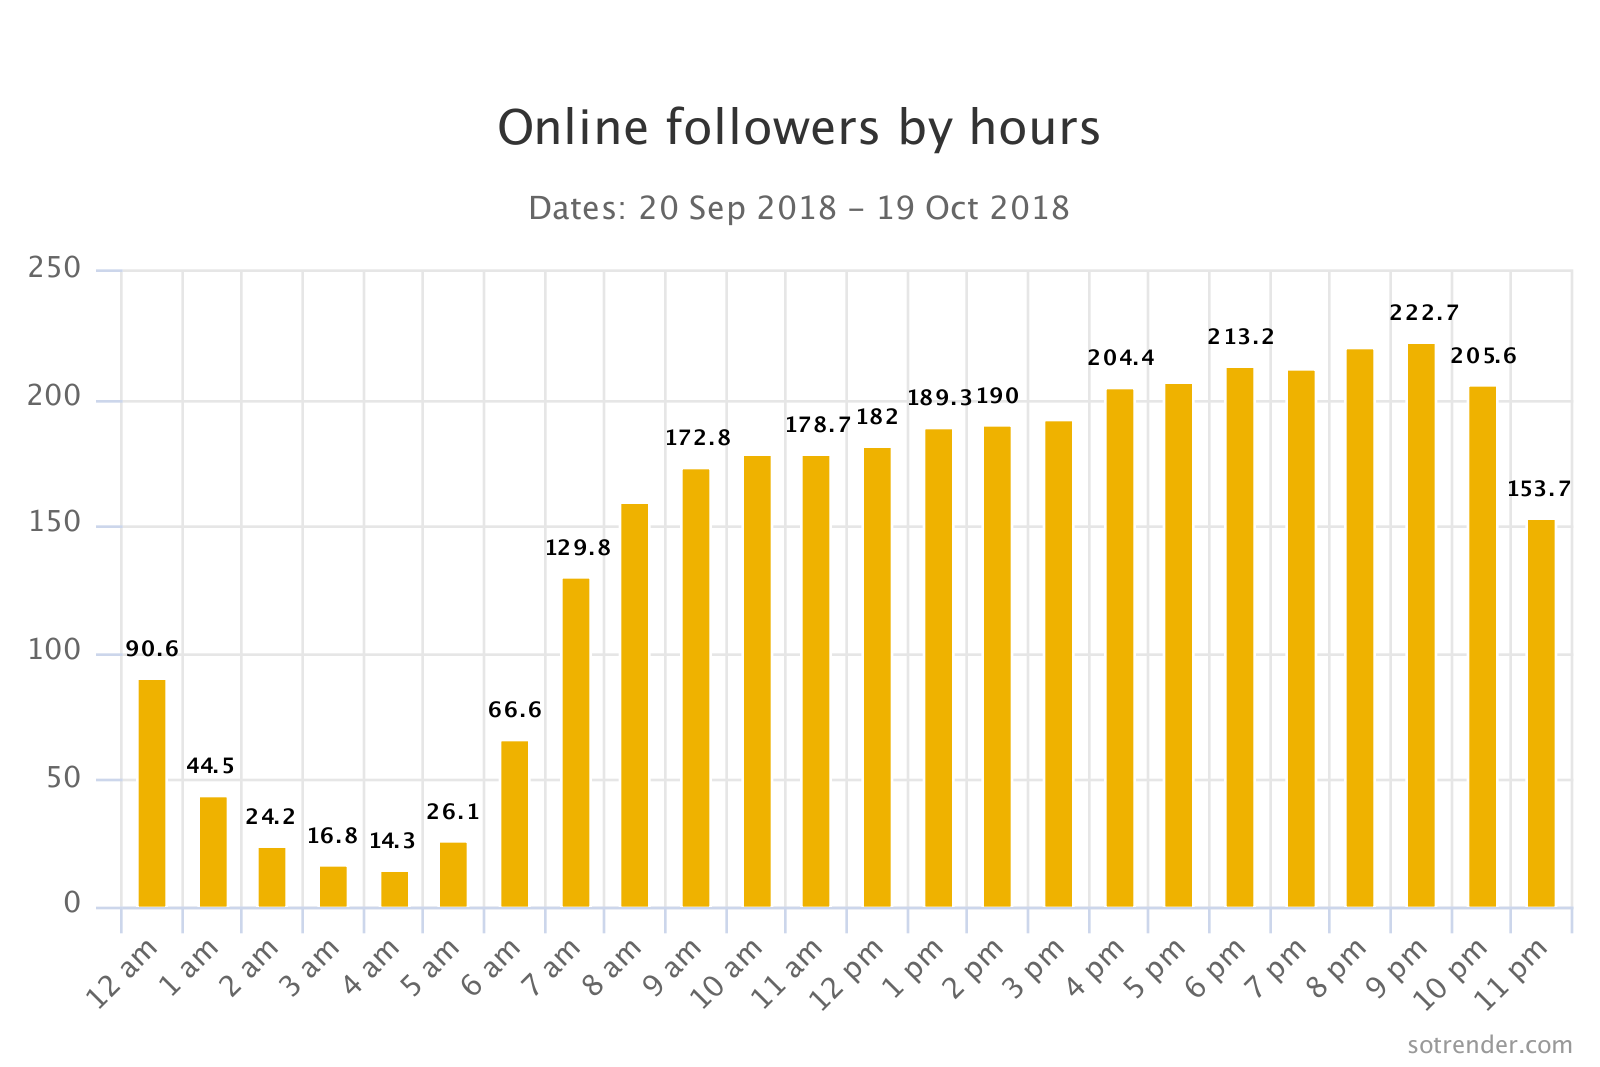
Online followers at Sotrender
…a heatmap adds some yellow-orange saturation to move your imagination and make these numbers more visually communicative.
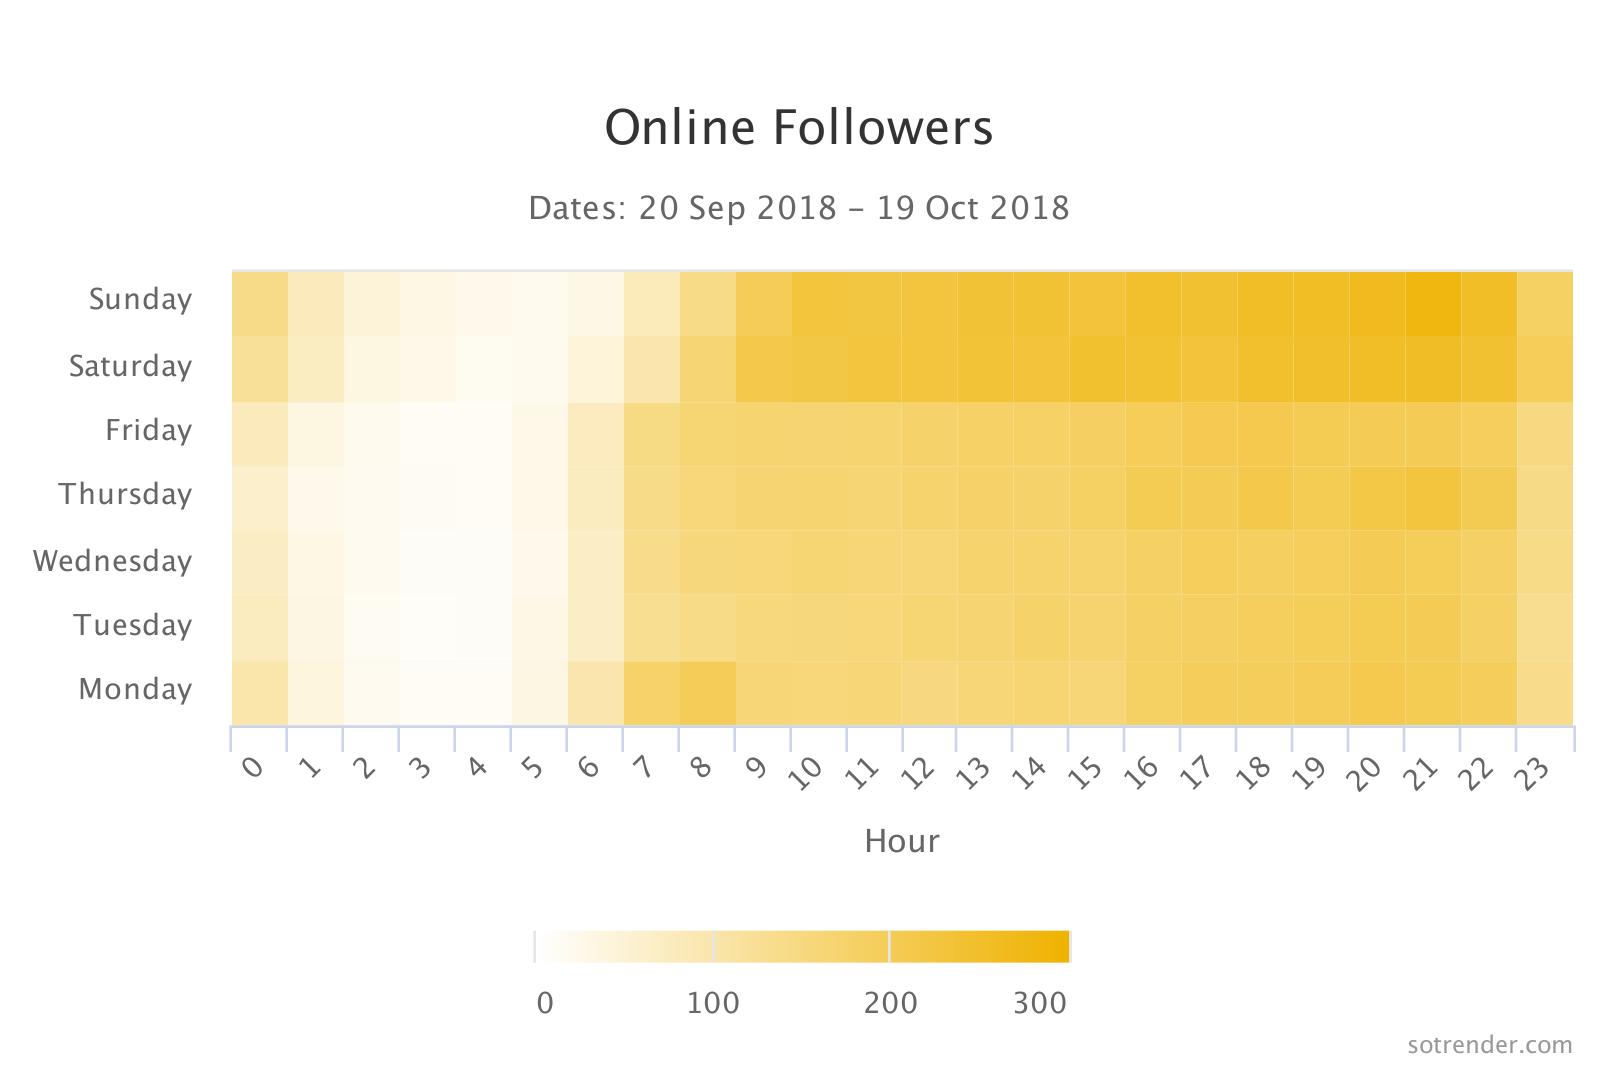
Online followers presented on a heat map
Instagram Reach
This part will tell you all about your Instagram reach data. Let’s remember that reach shows you how many unique followers see your content every day. (If someone sees your post multiple times they are only counted once.) Improving reach of your profile has a strong impact on your brand awareness.
Now Sotrender shows you:
- Your daily and average reach over the given time range
The average gives you a benchmark for the general performance of your Instagram profile. Knowing your average reach helps you evaluate how well individual posts perform if they are above or below the average.
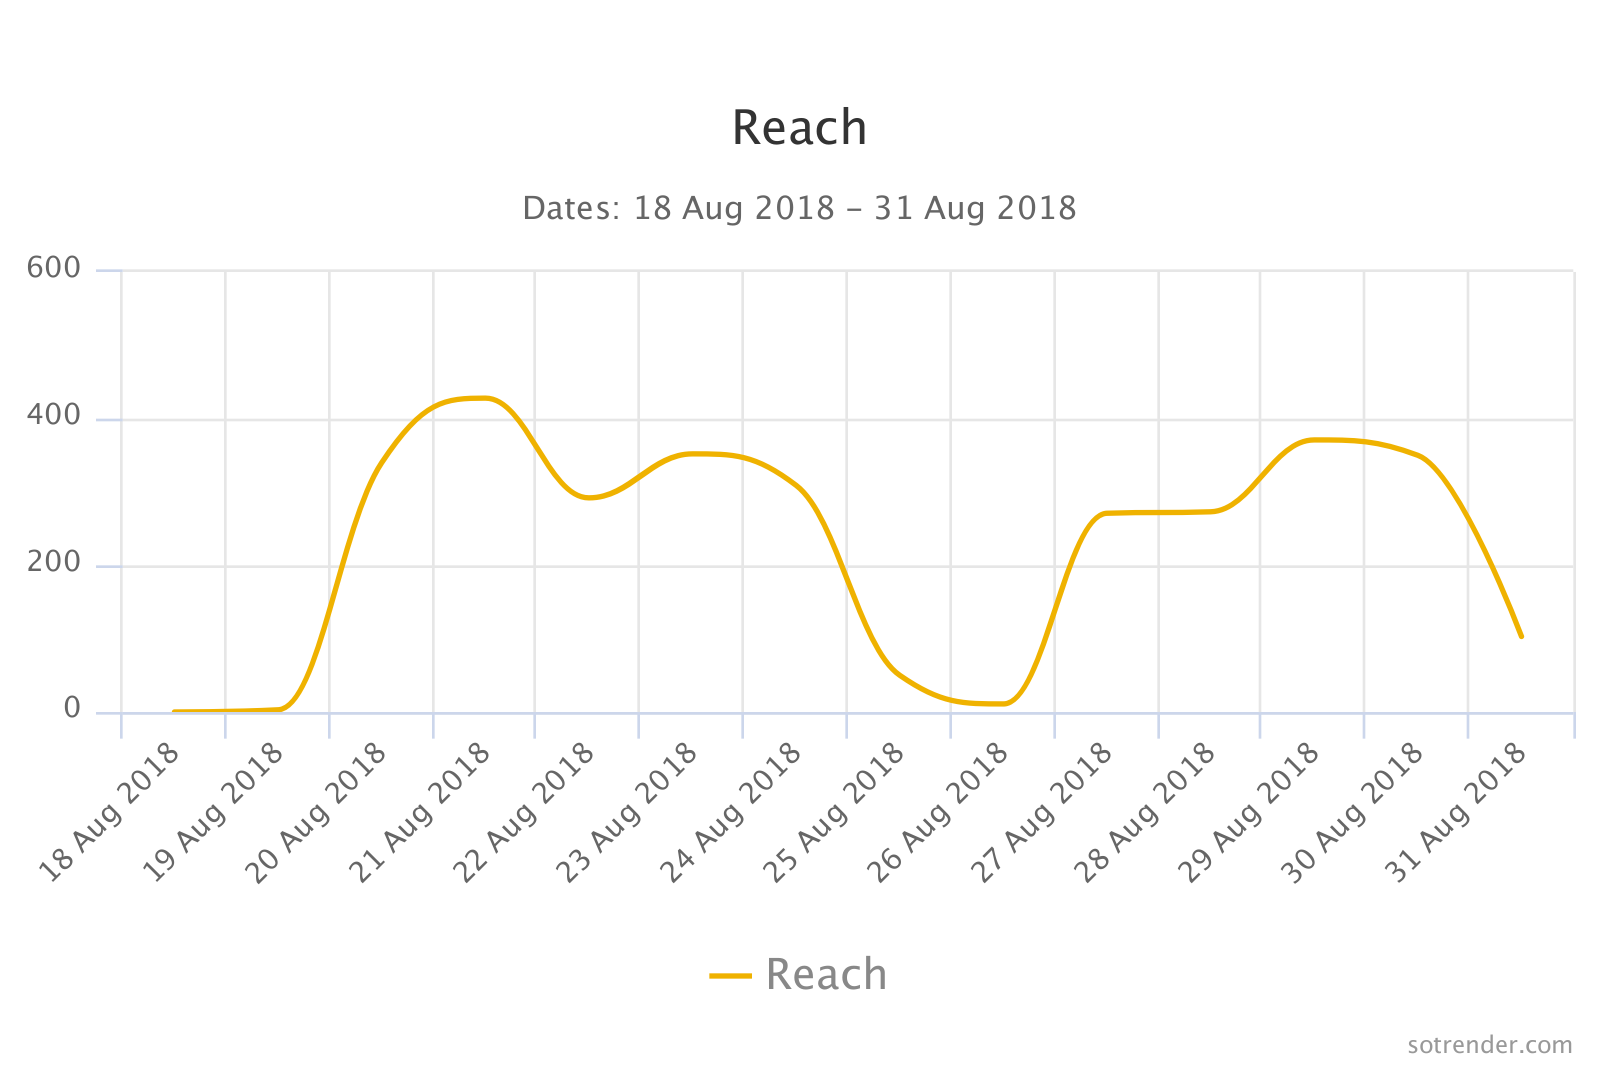
Reach
- Your reach breakdown by weekdays
By ranking your weekdays by the number of impressions, reach, engagement, or views they received, you can discover your top-performing posts and be able to repeat the success.
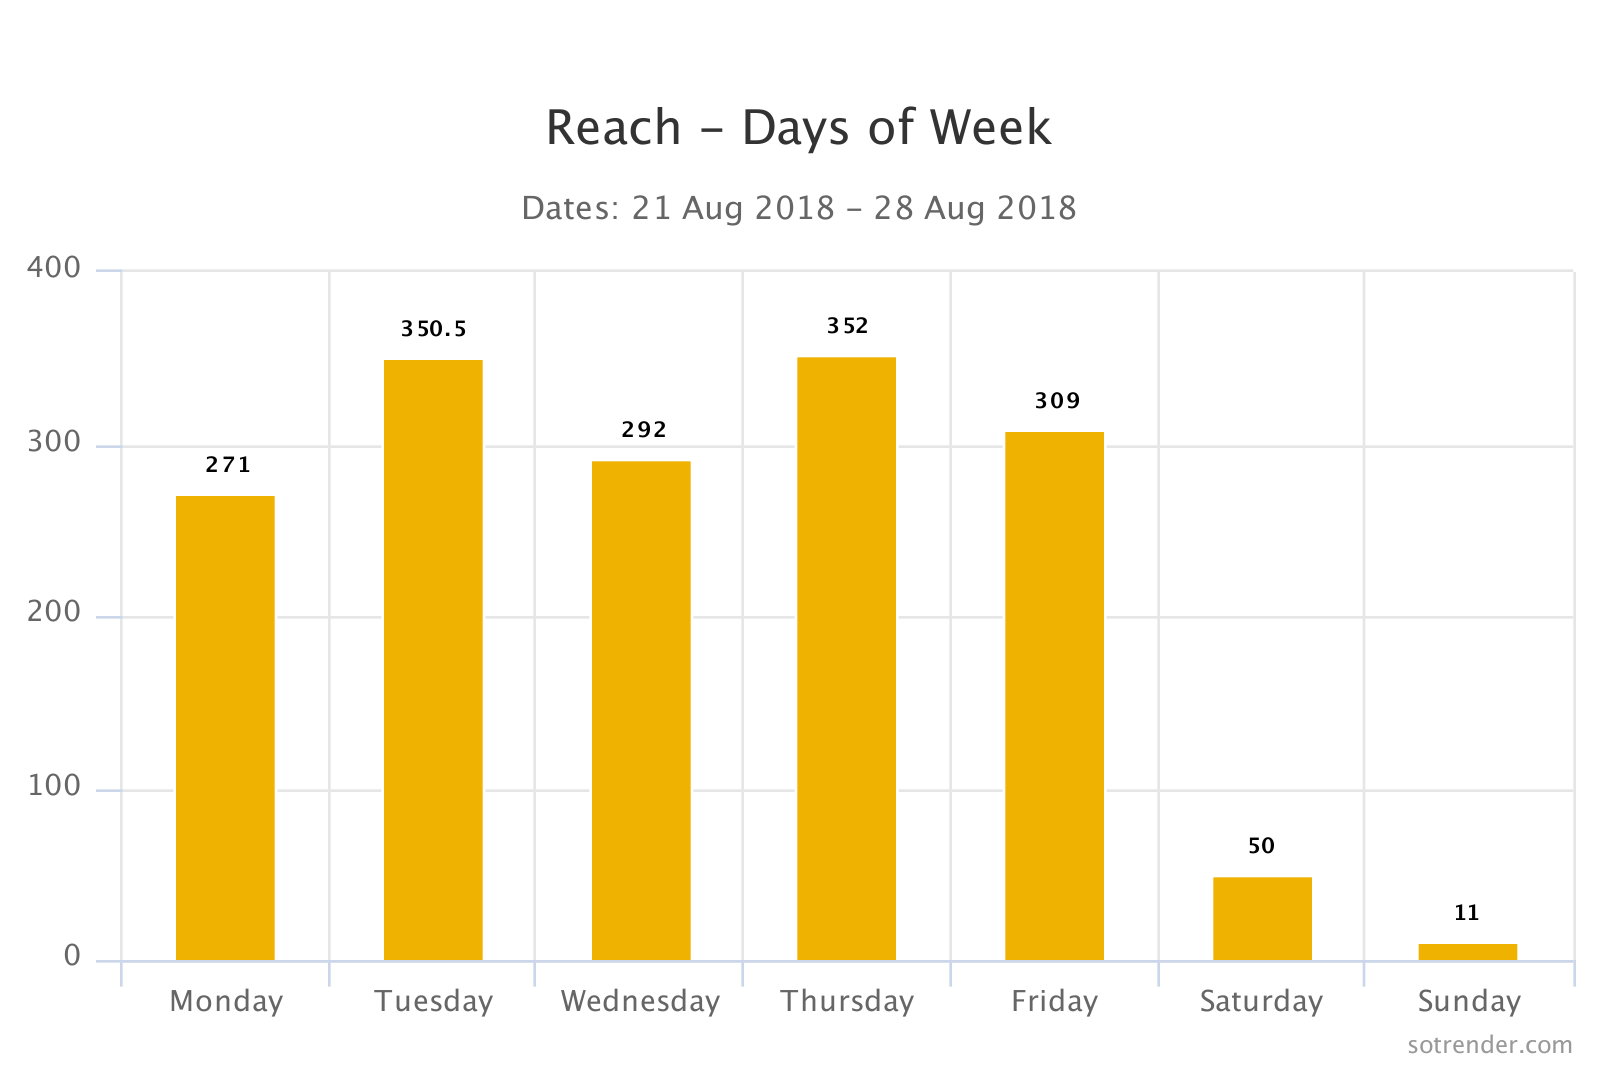
Reach – days of week
Instagram Impressions
Impressions, what’s that? Let’s define it and learn to distinguish this measure from the previous one.
Impressions tell you the total number of times your content, whether a post or a Story, has been seen by your followers. When one user sees your posts multiple times then it will be counted extra and applied to this total.
Now, you can do a few things to learn about your Instagram impressions:
- You can see the total number of impressions per day.
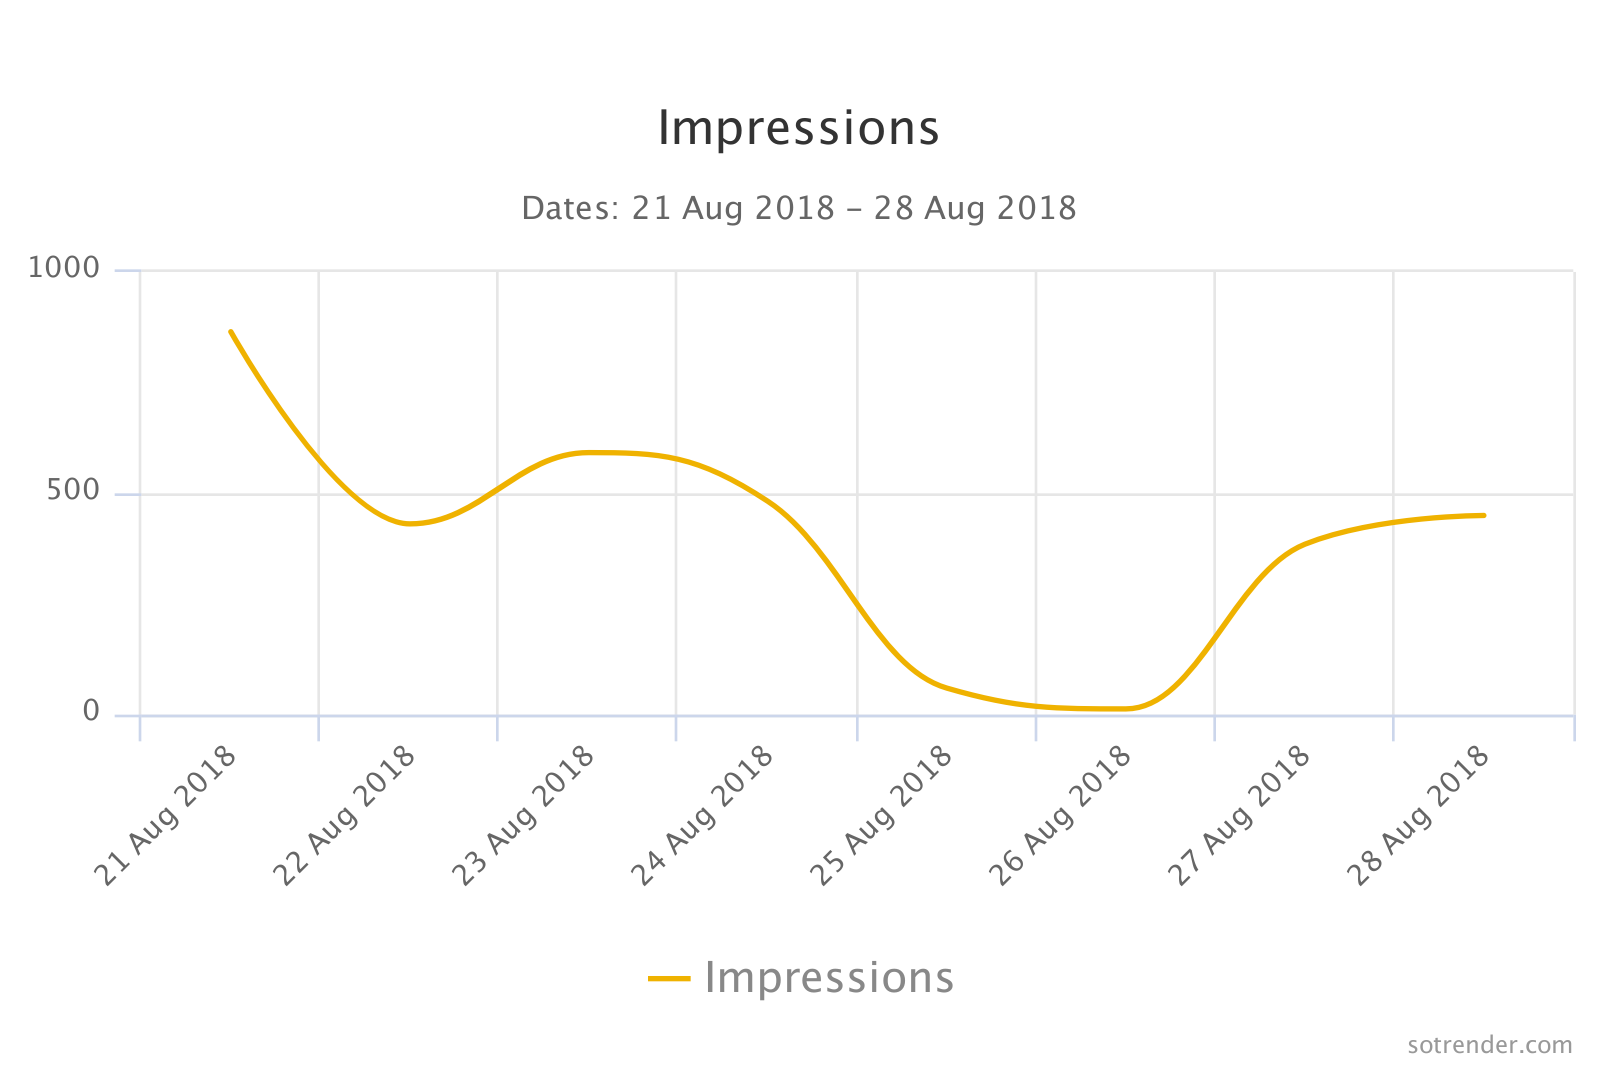
Impressions
- You can view the total number of impressions for a weekday.
By ranking your weekdays by the number of impressions, reach, engagement, or views they received, you can discover your top-performing posts and be able to repeat the success.
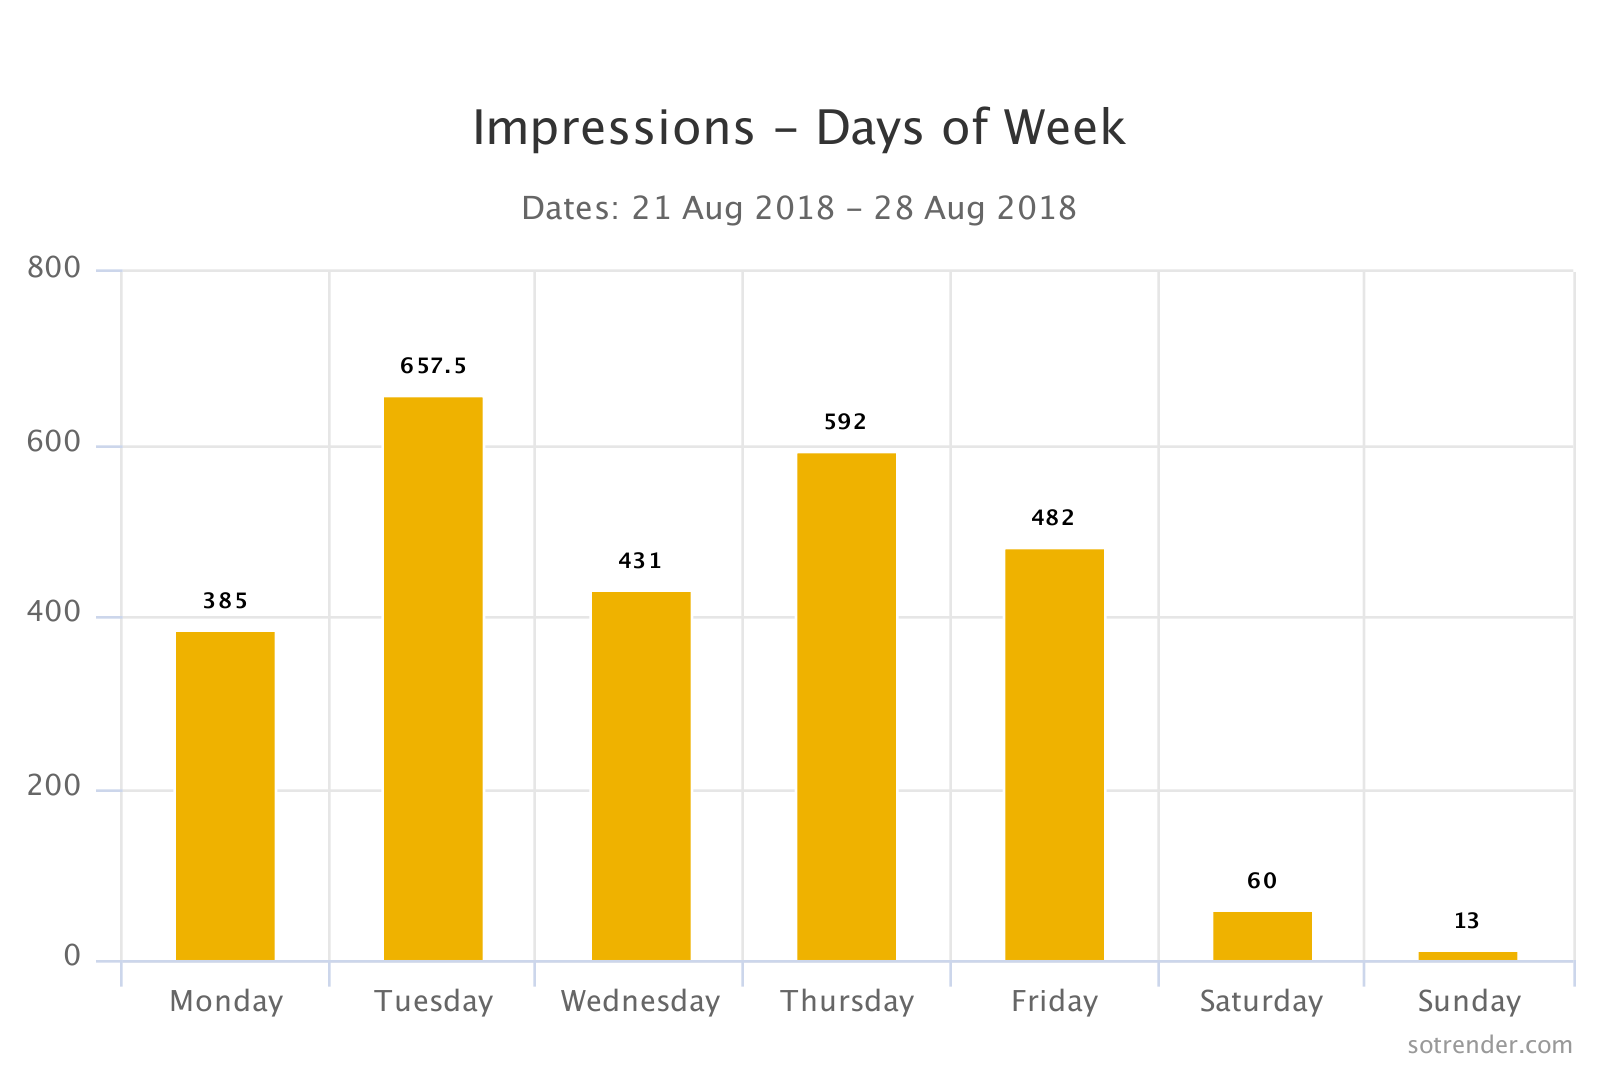
Impressions – days of the week
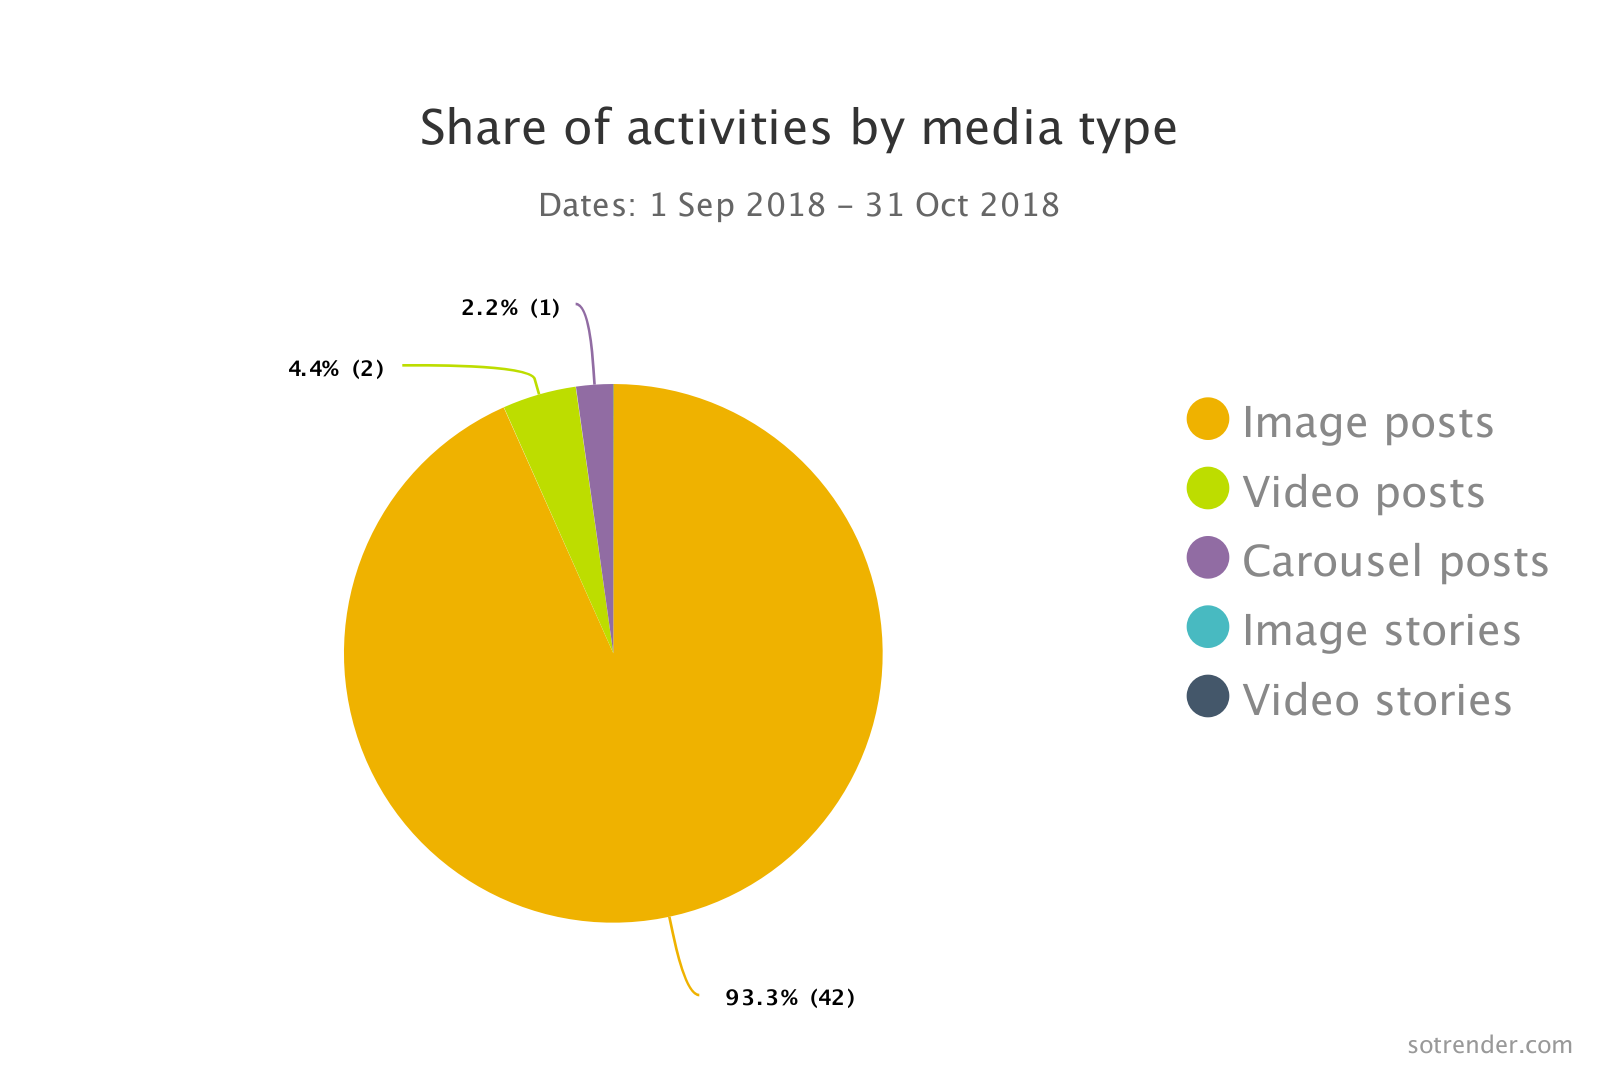
- You can evaluate the total share of impressions by media type.
This chart shows you what media type attracts the most attention. This way you learn what your audience enjoys most and it clearly indicates what media types you should be sharing in the future to hit the higher engagement.

Share of impressions by media type
- Assess your impressions by media type per day

Impressions by media type
Besides all that, you can review your content types (carousel, image, video, image, video stories) released over the given period of time and relate impressions to see your peaks and drops.
All these graphs and measures offer a microscopic look at your Instagram impressions and compare them for maximum insights.
We strongly believe that this dataset will satisfy the most demanding social media gurus out there looking for an advanced, yet simple and easy-to-understand investigation of their profiles.
This part gives you an overall perspective on the volume of people you reach with what you share on your profile.
Use Impressions to:
- See what content pieces drive your followers most, so they keep coming back and displaying these later.
- Identify why some Instagram posts indicate more Impressions than others and use more of these to grow your profile.
And remember: If your impressions are higher than your reach, it means that your followers are viewing your posts multiple times. Search for content with a high impressions-to-reach ratio for an indicator of what’s performing well.
User activities
Next on to your Instagram follower activities. It was created with the idea to show you if and how your fans react to posts and stories you share.
Without mincing words, let’s directly jump into what you can do with Sotrender:
- Reveal the total number of user activities per day.

User Activities
- Visualize the volume of user activities by type.
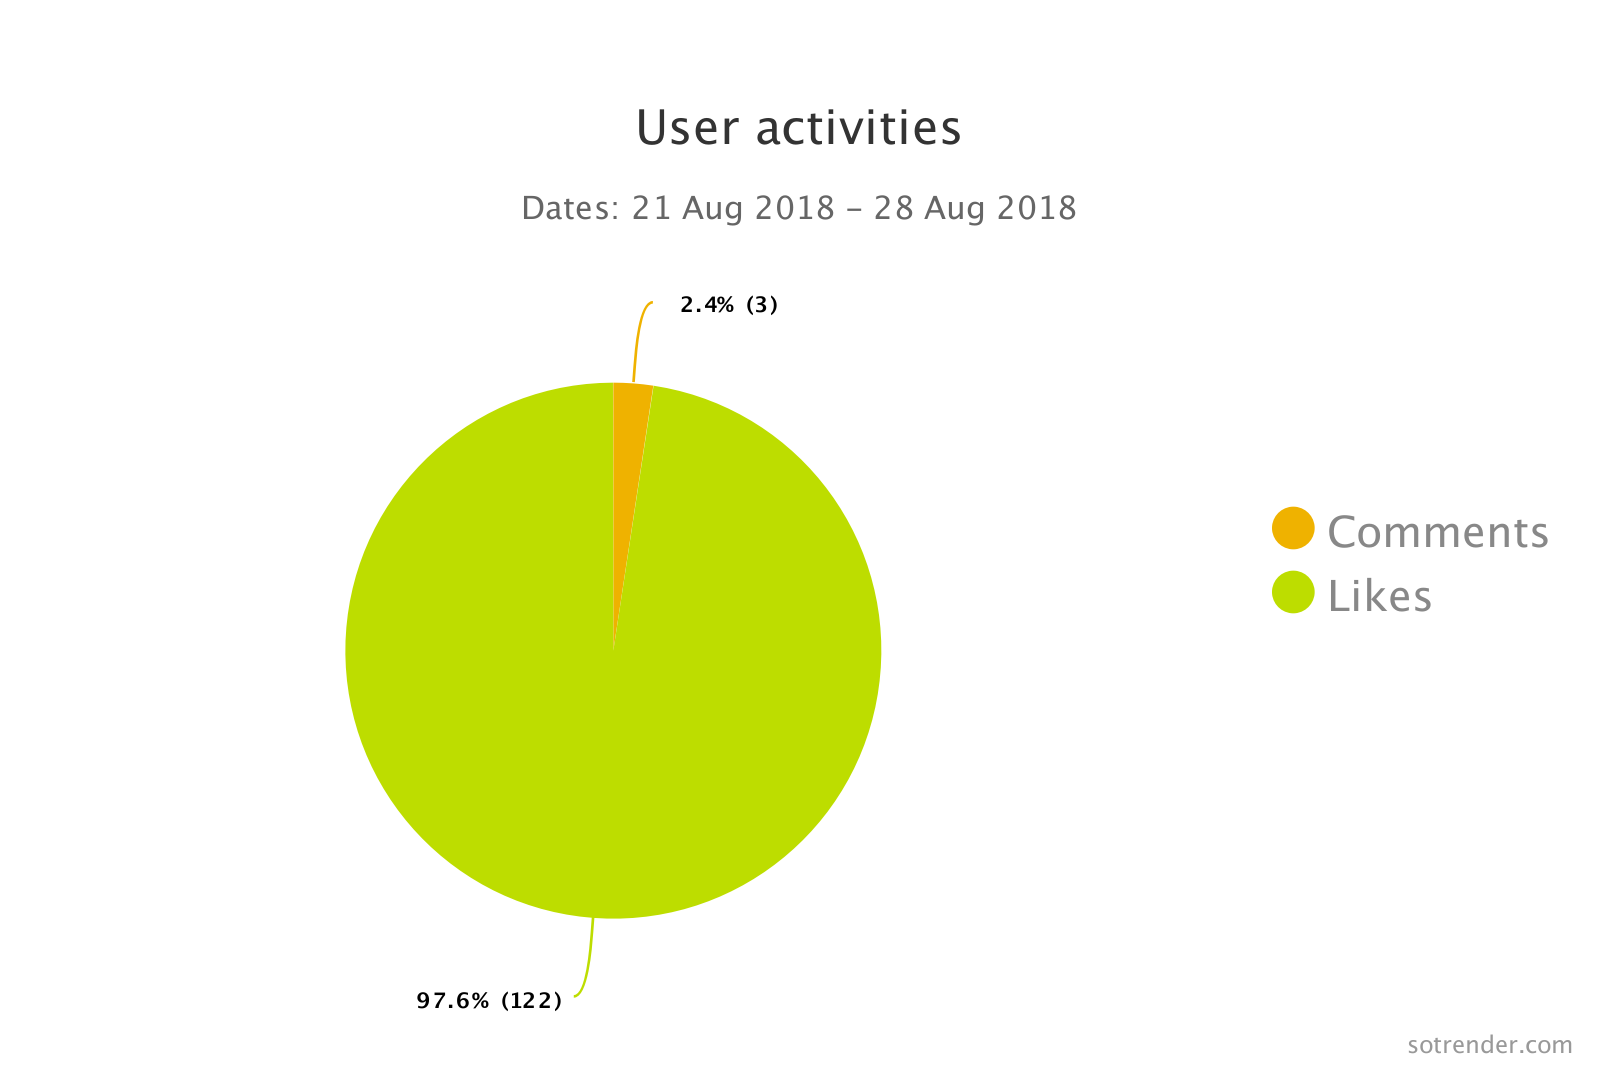
User activities
Share of activities by media type
- Break down user activities to specific weekdays.
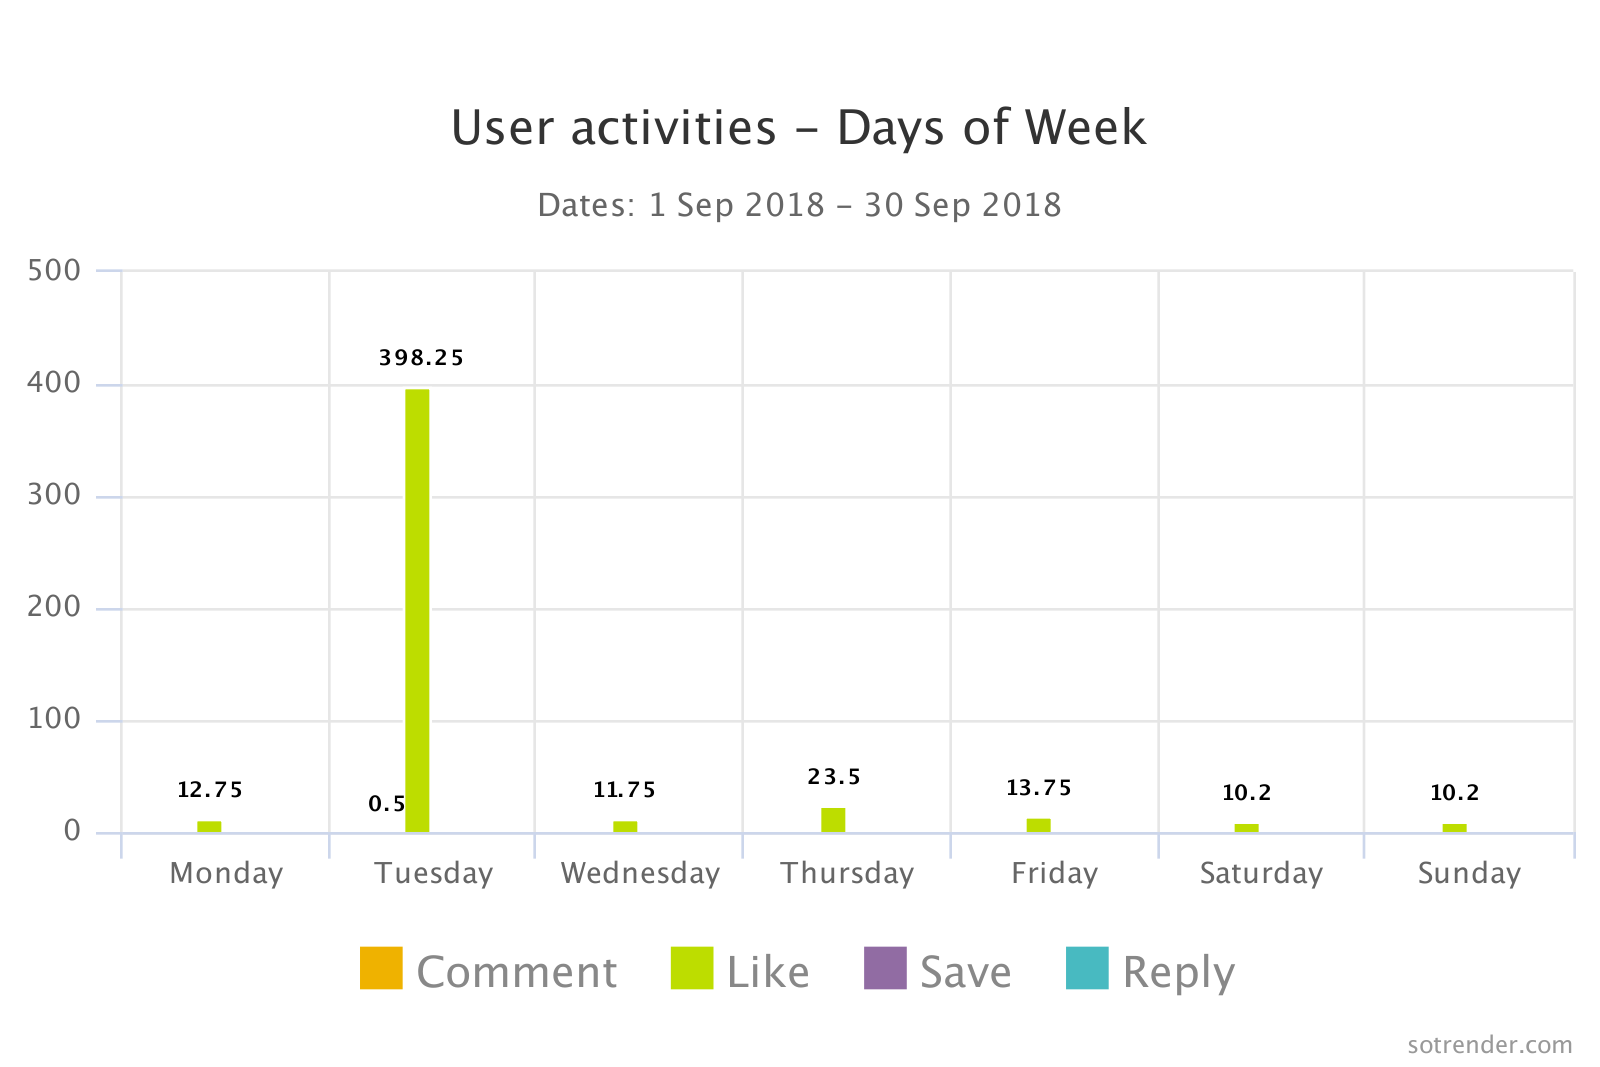
User activities – days of week
- Present user activities by media type.
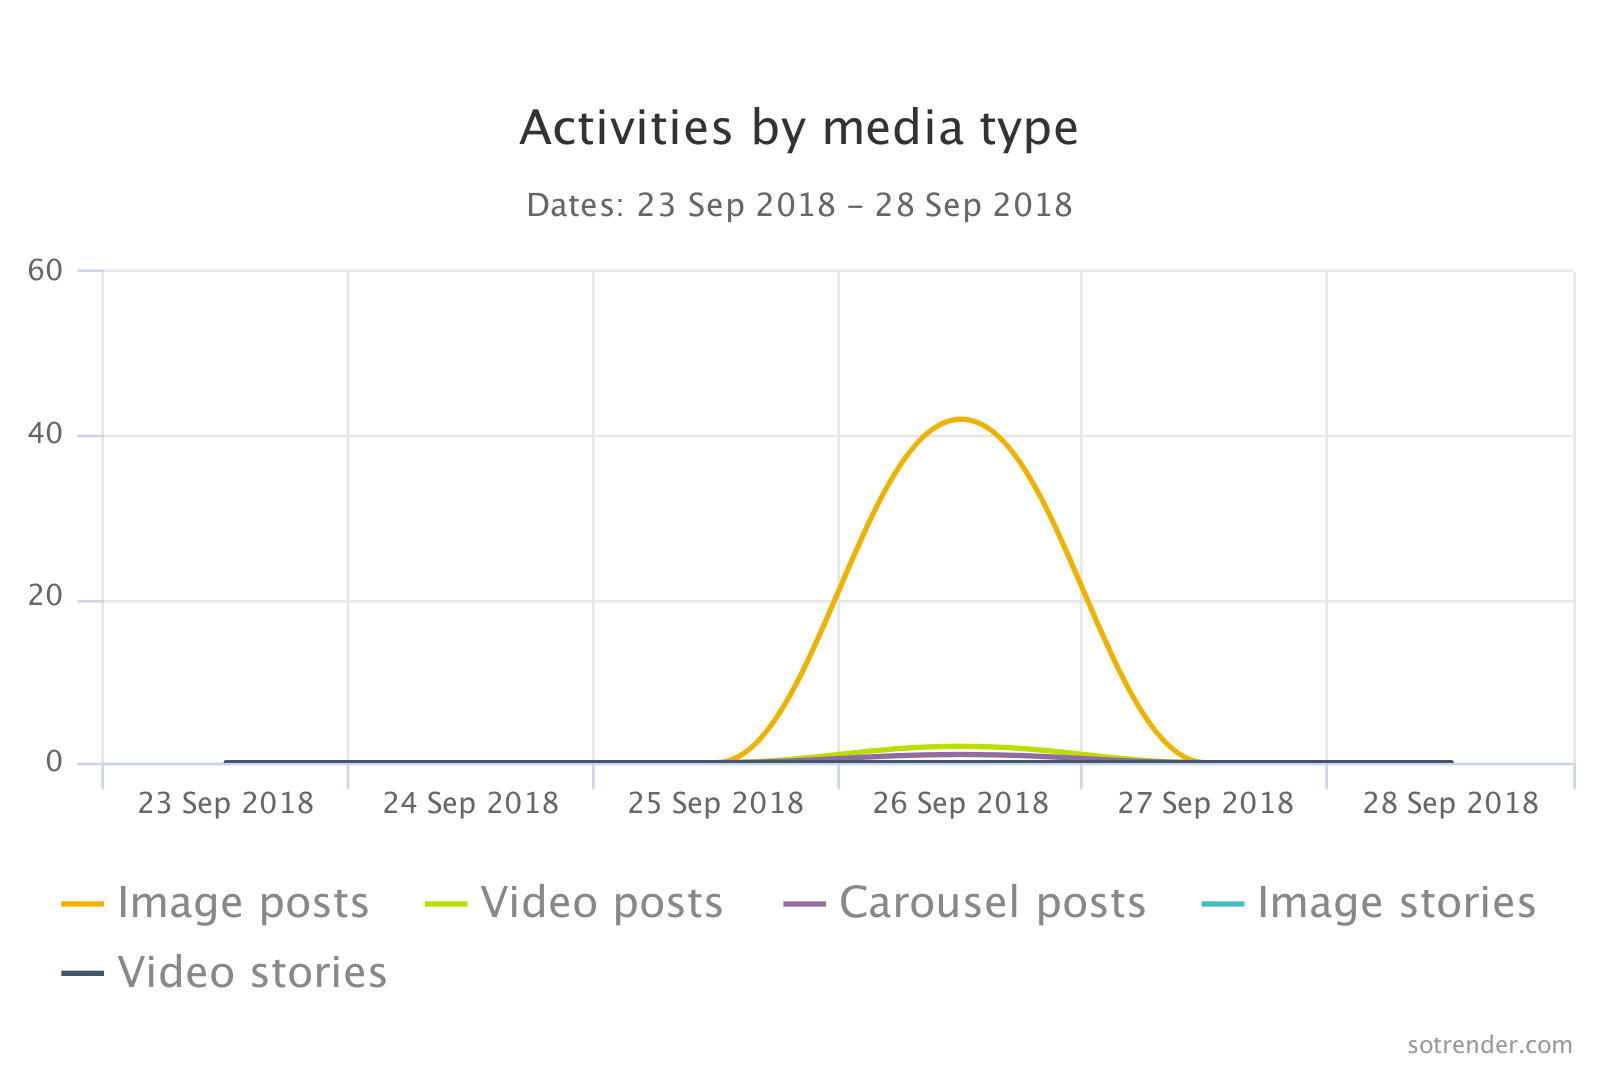
Activities by media type
These stats will give you a clean perspective on user reactions to content pieces so that you can easily note down your favorites.
Use user activities to establish which parts of your content strategy resonate with your fans best and what direction to follow to optimize your performance.
Activity Index
The next measure created to help you better analyze your Instagram data is the Activity Index that evaluates the overall user activity of your Instagram business profile.
Our Activity Index lets you see the total engagement of your profile day by day and on specific weekdays. This lets you compare and contrast the total engagement of your profile and relate it to the rest of the data.
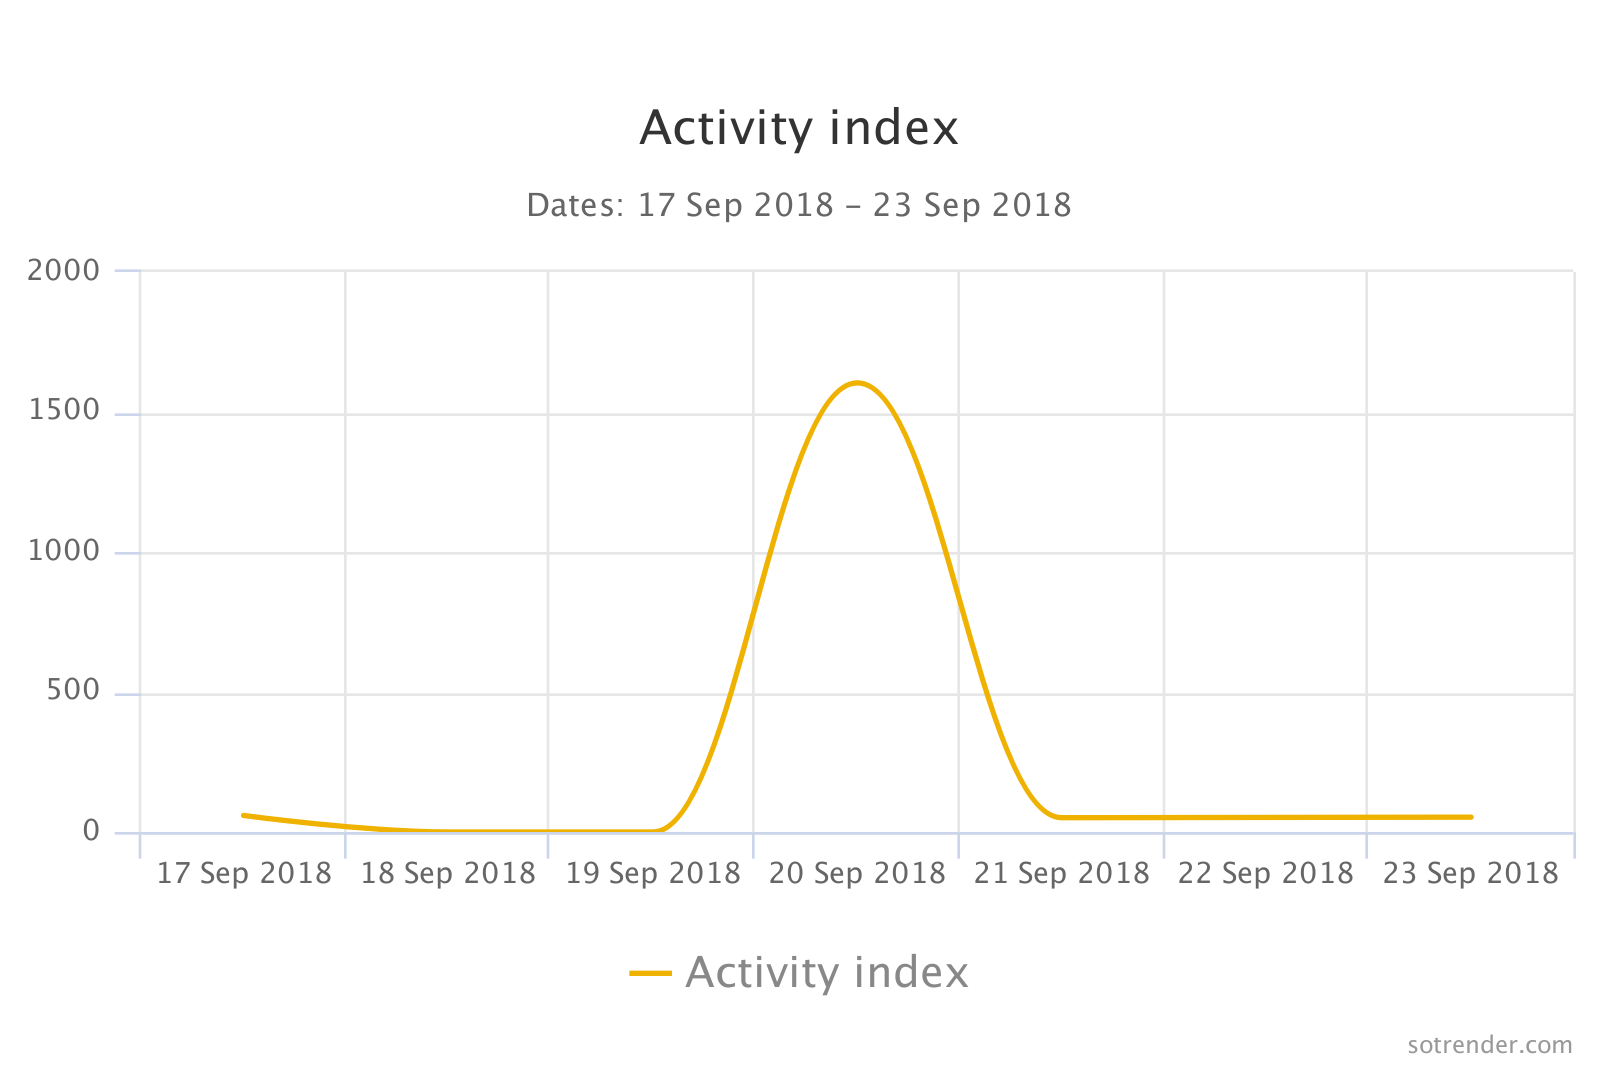
Activity Index
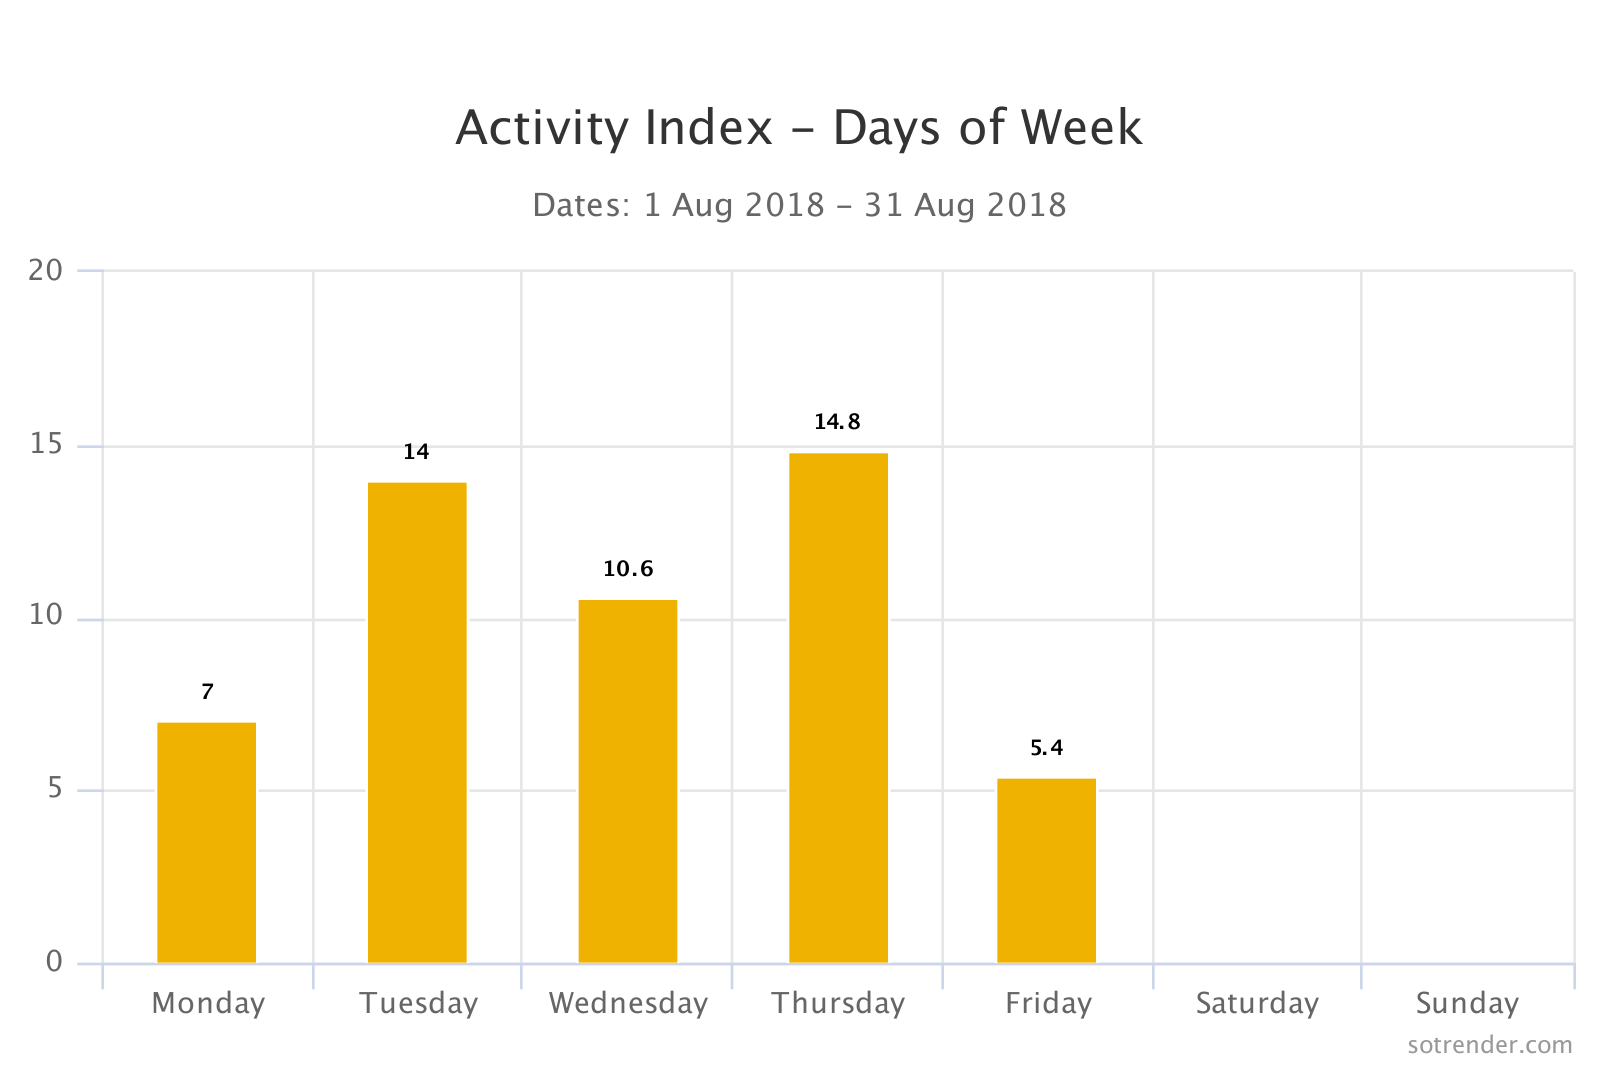
Activity Index – days of the week
Profile Views
Profile views come in handy if you are running campaigns trying to acquire new followers. Basically, when your profile views don’t turn in the growth of your follower base, then probably Instagrammers don’t like your profile enough to follow it. Also, in case you have very low profile views, it could mean you are engaging the wrong audience, or that your audience is ambivalent about your content.
Want to see how many views your Instagram profiles have? Now you can find out with Sotrender.
- See your profile views per day and categorized by weekdays.

Profile views

Profile views – days of the week
Use Sotrender’s reach and engagement analysis to decide:
- When your followers are on Instagram and adjust your brand activities here.
- What activities of your brand outperform others in terms of engagement and why. Then use more of them.
- When your profile gets most active. Then try to define patterns about its dynamics.
Finally, we finally arrived at the third and last big chapter that reflects something especially interesting for social media managers.
Instagram Content Analysis
This part will tell you everything about your Instagrammable content. 🙂
Top Posts
From the number of posts, post types (photo, carousel, video) you can look into each and every one of your posts and review the details about their social media performance.
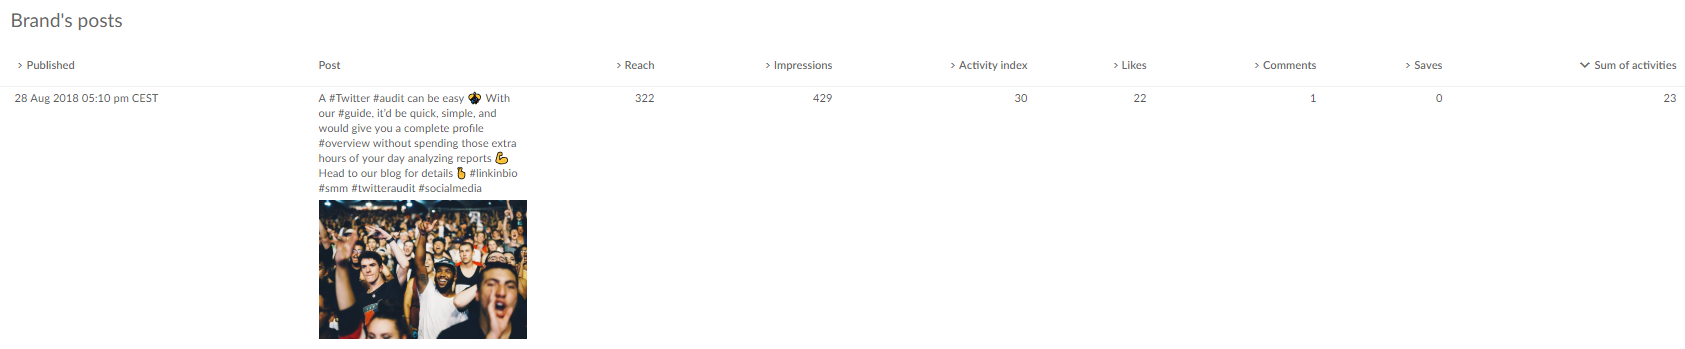
Top posts
Top Stories
And the same works for Instagram Stories. Sotrender’s new Instagram analysis demystifies your stories, so you can now review:
- How many stories you release per day.
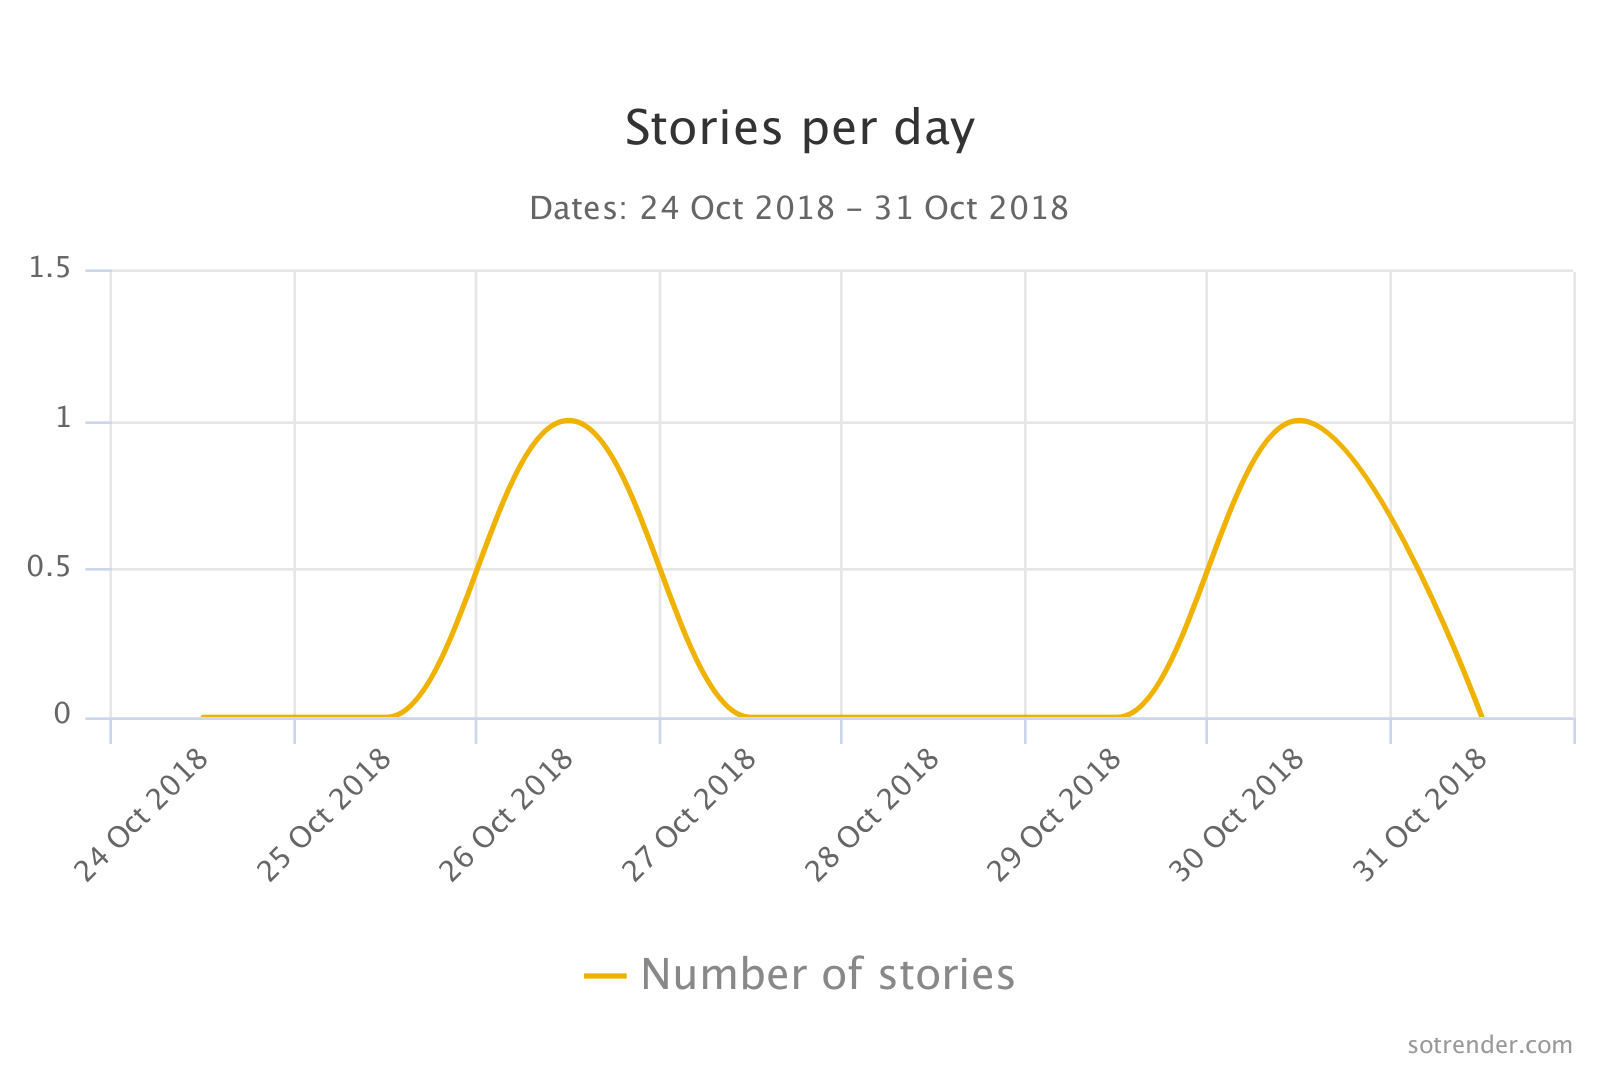
Stories per day
- The total sum of your stories over any given period of time.
- Your best day within the given period of time in terms of quantity of stories.
Filter your stories by pictures and videos to look at them closer and relate metrics such as reach, impressions, replies, exits, taps forward, tap-backs to every story.
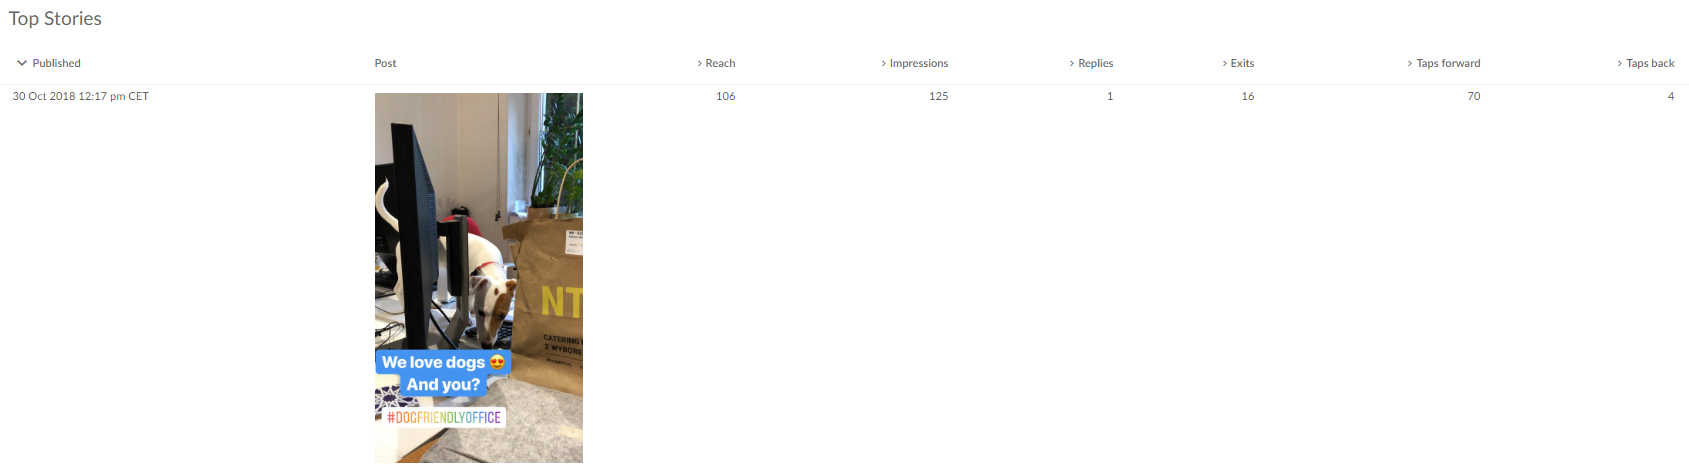
Top Stories
Just in case you need further explanation:
- A reply is when someone sees your story and sends you a direct message from it.
- An exit is when someone closes your stories with the x button in the upper right corner of the screen.
- A tap-forward is when someone clicks the right arrow on the screen.
- A tap-back is when someone clicks the left arrow on the screen.
And under these two sections, you’ll find the top posts ranking. This ranking includes the best content you shared divided into posts and stories over any given period of time.
Use Sotrender’s content analysis to:
- Review what went fine and what went wrong worse than expected.
- Draw conclusions and alter your future Instagram content ideas.
- Keep the lights on your content to give it a regular check.
Comparative reports
That’s not all there is to Instagram Business Analysis. To take your analysis to the next level, you have to do some benchmarking. The Sotrender analytics team can create a comparative report that will benchmark your and your competitors’ activities on Instagram. You’ll get to know the market better and you’ll understand what you and your competition’s audience want for the sake of optimizing your strategy.
Update: Instagram decided to hide the number of likes under users’ posts. Although the user who posted the content will be able to see the number of likes on their post, others cannot. Sotrender will still be able to gather data like impressions, reach, user activity, and engagement for your profile through other reactions. Just keep in mind that likes will not be counted in the comparison between you and your competitor.
Alright, that’s everything sorted.
Now let’s explain the most important thing of all:
How to Start Using Sotrender’s New Instagram Business Analysis
First things first.
Before you can actually jump on the awesome new Instagram features in Sotrender, you need to connect your Instagram Business Profile to let Sotrender’s robots start analyzing your feeds.
Let’s describe the process, step by step 🙂
Sotrender Users
First, make sure you have switched from a personal to a business profile. If you’re not sure how to do it (and whether if it’s worth it), we’ve already discussed it.
Then connect your profile to Sotrender in a few easy steps:
- Log in to Sotrender
- Click ‘Select profile’
- In the drop-out menu choose ‘Add a profile’
- Choose New Instagram
- You’ll be redirected to Facebook to authorize your profile (don’t worry, you’re granting access only to Instagram Business Profile data). If you’ve already done that, you’ll get a list of profiles connected to your account.
It can take a while until we’ll gather all the data for your profile. Once it’s done you’ll be informed in an email
Sotrender New Users
If you’re a new Sotrender user, then you need to sign up first and create your account.

Then connect all your social media profiles to Sotrender or just add your Instagram Business Profile.
Next, when your account is up and your Instagram Business profile is connected, Sotrender will start collecting your data. Then you can enjoy your social media stats beautifully presented on the versatile charts, graphs, and heat maps.
Everything is fully automated and meeting-ready. No more spending time on endless spreadsheets.
And that’s especially real because of unlimited, automated, and recurring reports that once set provide you with just the necessary social media metrics delivered at a preferred frequency right to your inbox.
We strongly believe that the New Sotrender’s Instagram Analytics will satisfy the most demanding social media gurus out there looking for an advanced, yet simple and easy-to-understand analysis of their profiles.
See for yourself and have fun with Sotrender!
PS: Do you have any questions about Instagram Business Analytics with Sotrender? Get in touch with us! Throw us a message at support@sotrender.com


