
Instagram, which is currently a leading social media channel for the majority of brands, is still holding back a lot of information from marketers. Unfortunately, the API changes in 2018 made it impossible to monitor competitors’ performance on Instagram.
We knew that the situation didn’t seem to be optimistic for a few months now. But here at Sotrender, we were working hard to make it possible again to monitor your competitors’ Instagram activities in a much more thorough way than just checking on the number of followers and number of likes under posts.
This is how we can proudly introduce you now to the comparative report for Instagram.
We believe it will help find answers to many questions you’ve asked yourself and looked for in the last weeks.
Our report starts with an overview of basic data for the analyzed time period:
- Number of followers
- Number of posts on each profile
- Number of comments on each profile
- The total number of likes under posts
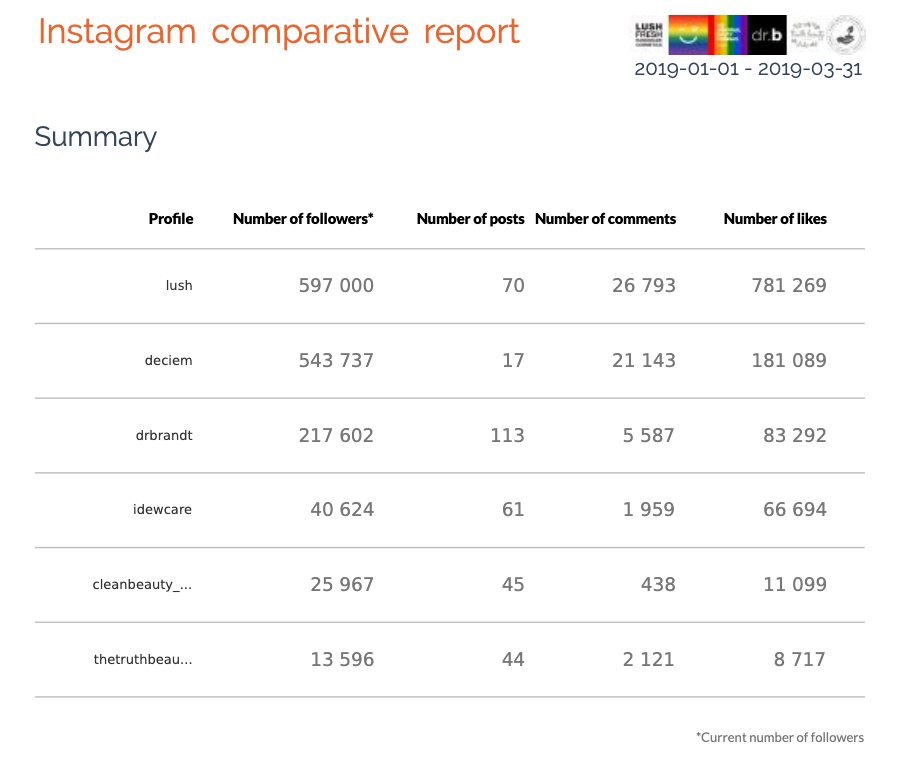
Comparative report for Instagram – overview
Then we move to the next sections, which is data about followers’ reactions, their engagement, hashtag usage and the content itself.
Step 1: monitor users engagement
Here at Sotrender, we measure engagement in 2 different ways:
- As a sum of activities (comments and likes) done by users on a selected profile,
- As an Activity Index (number of likes + number of comments*8).
Both of these metrics depend obviously on how big the profile actually is, meaning how many followers it has. This is why, to eliminate the size factor and actually measure the engagement under each brands’ posts, we are using the Relative Activity Index, which is measured as Activity Index/1000 followers.
The higher the Relative Activity Index is, the more effective each profile is in engaging their followers compared to competitive ones.
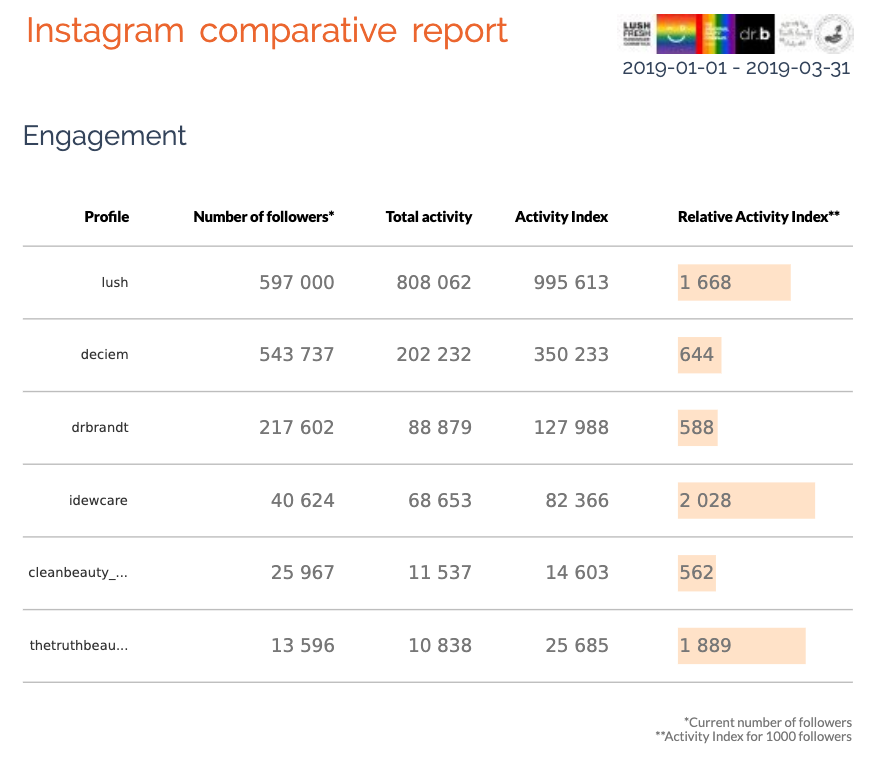
Instagram comparative report – Engagement
In our example, idewcare, which is a medium-size profile (40k followers), has the highest Relative Activity Index in the analyzed group.
On the other hand, the second profile with the highest Relative Activity Index is thetruthbeautycompany profile, which is actually the smallest profile in our group with only 13k followers. Keep in mind that the biggest profile has almost 600k followers, in comparison. It is worth checking then, how idewcare and thetruthbeautycompany are communicating with their target audience.
Another interesting metric is, a bit strangely looking one, coefficient of activity variation under posts*, which presents whether users’ engagement on each profile is diverse or rather stable.
*We calculate this as the ratio of standard activity deviation to average activity.
The diversity lower than 50% means that engagement under the brand’s posts is at more or less similar level each time.
In practice, this means that a brand is communicating with its audience regularly and in a planned way, whereasor while users are engaged under each post at a similar level.
Diversity higher than 100% basically means unequal engagement rates under a brand’s posts.
The following factors may cause high diversity:
- Running seasonal/occasional paid campaigns,
- Testing various hashtags – both when it comes to hashtags itself as well as the number of hashtags used,
- Organizing contests and giveaways often,
- Posting content connected to e.g. summer or winter sales, Christmas offers and so on (which can cause increased but not regular engagement).
Values between 50% and 100% mean medium diversity.
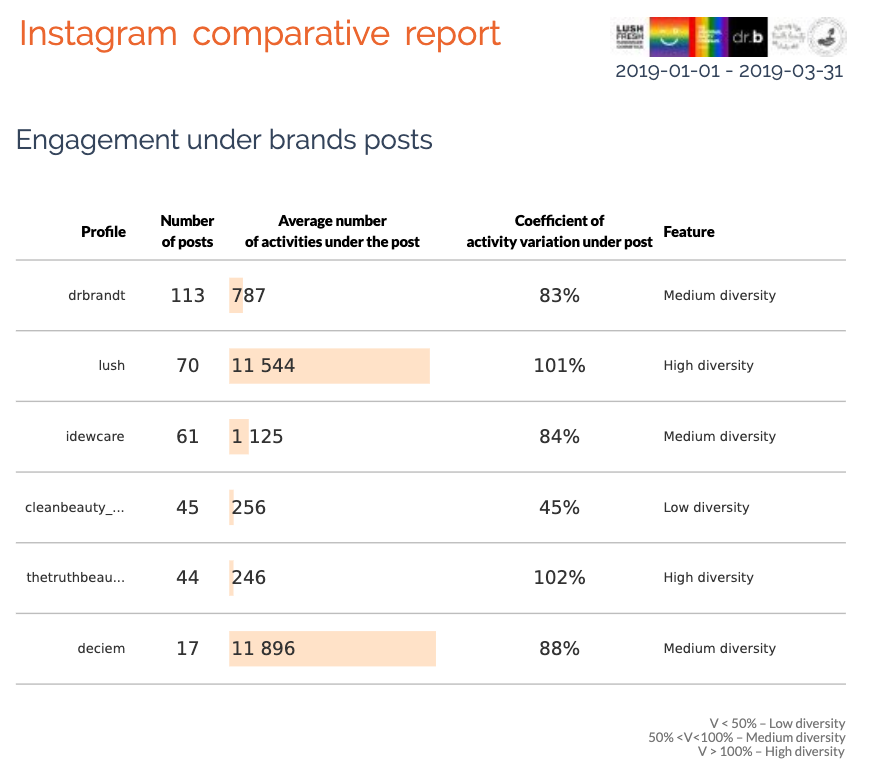
The engagement under brands posts
Majority of the brands we’ve analyzed are characterized by medium or high diversity (between 80%-100%). Only cleanbeauty_collective has low diversity in engagement, whereas lush which has diversity over 100% has also almost the highest number of activities under each post on average (more than 11k).
Feel interested already? Drop us an email at sales@sotrender.com
Step 2: Analyze posting times
What should definitely grab your attention in our report are the heat maps, which present:
- days of the week and hours of posting (intensity of communication in the analyzed group in general),
- the Activity Index metric, meaning users’ engagement under these posts divided by days and hours.
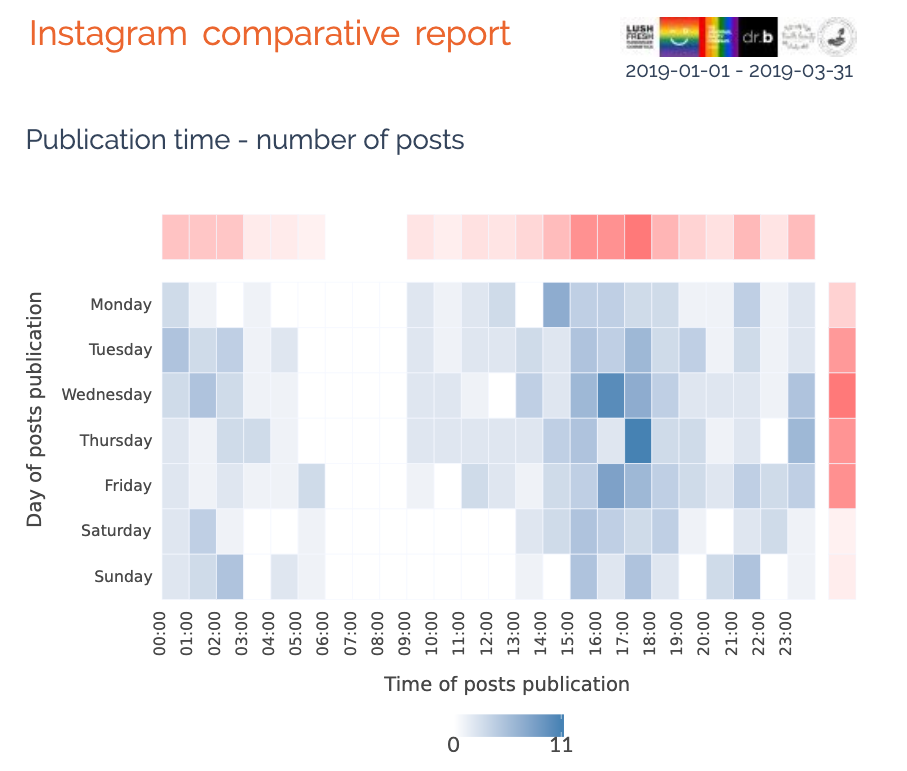
Publication time – number of posts
The red colour informs about the intensity of communication of selected brands on the given day and hour.
Our analysis shows that among analyzed profiles, the intensity of communication is the highest between 5pm and 6pm in the middle of the week, and generally in the afternoons between 3pm and 7pm on working days. Analyzed brands don’t tend to communicate with their followers in the morning (before noon).
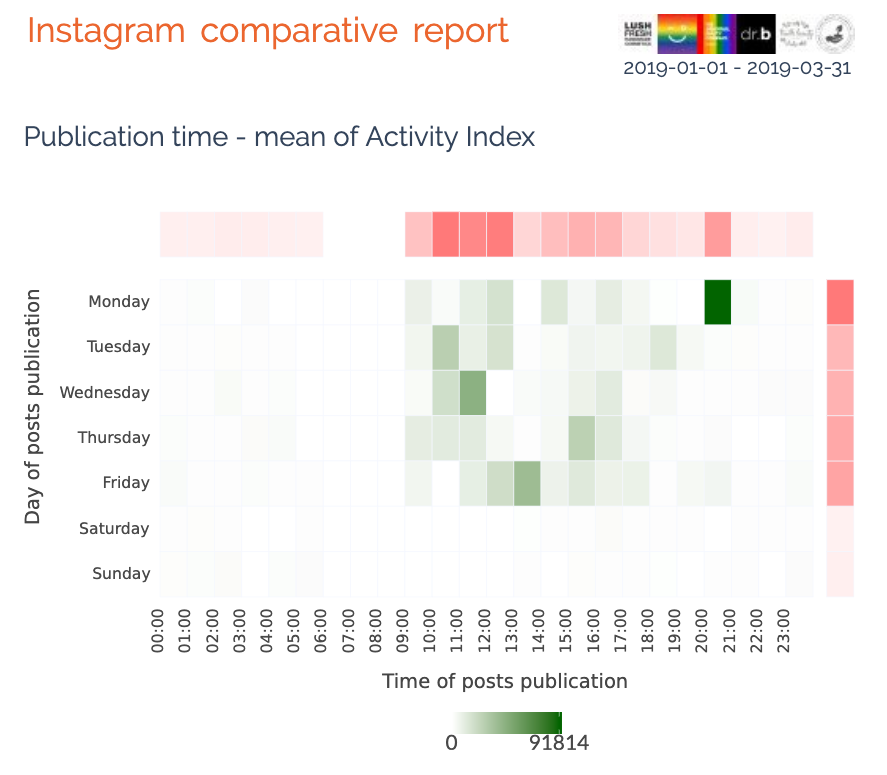
Publication time vs engagement
When it comes to followers’ engagement, however, it is the highest either around 9pm, or during the day, between 10am and 4pm on working days. The engagement under published posts is the lowest during weekends.
When planning posts on your profile, you can focus on posting at times, when:
- The number of posts is the highest, as it may mean that users are especially active and engaged on Instagram at that time (and for example are also making purchasing decisions),
- The intensity of communication is, in fact the opposite, relatively low, so that it will be easier for your content to be noticed by users,
- Average engagement is medium-high or high, because it means that users are using Instagram at that time and the chances that they will react to your content are also high.
It is worth compiling the above data with other data you own about your current clients from other sources. For example, you can analyze when they actually are purchasing products from your online store.
Step 3: check the performance of posts
In terms of content, what we take into account in our analysis is as follows:
- the percentage share of each type of post among all published posts
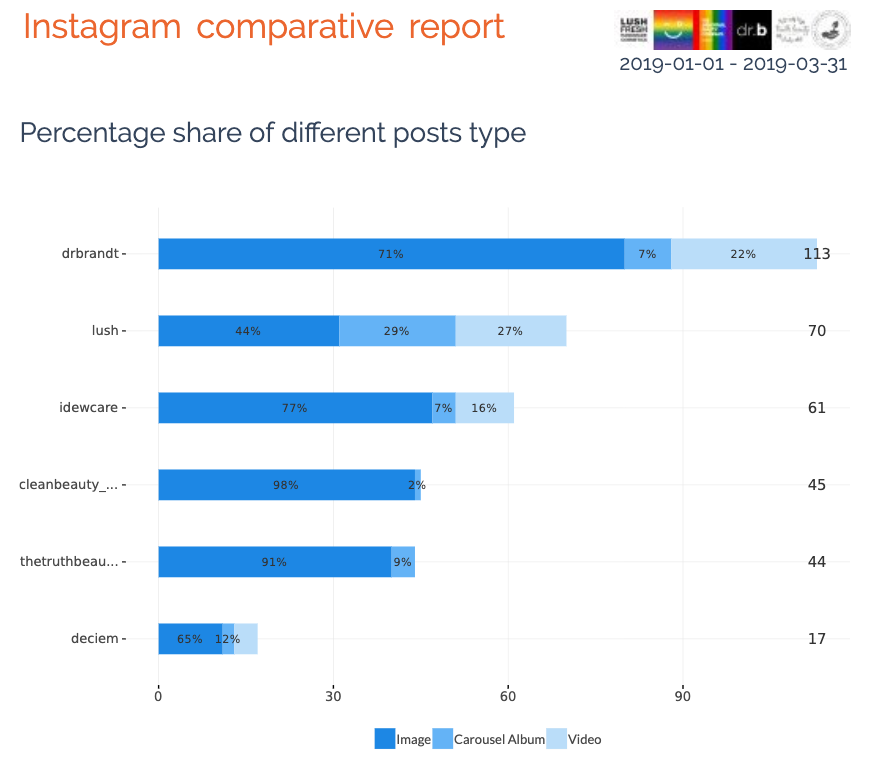
The percentage share of different posts type
- the distribution of engagement to particular types of posts
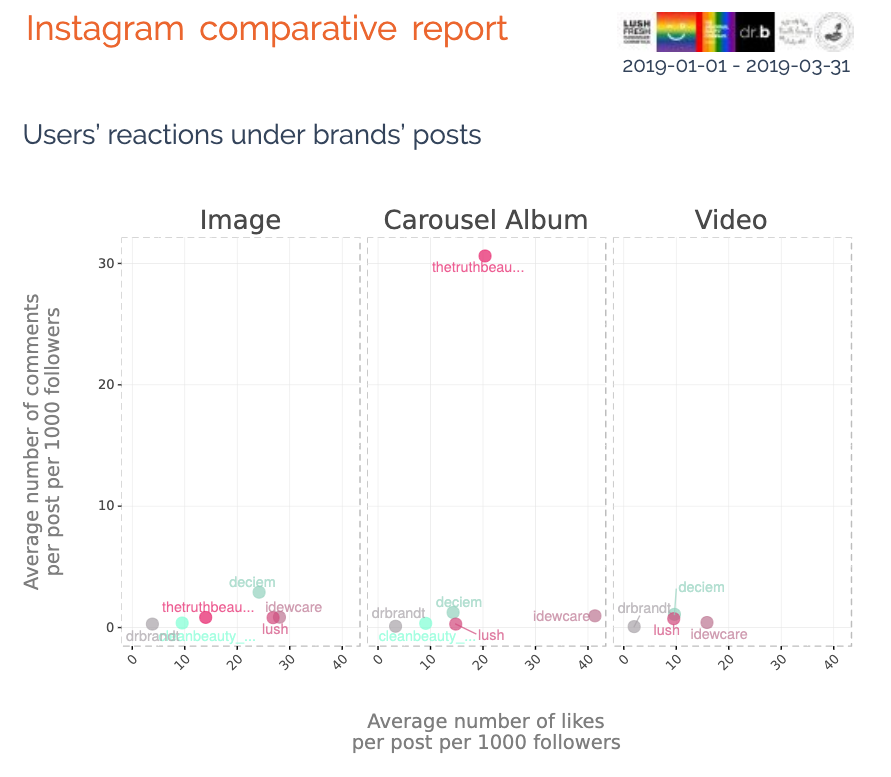
Users’ reactions under brands’ posts
From the charts presented above you can better know which types of posts: photos, videos or carousel posts, can help you increase the engagement on your brand’s profile.
On average, the most comments per 1000 users under the published photos was collected by deciem, while the most likes per 1000 users under the published photos was collected by idewcare. Again, it is worth to know how communication on these two profiles looked like, especially on deciem’s profile, as comments are a very valuable type of users’ engagement.
On Instagram, captions are extremely important, and as a consequence, hashtags used in a brand’s communication are as well. Since they can have a huge impact on reaching new users, it’s important to monitor which ones your competitors are using.
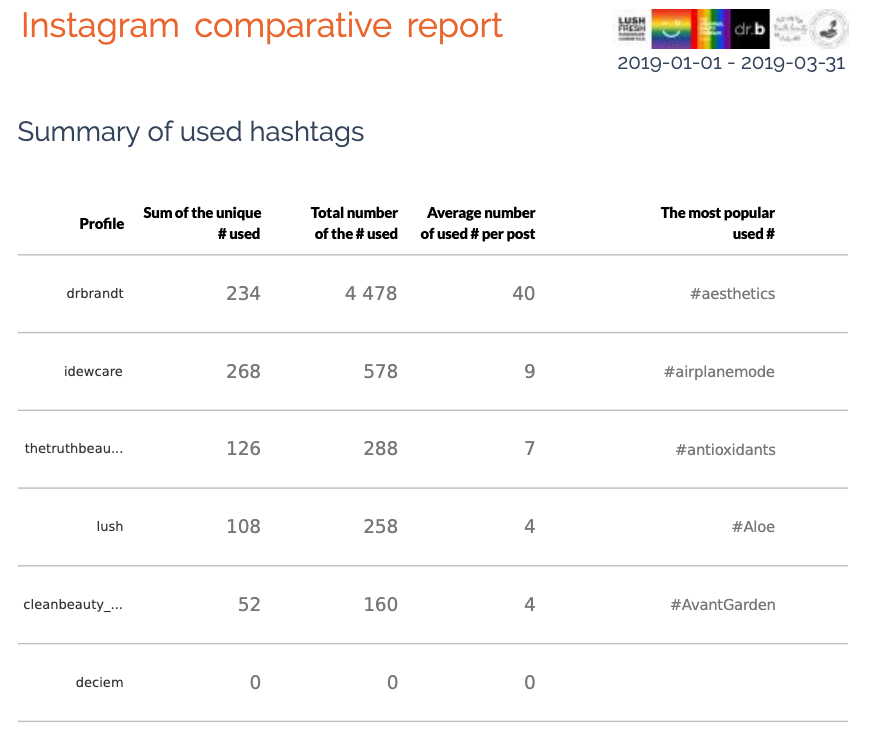
Summary of used hashtags on analyzed profiles on Instagram
It is interesting that in our case, selected beauty brands are not using many hashtags, and, for example, deciem was not using them at all during the first quarter of 2019.
In our report, you will also find a word cloud created from the most popular hashtags, which were used most often by the selected profiles in the analyzed time period.
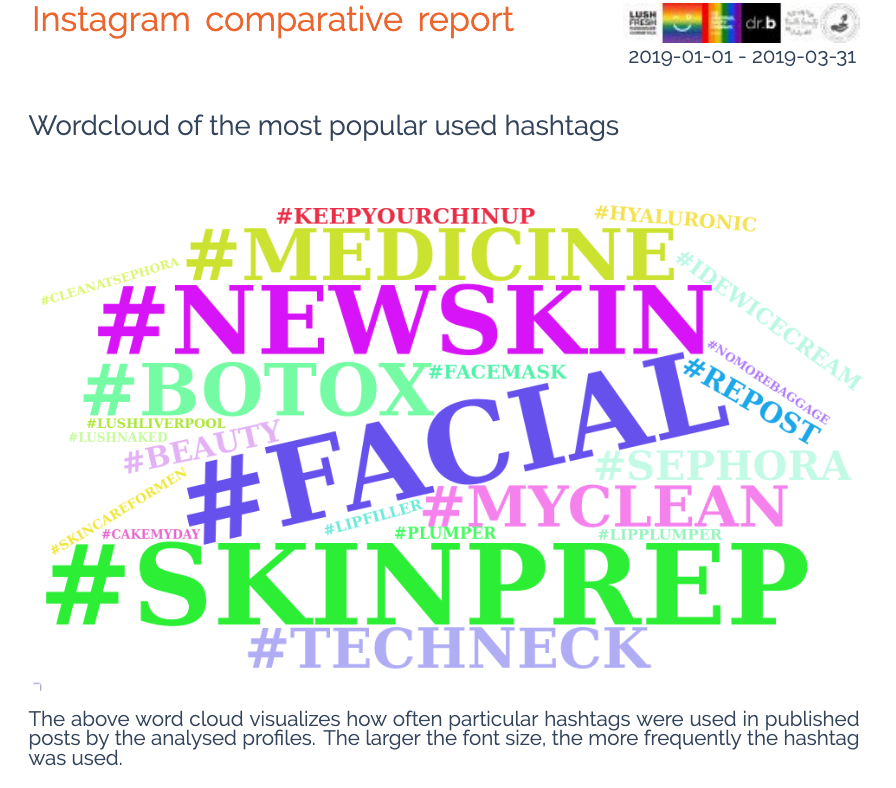
Word cloud of the most popular hashtags
It is always worth to test, how the hashtags used by your competitors actually work, as they might be exceptionally effective when it comes to increasing your profile’s reach.
Our report ends with an overview of 6 best posts from the analyzed profiles in the selected time period, sorted by our Activity Index engagement metric.
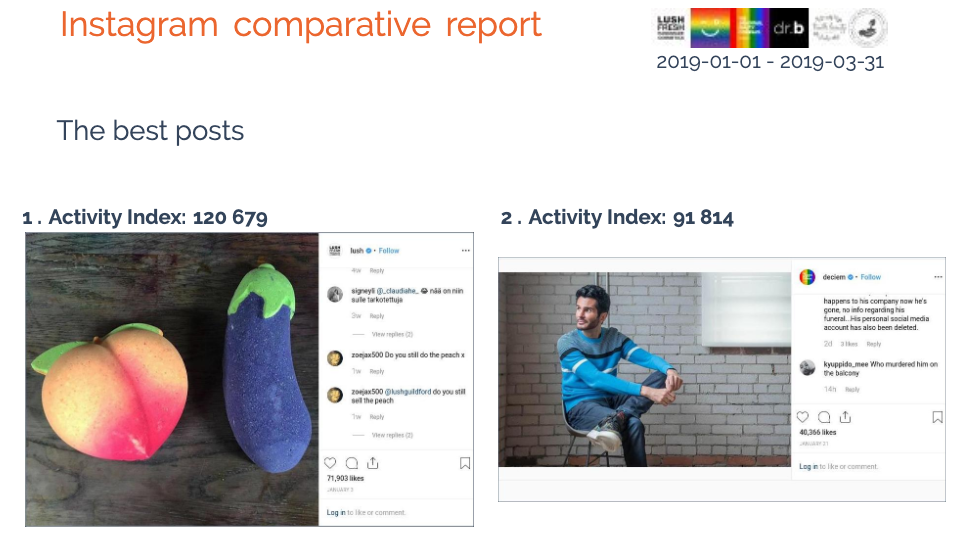
The best posts from analyzed profiles on Instagram
Comparative report – practical usage
Are you wondering how to use our report in practice? How can it help in your everyday work and duties?
I believe you will find an opinion from one of our clients very helpful:
Instagram marketing is extremely important for us as this social channel is continuously gaining importance. Also, considering the market we are on (retail), Instagram gives us much more possibilities when it comes to presenting both our products as well as the brand’s philosophy. We are trying to be in regular contact with younger customers, as in the near future they will be an actual decision and purchase-makers of our products, and on Instagram there is currently the largest number of them.
The report prepared by Sotrender provided us with many valuable insights on the effectiveness of our profile, effectiveness of the content we publish but also competitors performance. But what was the most valuable were the insights on both our audience engagement but also our competitors’.
Based on the knowledge from the report, we not only want to create more appealing and engaging content but also campaigns which will aim at increasing the number of followers. Due to its specific nature, Instagram is supposed to be a bit less of an advertising platform than Facebook, this is why it is especially important to have organic followership.
Krzysztof Gońka
Digital Marketing Manager
Social Media Leader at Decathlon Poland
Keep track of your competitors’ social media activities
Analyzing your competitors’ social media activities and performance is a great way to better know the market you are on, have a deeper understanding of your target audience, but also to optimize your own strategy and actions.
Here at Sotrender, we will be more than happy to help you achieve that 😉 We do both one-time reports as well as recurring ones. What is more, you will also get the explanation of charts and metrics included in each report.
The only restriction is that the Instagram profiles you want to analyze have to be business profiles. The number of profiles analyzed and the scope of time is arbitrary.
Are you interested in the Instagram comparative report? Drop us an email at sales@sotrender.com, call at +44 20 3322 4602 or simply fill in the form below 😉


