LinkedIn analytics is a bit more mysterious than Instagram or Facebook Insights – it’s a fact.
And while it feels like marketers pay less attention to analyzing this Microsoft-owned social media channel, for many brands LinkedIn can be even more powerful than investing in other, more popular platforms.
To access LinkedIn analytics, navigate to your LinkedIn homepage, click on the ‘Me’ icon at the top, select ‘View profile’ for personal profiles or ‘Admin tools’ for business pages, and then choose ‘Analytics’ from the dropdown menu.
How do you make the most of LinkedIn analytics with a little effort? You will learn from our guide.
Why is LinkedIn analytics important?
In general, analyzing your LinkedIn marketing efforts is crucial because it’s the only way to ensure future growth (both of your Company Page and the whole business). Tracking LinkedIn analytics is essential for improving your marketing strategy and gaining insights into audience engagement.
By doing things the same way all the time, without testing various content formats, visuals or texts and monitoring the results of those tests, you won’t be giving yourself the chance to be more successful.
Stagnation on social media isn’t usually a good thing.
So, you should analyze your LinkedIn performance in order to:
- Better understand your LinkedIn audience and their interests.
- Identify which content types are the most effective.
- Optimize the content you produce and marketing strategy in general.
- Outperform competitors on the platform.
- Be able to quickly and effectively report the results of LinkedIn marketing to other stakeholders.
LinkedIn analytics: Which LinkedIn analytics tools to use?
Let’s start from the basics – where do you get all the data from?
There are at least two options.
First is, of course, LinkedIn’s built-in analytics, which, as on other social media platforms, is quite limited.
The second one is using an external social media analytics tool. The best LinkedIn analytics tools enable marketers to track key metrics, evaluate campaign effectiveness, and ultimately enhance the return on investment from their LinkedIn marketing efforts.
To show you the differences between using the built-in solution and an external tool for analyzing LinkedIn performance, we’ve prepared a short infographic.
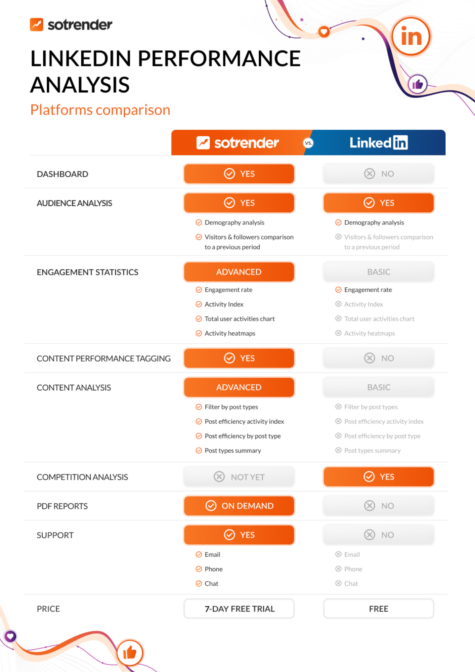
As you can see, several features differentiate Sotrender from LinkedIn’s built-in analytics.
- A dashboard including all the key metrics.
- More in-depth audience metrics available.
- More engagement metrics, including the Activity Index metric and activity heatmaps.
- Content tagging and content strategy features.
- Content analysis with various filtering and sorting options.
- Data visualized on interactive dashboards and charts.
- 24/7 support.
When in use, these will turn into tangible benefits for digital marketers and social media specialists.

Let’s talk about the details.
Which important LinkedIn metrics should I monitor?
Here at Sotrender, we’ve sorted LinkedIn metrics into three categories:
- Audience
- Reach and engagement
- Content
The LinkedIn analytics dashboard is crucial for monitoring various metrics available on your company page. Understanding these performance metrics is key to building an effective content strategy and increasing engagement on the platform.
Thanks to that, it’s much easier to find the data you’re currently looking for and automatically hop to the right section.
As we will do now. 😉
Audience metrics
As you probably already know, LinkedIn offers the possibility to analyze both follower and visitor data, including the demographics for both of these groups.
To access personal profile analytics, navigate from the LinkedIn homepage by clicking the ‘Me’ icon and selecting ‘View Profile’.
In Sotrender, you can track how the number of followers (and visitors) on your Page was changing day by day, but also how many followers (or visitors) you had on a specific day in the past.
Note that those data will start collecting from the moment you connect your LinkedIn profile to Sotrender.
This way you can learn which posts helped you gain new followers and which resulted in losing some followers. Even though it’s quite easy to monitor those data in real-time (or almost in real-time) in LinkedIn’s built-in analytics, it’s much harder to draw such conclusions over a longer period of time without an external app.
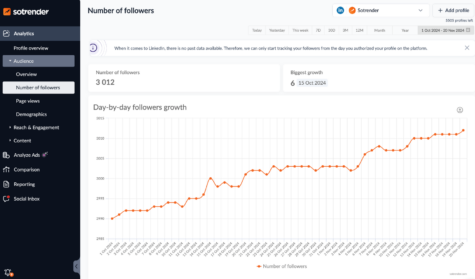
Checking followers growth in Sotrender
One thing that differentiates LinkedIn from other social media platforms is more in-depth demographic user data, which are extremely insightful for marketers.
Demographics analysis is a great way to:
- Know your LinkedIn audience better.
- Monitor if the communication reaches the right audience.
- Optimize ad campaigns both on LinkedIn and other social channels.
- Create content that answers the needs of both visitors and followers of your profile.
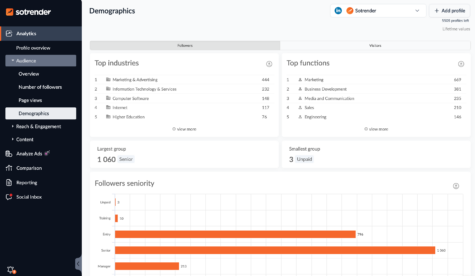
You can analyze your LinkedIn followers demographics in Sotrender
In Sotrender, you can obviously monitor all the demographic data (location, seniority, functions, industries, company size), but also export them as pdfs or pngs and then use them in your strategy and more.
Reach and engagement metrics
The reach and engagement section is the most extensive section in terms of the data available in it.
Let’s start with one of the most important metrics on LinkedIn – impressions, which tell you how many views your content had.
In Sotrender, you can analyze impressions (both visitor impressions and follower impressions) on one chart, but we also present a separate chart with organic and paid impressions.
LinkedIn’s built-in analytics doesn’t offer impressions data in such an aggregated way, so it’s a significant convenience for everyone who wants to have an overall understanding of the content performance.
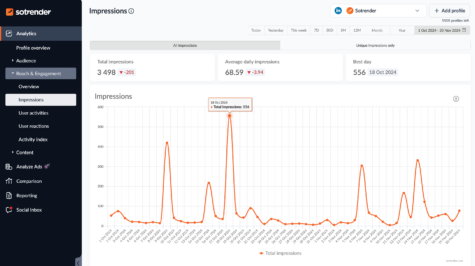
Unique impressions analysis in Sotrender
Besides the total number of impressions, you should also monitor unique impressions (both paid and organic). Unique impressions tell you how many users your content reached in a given period of time (or per day).
Side note
On LinkedIn, it’s not possible to analyze reach (which we tend to analyze, e.g., on Facebook). On LinkedIn, instead of reach, you can analyze unique visitors.
Even though impressions are important, even more important to track are user activities. And this is what you’ll find more of in Sotrender compared to LinkedIn itself.
One thing is the total number of user activities presented on the chart, but what is also worth your attention is in what ways users interact with your Page’s content.
Of course, the more comments and shares you get, the better. These user activities imply that they are more engaged in your communication.
LinkedIn post analytics is crucial for measuring engagement metrics and assessing the performance of your content. Tools like Sotrender provide detailed statistics on likes, comments, and impressions, helping you understand audience interaction.
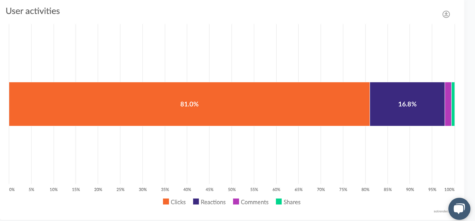
LinkedIn user activities analysis in Sotrender
As we’re already talking about various types of user interactions, it’s a good moment to tell you more about our proprietary Activity Index metric, which is an aggregated metric that informs you about the total engagement on a profile (or under one post).
To count Activity Index (AI), we take into account all the types of activities, and each has a different weight:
- Reaction – 1
- Comment – 4
- Share – 16
Sotrender’s Activity Index metric is calculated based on the following formula:
Activity Index = (reaction x 1 ) + (comment x 4) + (share x 16)
As you can see, the more comments and shares your content gets, the higher the Activity Index metric will be.
You can also analyze the Activity Index on a line chart day-by-day.
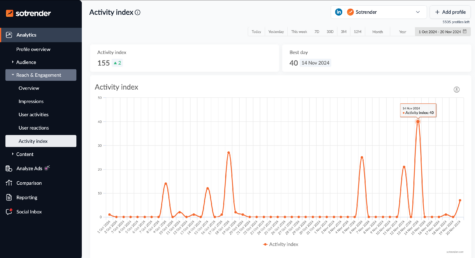
Activity Index metric, Sotrender
The last thing in the Reach and engagement section is user reactions. This is another piece of data that can’t be analyzed in the LinkedIn analytics panel, as LinkedIn doesn’t show the total number of each reaction.
Luckily, those can be quickly checked once logged into Sotrender:
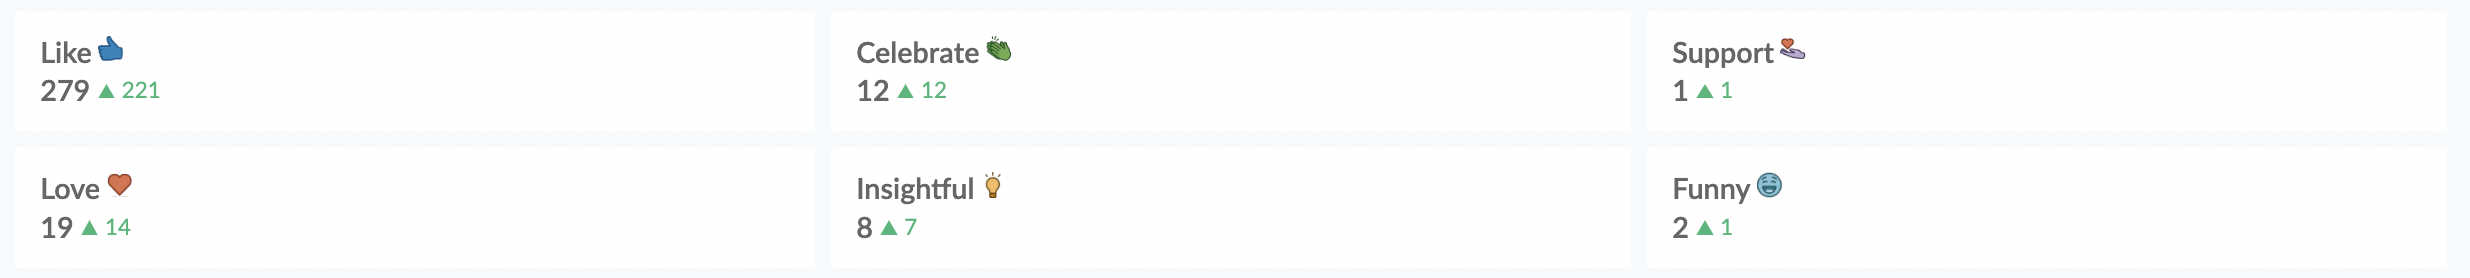
LinkedIn user reaction analysis in Sotrender
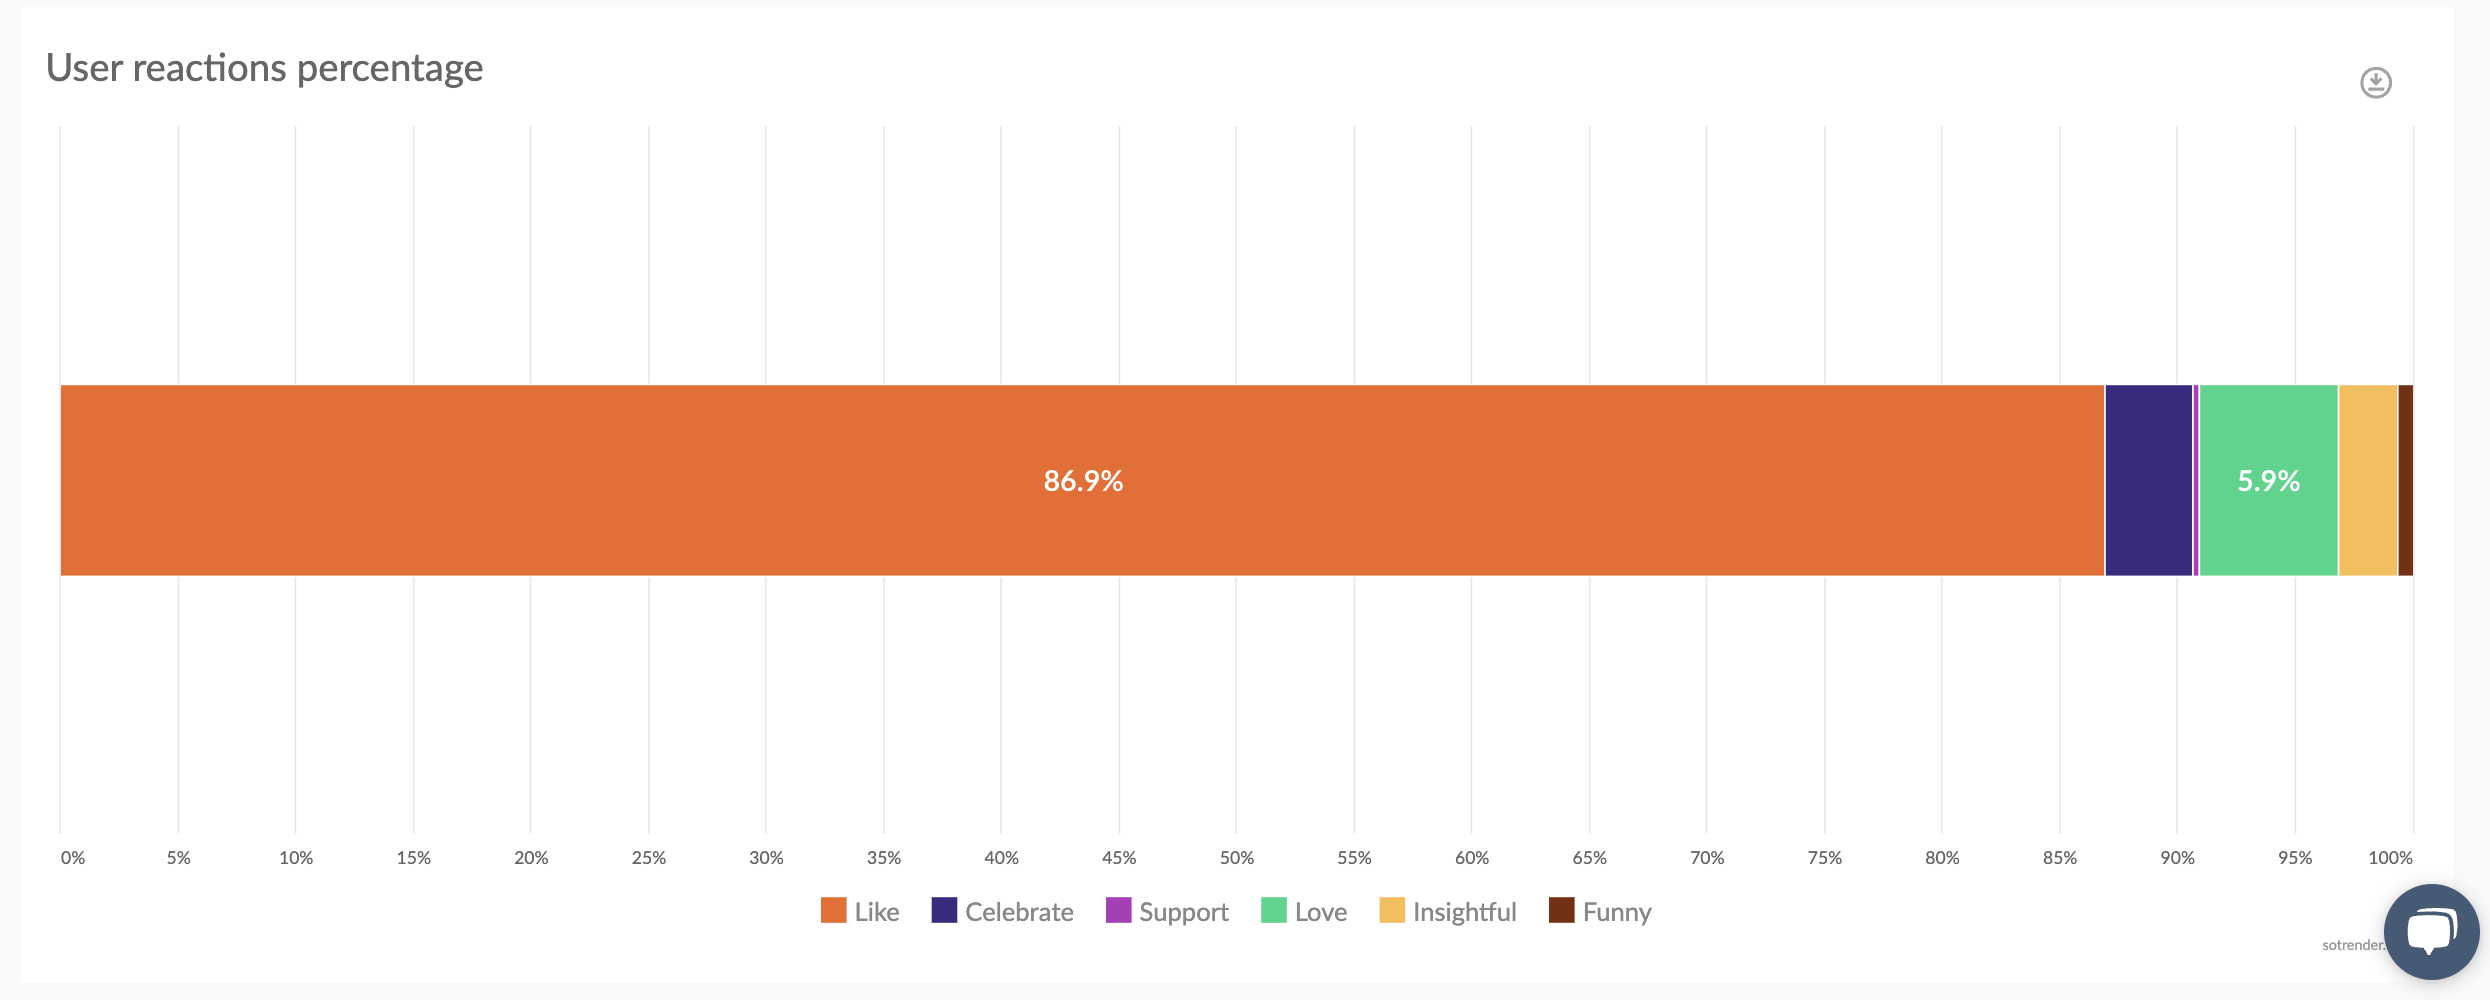
This way you can easily see what emotions your content evokes in LinkedIn users.
Let’s sum it up.
Monitoring user activities on your Company’s LinkedIn Page is crucial if you’d like to enhance your marketing on LinkedIn and build relationships with LinkedIn users – your future customers.
Content metrics
Content analysis is usually the most interesting part of analyzing the overall performance on any social media platform. That’s why we made sure that in Sotrender, you’ll find more data and more functions than in LinkedIn’s built-in analytics.
LinkedIn page analytics provide valuable insights into posts and personalized suggestions to optimize content strategies.
To make the analysis even smoother and to make it easier for you to draw conclusions, we’ve implemented additional filtering and sorting options for all the content published on a Page.
In Sotrender, the following filters are available:
Filters by content type:
- All posts
- Text posts
- Image posts
- Videos
- Articles
- Carousels
- Multiimage photos
- Polls
- References
- Documents
Then, in order to sort your content, you can use the following metrics:
- The total sum of activities
- Impressions
- Video views
- Clicks
- Reactions
- Comments
- Shares
- Engagement rate
- Activity Index
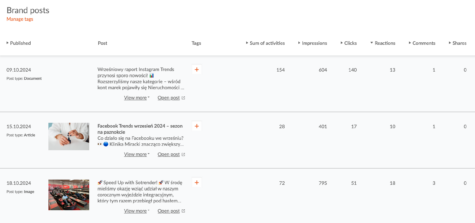
Analyze your LinkedIn post performance in Sotrender
It’s a great help when it comes to analyzing your content performance, especially if many posts have been published or you’d like to analyze your content for a longer period of time.
This way you’ll quickly learn, for example, which articles or video posts had the highest number of impressions or reactions. Based on that, it will be much easier to continue working on your LinkedIn content strategy.
See our guide on how to post on LinkedIn to get maximum engagement >>>
And finally, our gem, the Content performance feature.
In Sotrender, it’s also possible to tag each post you’ve posted on LinkedIn. Those tags are fully customizable and reflect what you post on LinkedIn. Tags can relate to your product categories, events that you organize, the topics of your posts, and many more.
Let’s give two examples.
If on a Company Page, you only run HR communication, your tags can be as follows:
- Employer branding
- Conferences
- Integration events
- Job offers
If you have one LinkedIn Page for the whole company, you can create tags such as:
- HR news/job offers
- Educational content
- Products
- Events
- Company/industry news
After tagging all your posts, you’ll get a chart (that will be updating automatically with every new post tagged), based on which you’ll learn which content types are the most effective regarding:
- Impressions
- Organic impressions
- Sponsored impressions
- Activity Index
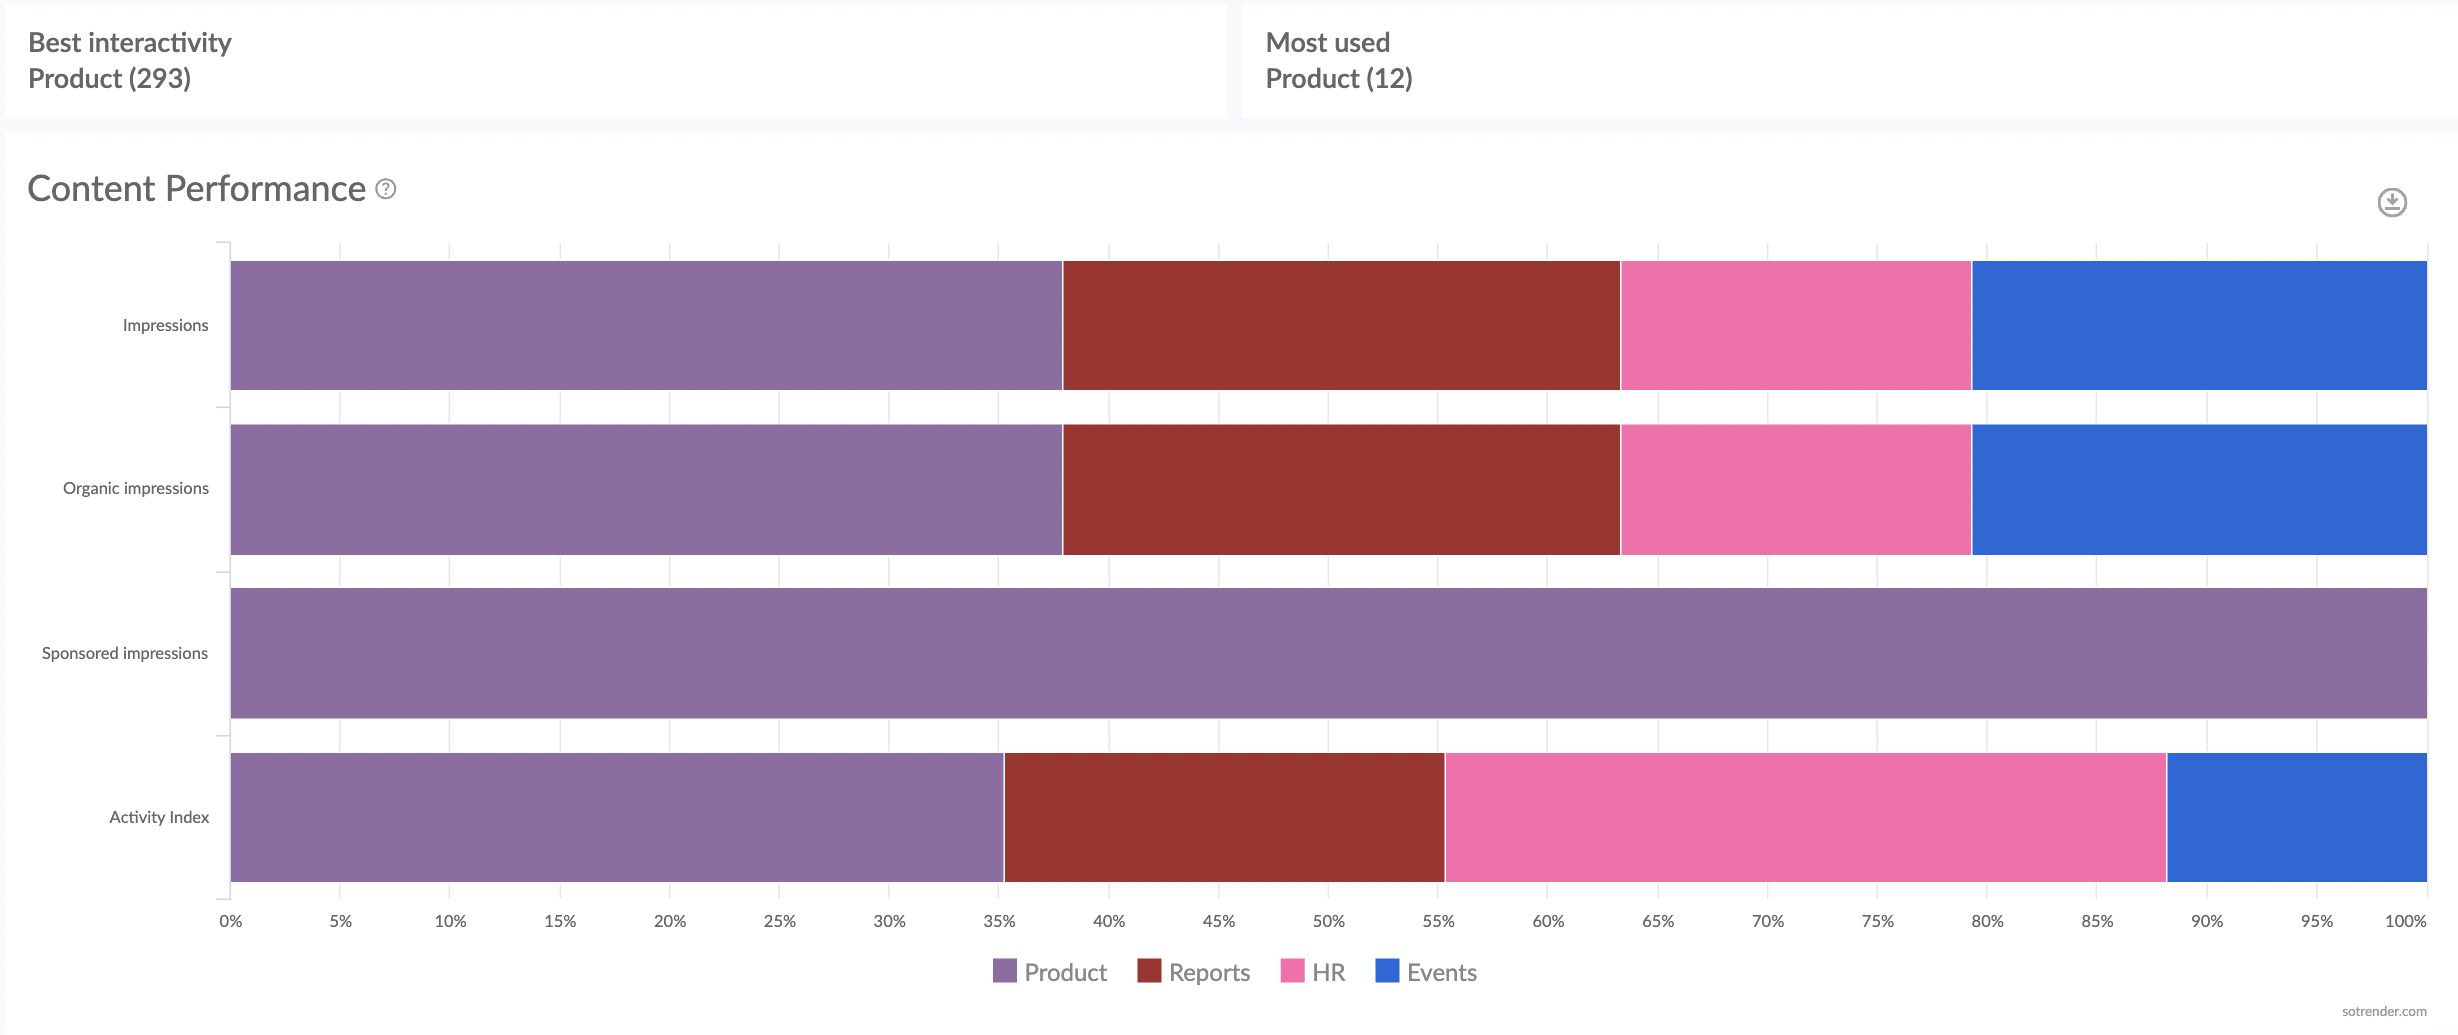
Analyze your content performance with Sotrender
For example, if you’ve ever wondered what content you should post more frequently to increase your organic reach – whether it should be news, product-related posts, educational content, or something else – answering this question with our Content performance chart will now be a piece of cake. 😉
Creating and Customizing LinkedIn Analytics Reports
Creating and customizing LinkedIn analytics reports is a crucial step in tracking your performance and measuring the success of your LinkedIn marketing strategy. To create a report, start by navigating to your LinkedIn page, then head to the Analytics tab and select the type of report you need. You can choose from various report types, including content analytics, follower analytics, and page views. Once you’ve selected the report type, you can customize it by selecting the date range, metrics, and other options that best suit your needs.
Use LinkedIn analytics to improve your content performance
We hope that now with more extensive LinkedIn analytics possibilities, marketers will feel more encouraged to invest in this social channel. Embedded analytics should also help them explore the potential of this platform and act more consciously.
To create LinkedIn analytics reports, you can use LinkedIn’s native analytics tools or third-party tools. Generating these reports is crucial to demonstrate the effectiveness of your marketing efforts on LinkedIn.
Once you decide to use Sotrender, you will not only gain access to reliable and in-depth data but also 24/7 support from our team. We’ll be happy to answer all your questions and reveal all the hidden gems of Sotrender anytime.
As always, there is a 7-day free trial available, during which you can test all the Sotrender features. You can see how each social channel’s analytics, including LinkedIn’s, looks in practice.
There is also the possibility to book a free demo with one of our consultants who will walk you through how Sotrender works.


