Unfortunately, Instagram doesn’t allow you to easily download Instagram analytics from your account. To access Instagram Insights and analytics features, you need a business account: switching to a business account unlocks key data and tools for reporting. You can open your Instagram Insights on your desktop or phone, but you can’t download a whole report. So then… what’s the solution?
Introduction to Instagram analytics
Instagram analytics is a crucial component of any successful Instagram marketing strategy. By diving into analytics, you gain a clear picture of how your content is performing, who your audience is, and what drives engagement on your Instagram account. Whether you’re managing social media for a brand, working as a social media manager, or growing your personal presence, using the right Instagram analytics tools can make all the difference. These analytics tools help you track key metrics, spot trends, and make data-driven decisions to refine your content and boost your results. In today’s competitive social media landscape, leveraging Instagram analytics is essential for anyone looking to grow their reach, connect with their audience, and achieve their marketing goals.
Can I download Instagram analytics through Instagram?
The only way that you could ever download Instagram analytics is by screenshotting the results and compiling data together. Instagram doesn’t support exporting your data as an Excel sheet or a PDF, so this is the only choice you have if you’re not willing to spend much.
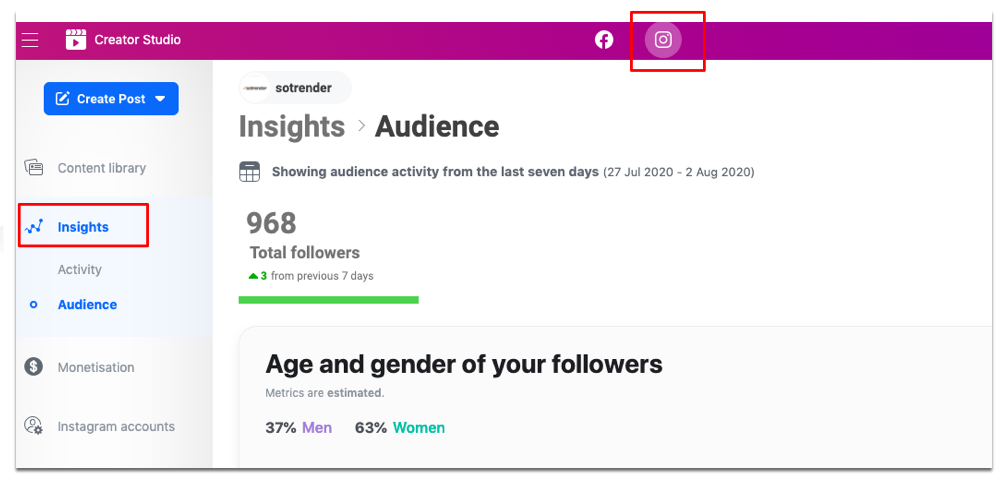
You can potentially check your Instagram Insights on a desktop by using Creator Studio. Creator Studio allows you to publish content, so we understand the appeal of using it for content and analytics. However, you will see there your data for the last 7 or 30 days only. You can also view analytics within the Instagram app, but the available data is limited in scope and duration. That means you would have to compile data every week, or every month, before it disappears!
It takes up a lot of time and you’ll have to revisit Creator Studio frequently. Instagram’s native tools only provide basic analytics, such as likes, comments, engagement rates, and follower growth, which may not be sufficient for in-depth analysis.
The alternative is the simplest solution if you have money to spare.
Navigating the analytics dashboard
Once you’ve set up a Business or Creator account, accessing Instagram Insights is straightforward and opens up a world of valuable data. Simply tap the menu icon on your Instagram profile and select “Insights” to enter the analytics dashboard. Here, you’ll find a user-friendly interface divided into sections like Account Insights, Audience Insights, and Content Insights. Each area offers detailed metrics and analytics data, such as reach, impressions, engagement, and follower demographics. For example, Account Insights give you an overview of your profile’s performance, while Audience Insights reveal who your followers are and where they’re from. Content Insights break down how individual posts, stories, and reels are performing. By regularly exploring these detailed metrics, you can access Instagram Insights to monitor your progress, understand your audience better, and make informed choices to strengthen your Instagram marketing strategy.
Tracking engagement rate
Engagement rate is one of the most important metrics in Instagram analytics, as it shows how actively your audience interacts with your content. You can track your engagement rate using Instagram Insights or other Instagram analytics tools, which provide detailed metrics on likes, comments, shares, and saves. These engagement metrics help you identify which posts resonate most with your followers and which types of content drive the most interaction. By analyzing your engagement rate over time, you can identify trends in your audience’s preferences and adjust your content strategy to boost engagement. For instance, you might discover that certain hashtags, post formats, or posting times lead to higher engagement rates. Using analytics tools to monitor these detailed metrics allows you to continually refine your approach and maximize the impact of your Instagram posts.
Measuring follower growth
Keeping an eye on follower growth is essential for understanding how your Instagram account is expanding and whether your content is attracting new audiences. Instagram Insights and other analytics tools make it easy to track new followers, monitor changes in follower demographics, and analyze audience growth over time. By measuring follower growth, you can see how different campaigns, content types, or posting schedules affect your ability to attract and retain followers. This data is invaluable for identifying trends, such as which topics or formats are most effective at driving growth. With these insights, you can fine-tune your strategy to better target your ideal audience and ensure your Instagram marketing efforts are delivering real results.
Utilizing historical data
Historical data is a powerful asset in Instagram analytics, allowing you to look back and see how your account has evolved over time. By reviewing historical data through Instagram Insights or other analytics tools, you can track long-term trends in engagement, follower growth, and content performance. This helps you understand what has worked in the past and what hasn’t, so you can make smarter decisions moving forward. For example, analyzing historical data can reveal the best times to post, the most effective content types, and shifts in your audience demographics. By leveraging these insights, you can continuously refine your Instagram marketing strategy, optimize your content for better results, and stay ahead of trends in your niche.
Using third-party Instagram analytics tools to download Instagram analytics
Although you might want to skip paying for a third-party application to download Instagram analytics for you, there are a few reasons why you should. We’ll be using Sotrender, our own tool, to make our point. 😉
Firstly, you won’t miss out on any of the classic Instagram analytics from Insights. All of the same metrics will be featured in all of your reports and analyses. On top of that, you will see additional metrics like the Activity Index to get a better summary of user activity and engagement. Third-party tools also provide detailed insights that go beyond what is available in Instagram Insights, helping you uncover more about your Instagram performance.
The second benefit is that you can download specific graphs and data if you don’t need a whole report. All you have to do is press the download button, and you’ll have what you need. You will also have more control over the number of days you want to analyze. This will make it easier to go back and compare the results of specific marketing campaigns or periods of time! Advanced Instagram analytics features allow for deeper analysis of content performance and audience behavior. Keep in mind that Sotrender starts gathering your historical data from the moment you link your profile to the tool, and since this data won’t disappear, you can go back to it whenever you need a comparison.

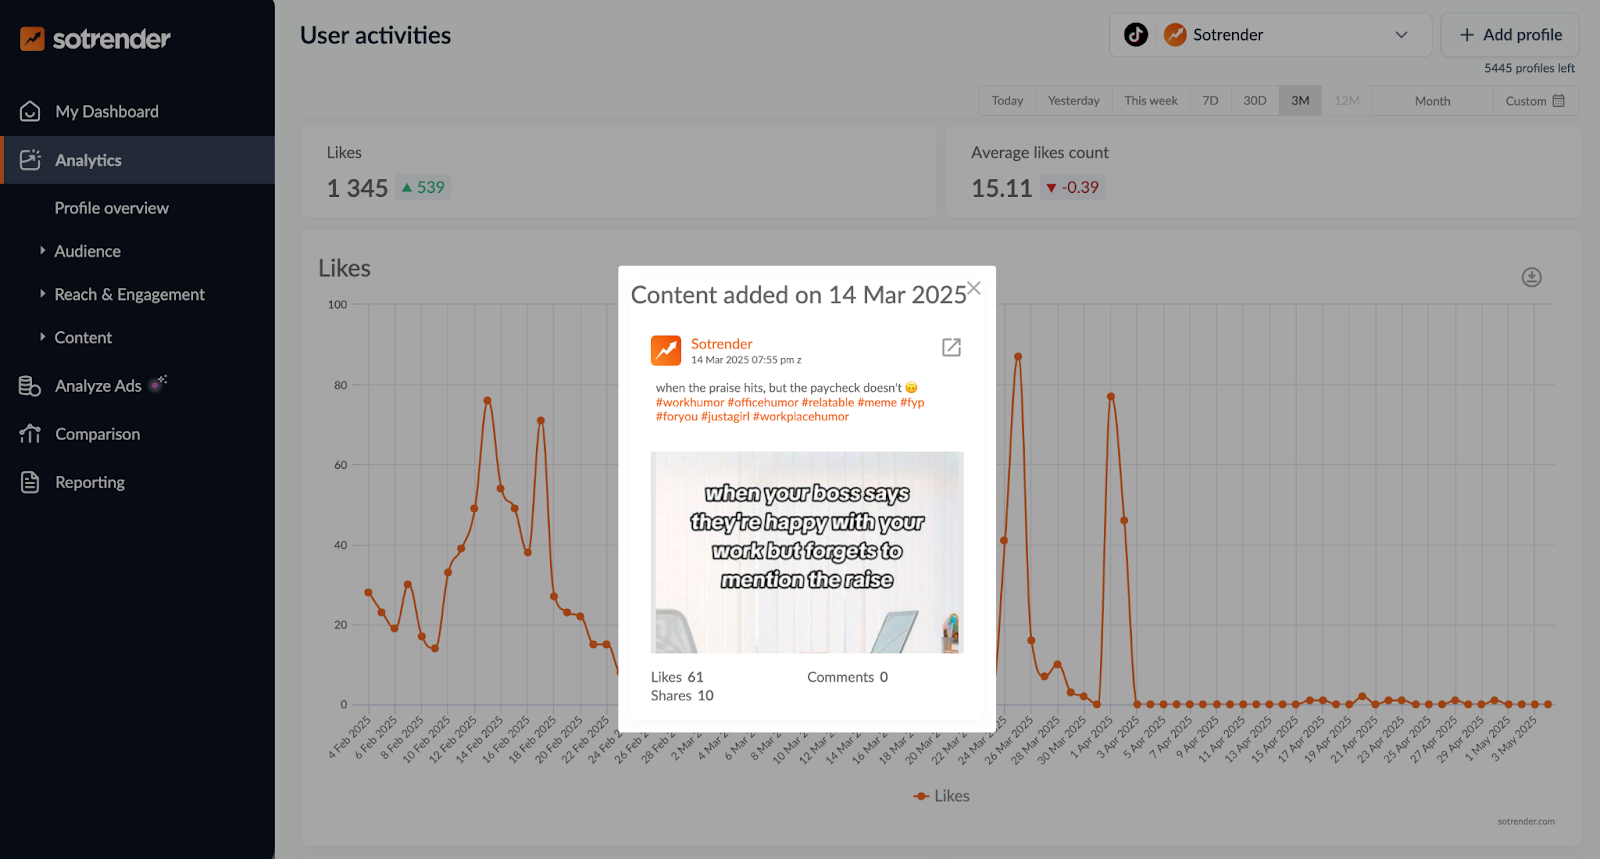
On another note, you’ll notice that you’ll be able to interact with your graphs. Just click on any of the days where you see activity, and you’ll see what you posted that gave you more or less engagement than usual. Data visualizations, such as charts and dashboards, make it easier to interpret analytics data. Now you’ll know what type of content is more interesting to your audience and avoid what they don’t engage with. These insights are actionable and can be used to improve your Instagram marketing strategy.
Finally, you can cut yourself some slack and get all of the data delivered to your email whenever you need it. Open the reporting tab and schedule a recurring report that will be delivered when you need it. You can schedule reports to be sent automatically at regular intervals, and these tools can automate reports to save time.
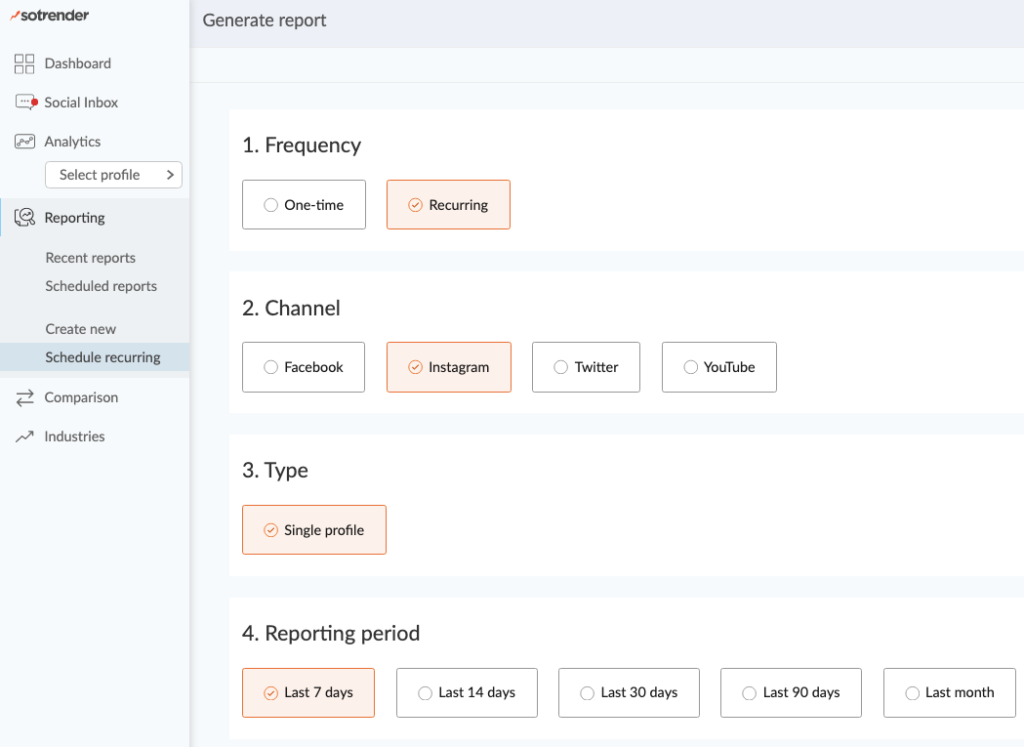
You can even customize the contents of the report with just a few clicks. It’s also good to know that you can skip anything that’s redundant! You can create custom reports tailored to specific marketing goals or client needs.
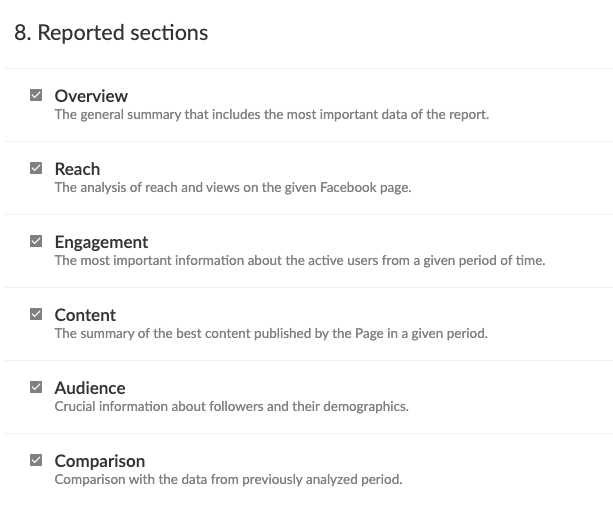
A report can have around 30 pages if you include all of the reported sections. Pick and choose what you need to make it shorter.
What is more, you can fully automate the reporting process. That means you don’t have to head to the reporting section every month and go through the same process over and over. You can do it once, and then on a selected day (e.g. the first day of each month) a ready report will be automatically sent to your inbox. 😉
Understanding your audience is crucial. Third-party tools provide in-depth analytics about your Instagram audience, including demographics and engagement patterns.
By using these tools, you benefit from a comprehensive reporting tool for Instagram analytics. They help you track and optimize your overall Instagram performance.
An example of an automatic Instagram analytics report
Want to take a peek at how such a report looks like? Here’s a sample Instagram analytics report to give you a better idea of what you can expect. These reports provide comprehensive insights into your Instagram performance.
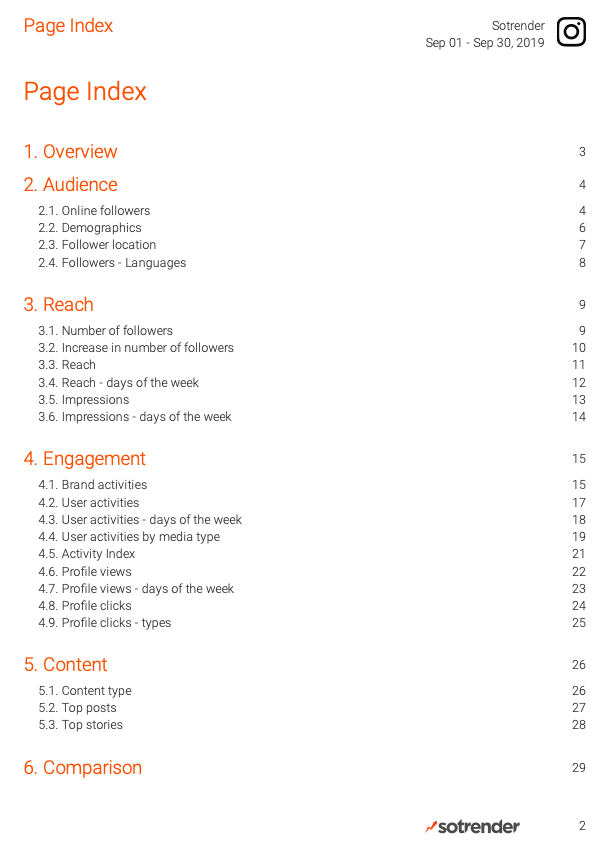
The first thing you will see when you open your Instagram report is the table of contents. Instagram analytics reports can be customized to highlight the most relevant metrics for your needs. You can check out the specific section that interests you by just clicking on the title. 🙂
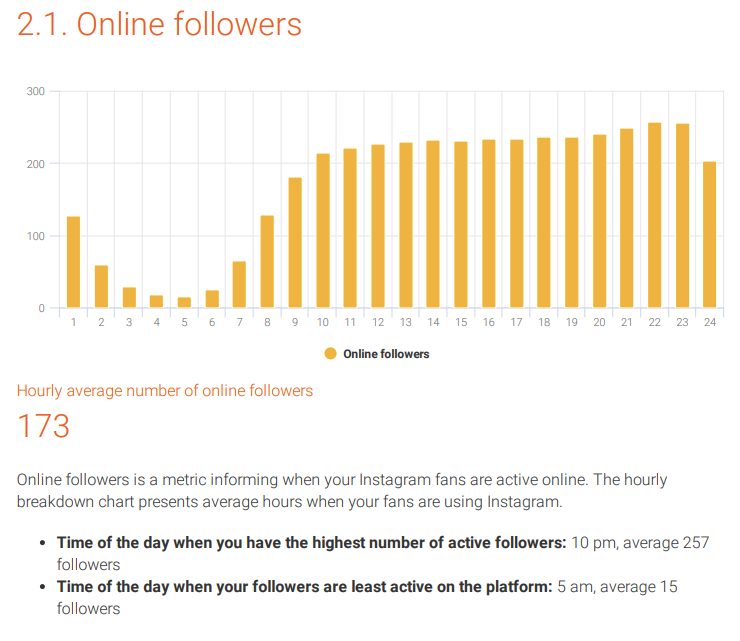
To keep things simple, we’ll just show you a few metrics in the report and their summaries. In the first example, the report includes a basic summary of the best and worst times to post on Instagram based on the number of online followers. The report also highlights your top performing posts based on engagement and reach. This gives a brief answer to the question “when should I post my content?” Problem solved.
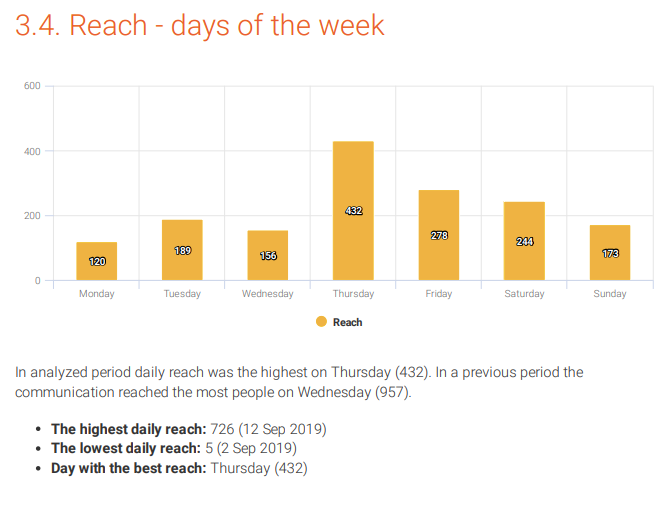
If you were curious about when you had the most people seeing your content, you’ll know. You can see that something that was posted on Thursday got a lot of attention and got spread pretty far. The report also includes information on top audience demographics, such as age, gender, and location, to help you better understand your audience.
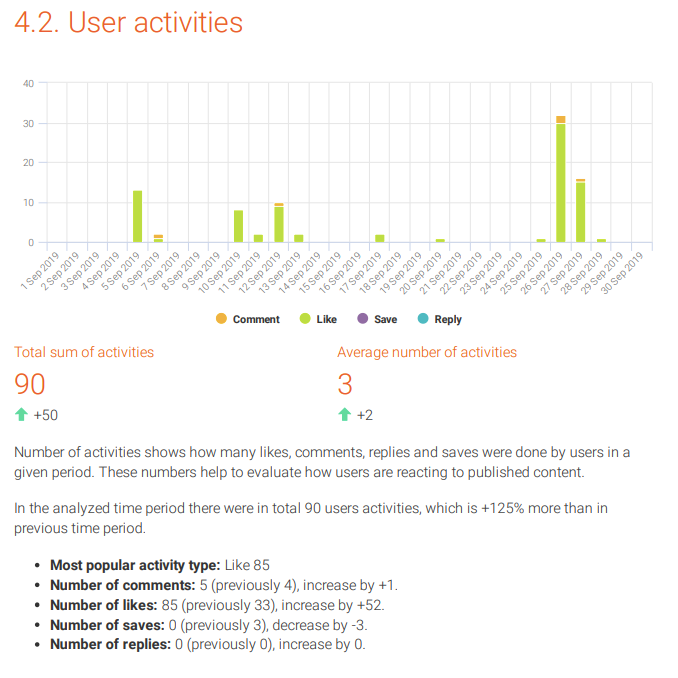
And if you were interested in checking out the proportions of user activities, then you’ll get your answers with this simple bar graph. You get the benefit of seeing a comparison to the previous period which you otherwise wouldn’t be able to see in Instagram Insights.
That’s really all you have to know about downloading Instagram analytics and exporting data. Use Sotrender’s reporting feature according to your needs and focus on other activities. There’s a free trial that you can try out in case it sounds relevant to you?
Think about your budget and whether it makes sense for you to subscribe to an external social media analytics tool. You know your business the best and what’s realistic for your budget. Good luck and happy analyzing!


