If you are an Instagram creator and if you treat your Instagram presence seriously, most probably you’d like to know if you’re successful in what you do and how your audience reacts to the content you publish.
You can learn that all by analyzing your historical Instagram data.
However, as you probably know, Instagram itself isn’t making it easy for us to track our performance. Where to find reliable and accurate data then?
Instagram Insights – a free tool to check your Instagram data
You probably know Instagram Insights quite well, and most probably you are also aware of the fact that the data presented there is quite limited. The biggest obstacle is, though, not the type of data but the time frame for which you can analyze them – for some metrics it is only the last 90 days.
As you have probably experienced so far, the Instagram app itself has limitations in providing comprehensive historical data.
How can one analyze their performance over a longer time periods? How can you know if you are actually improving? If you are engaging your audience less or more than in the past months? With Instagram Insights, unless you manually write down your data regularly, you simply won’t know.
You can also access your Instagram data from Facebook’s Creator Studio. There are some pros and cons of using this solution. Firstly, just like Instagram Insights, it is free. It also enables you to access your data from a desktop device, which may be important for some users, especially people working in social media or marketing agencies.
However, as it’s with Instagram Insights, in Creator Studio presented data are also quite limited.
Also, there is no way of exporting your metrics in an easily digestible way. So even though you have access to your data, you can’t really play with them.
Don’t worry, there is a solution. 😉
Where can I find my historical Instagram data?
Even though native Instagram solutions can help to some extent, there are other tools that can provide you with more detailed insights and historical Instagram data for much longer time periods. What we are talking here about are external social media analytics apps.
Remember
You need to convert your profile to a business account, in order to get access to more extensive historical data. Also, only after switching to an Instagram business account, you’ll be able to use third-party social media analytics tools.
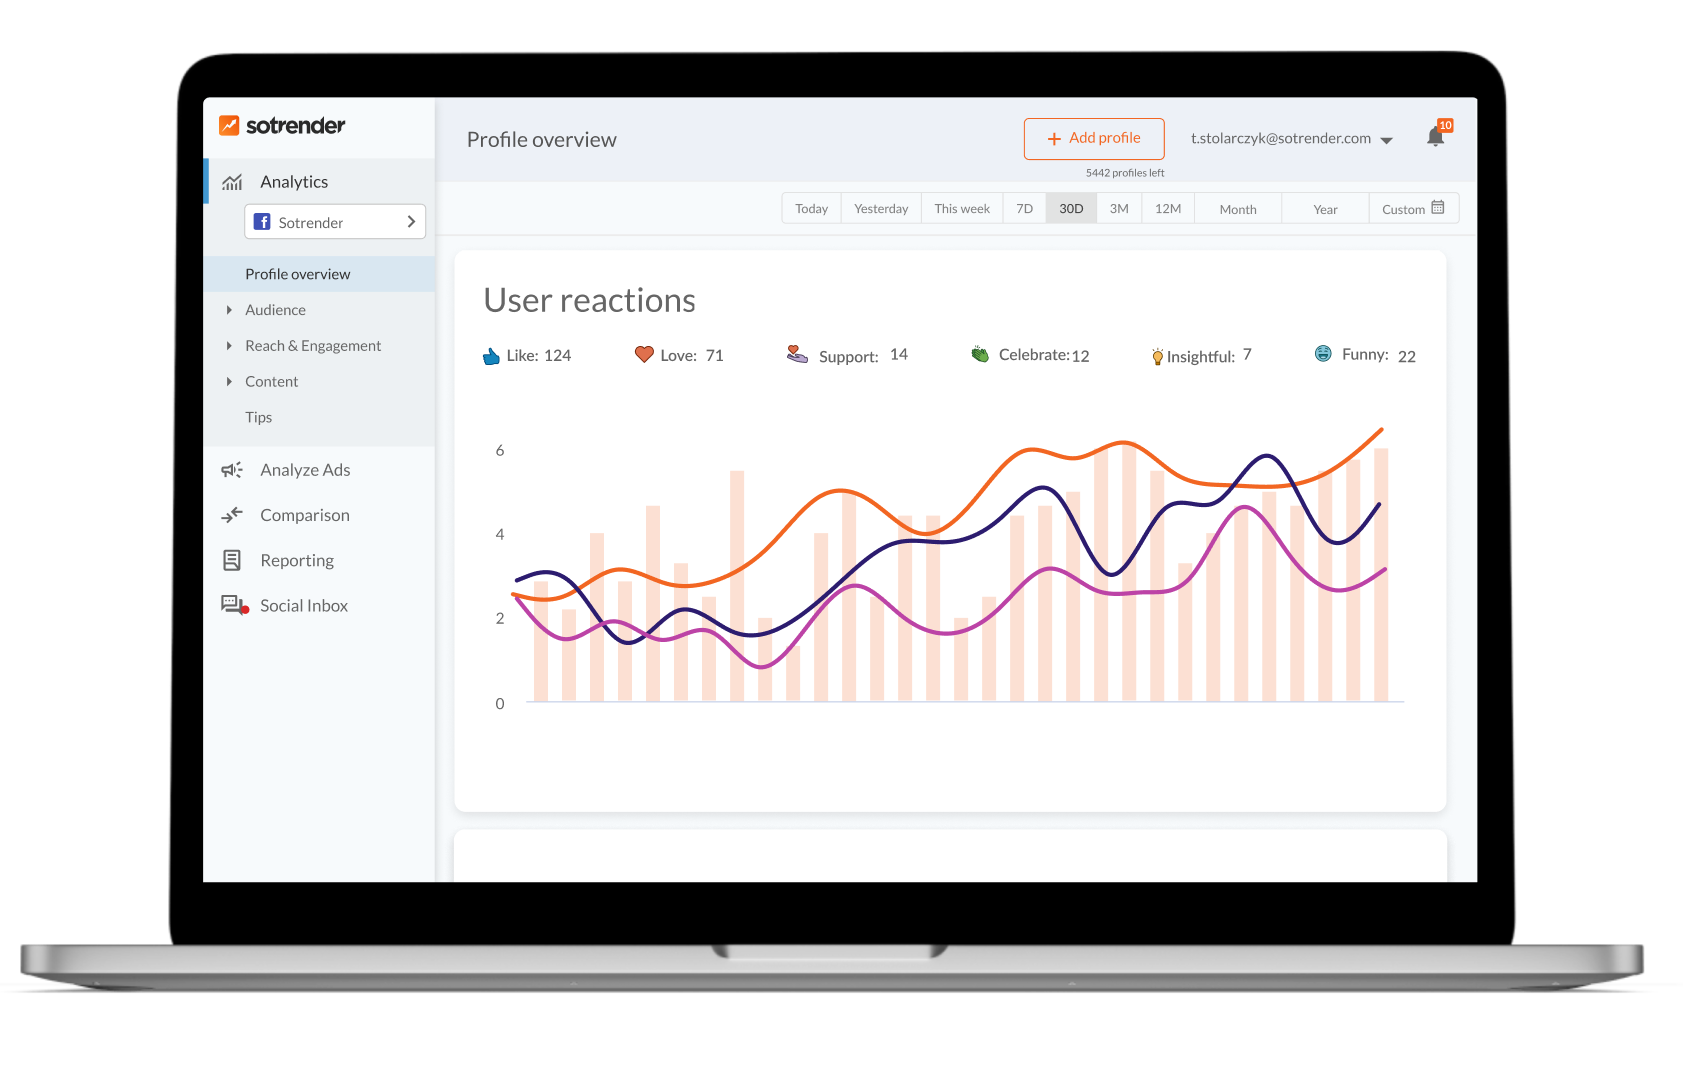
One such tool is Sotrender and here’s how it works there.
Once you connect your profile to Sotrender you’ll automatically get 30 days of historical Instagram data.* From this point on, you can already analyze your performance for the last month. Good enough for a start, right?
*The only exception is data about the increase in the number of followers and followers’ demographics – this is because of the Instagram API limitation, which does not return such data.
This includes detailed demographic data about your followers, which is crucial for understanding your audience and its dynamics.
From the moment you connect your profile to the Sotrender app, we will be collecting your data regularly. That means you can analyze all your data from the moment you started using Sotrender.
For example, if you connected your Instagram profile on January 1st, you can analyze your data and performance from the beginning of the year in the middle of August.
You can also access historical Instagram data on follower changes and engagement metrics.

What kind of data can you analyze then? Well, among many:
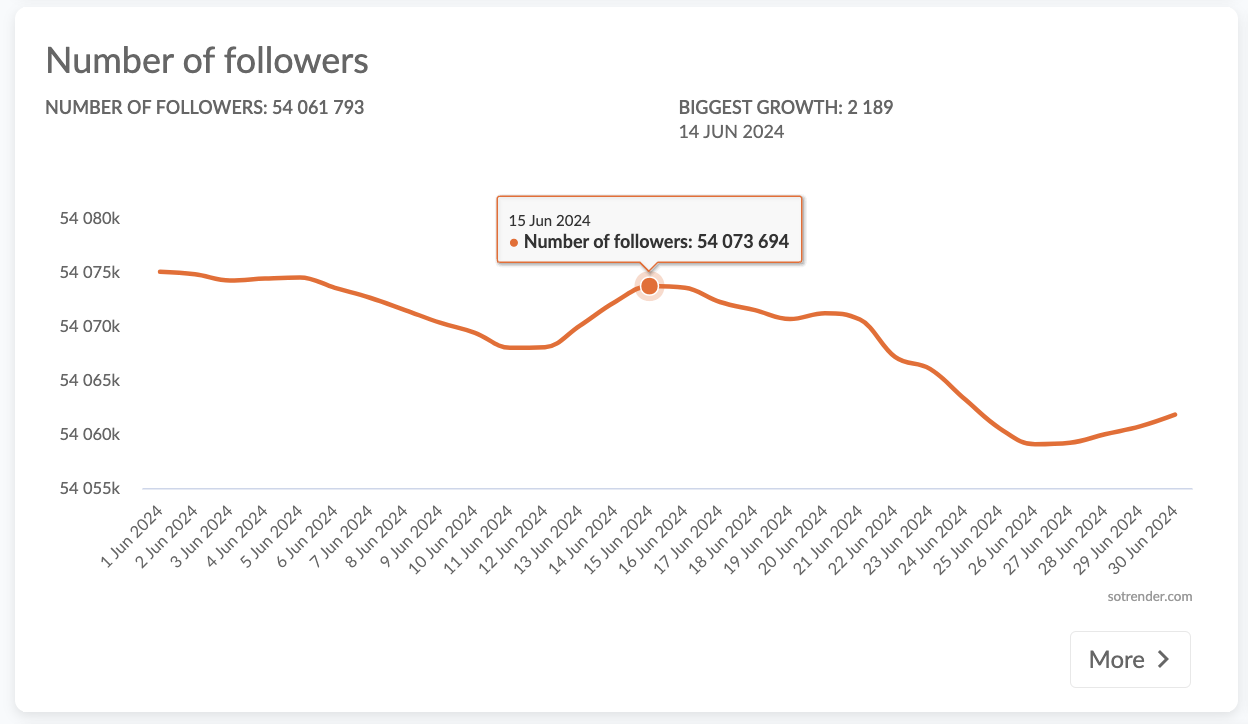
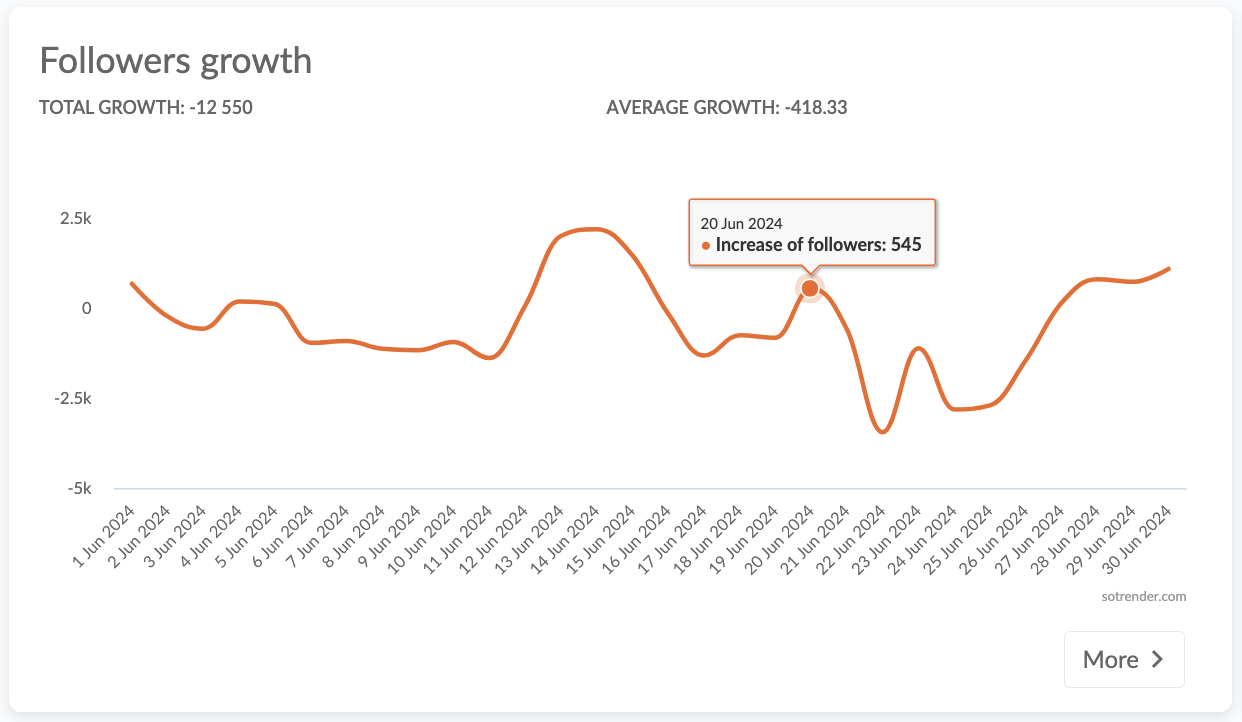
Number of followers, followers growth & growth rate
Basic, yet important metrics to monitor.
You can use it, for example, to:
- assess if your recent campaign was a success or not.
- monitor which content helps you gain followers (or lose them).
- analyze if your brand awareness among the Instagram community is growing.
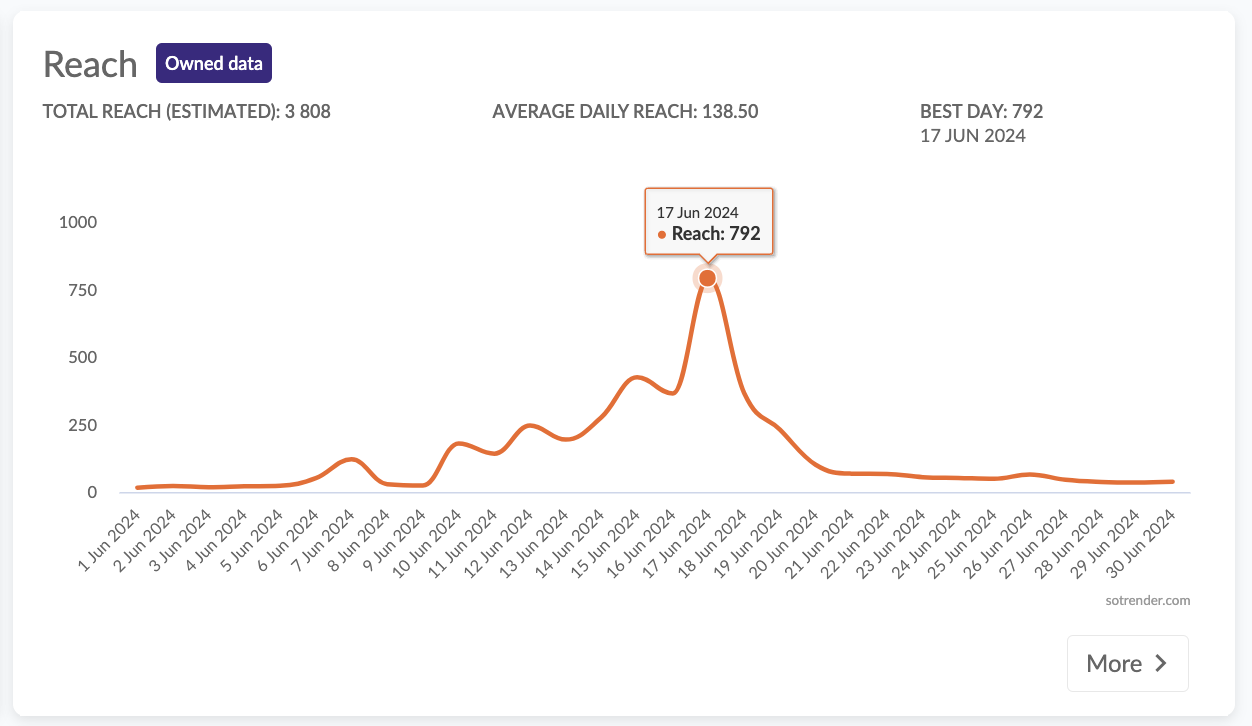
Reach
This metric informs you how many users saw your content in a selected time period. Remember that in reach only unique users are counted (every person will be always counted only once).
You can also analyze impressions, which will tell you how many times your content was viewed. Analyzing impressions helps determine your most interesting content – if the number of impressions is much higher than your reach that means users were willingly watching a specific piece of content again and again. It’s a clear sign they enjoyed it and are likely to come back to see similar content in the future.
In general, the number of impressions will be always bigger than reach.
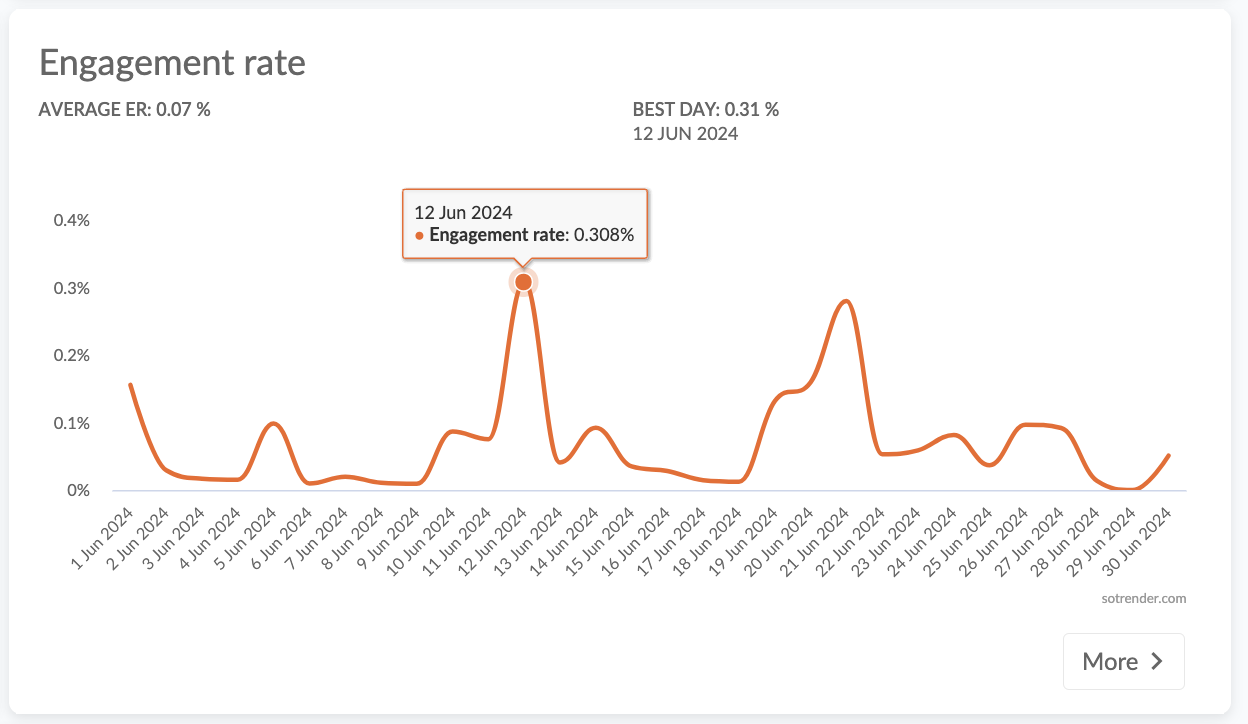
Engagement rate
Would you like to know if your Instagram audience is, in general, interacting with your content? Head to engagement rate metric, which is a market standard for monitoring this.
It’s quite a simple, yet informative metric, counted as the total sum of all users’ actions divided by the number of total followers a profile has, multiplied by 100.
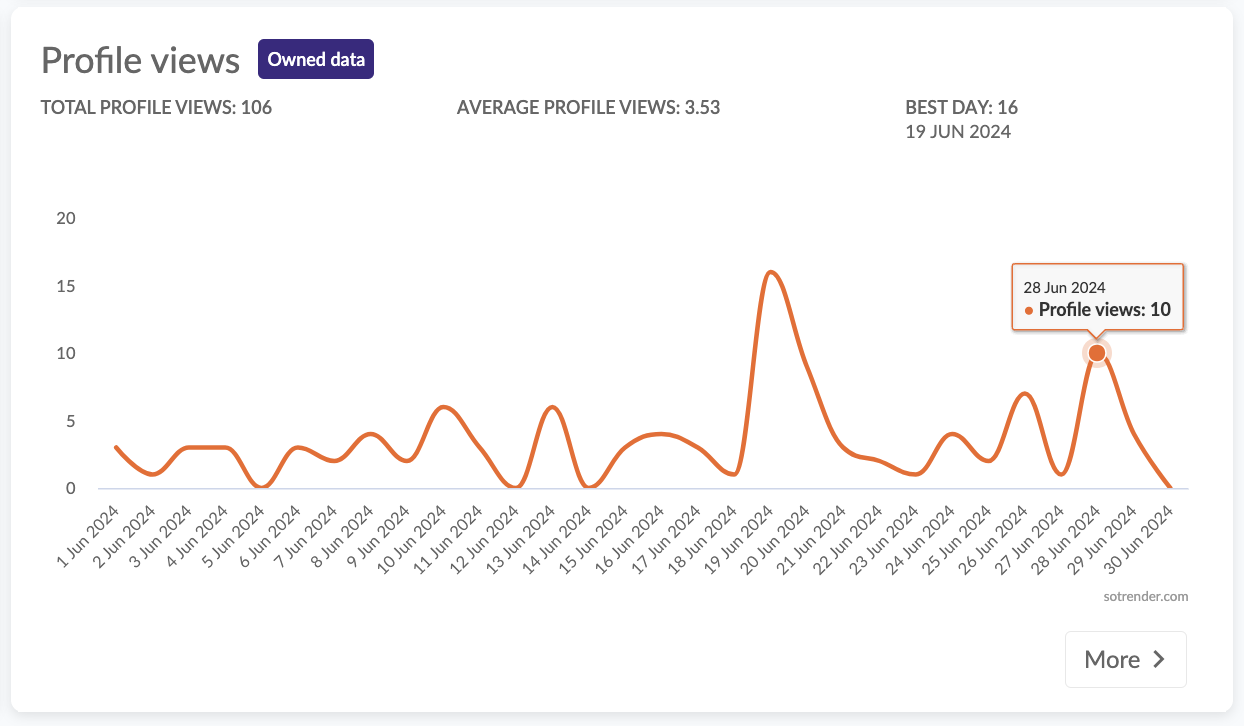
Profile views and profile clicks
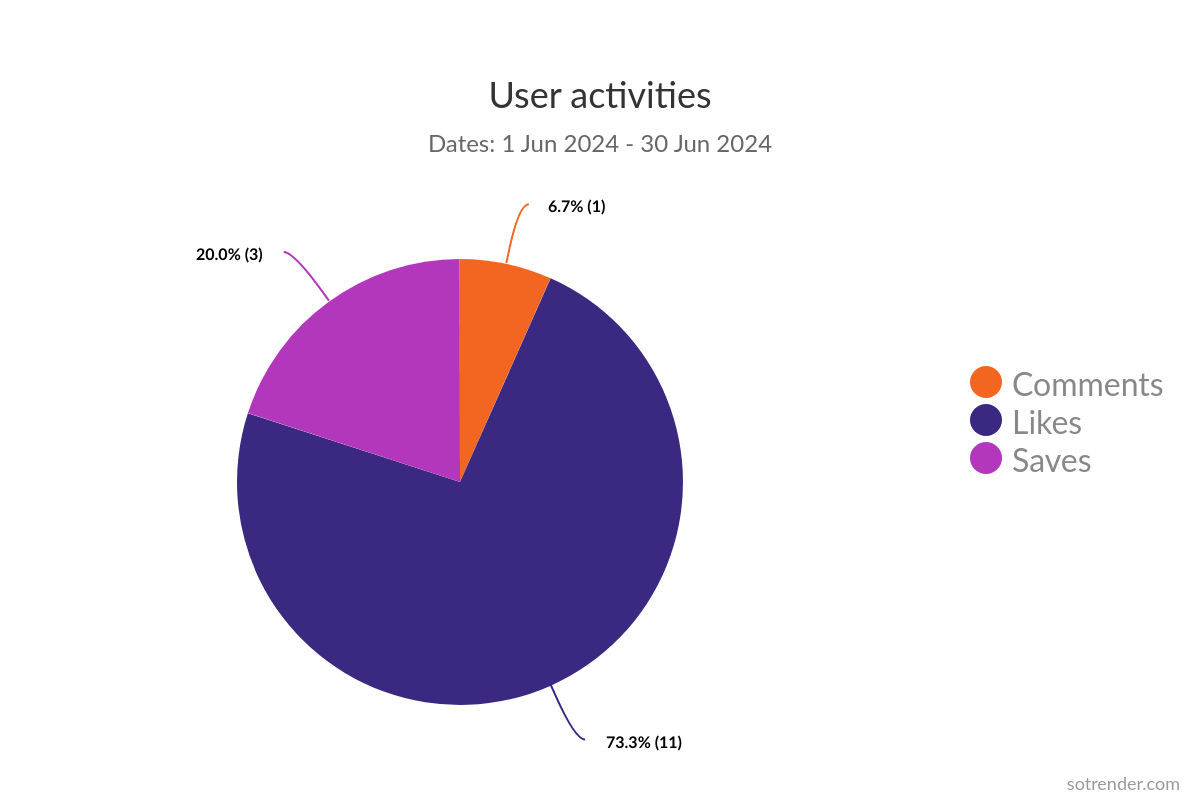
User activities
To build an engaged and loyal fan base, you should be encouraging users to interact with your content in a meaningful way. Analyzing how users are interacting with your content is crucial to understand if the level of engagement is satisfying and brings you closer to achieving your goals.
Usually, marketers should be aiming at getting more comments, shares or saves, than just likes. These types of activities are more meaningful and indicate a closer bond between a follower and a brand.
Content performance
With Sotrender’s content performance chart, you can see how specific post categories were performing. Based on your custom tags you can sort all your content (e.g. by product categories, events, campaigns) and then see which category was the most effective in terms of the number of impressions or engagement.
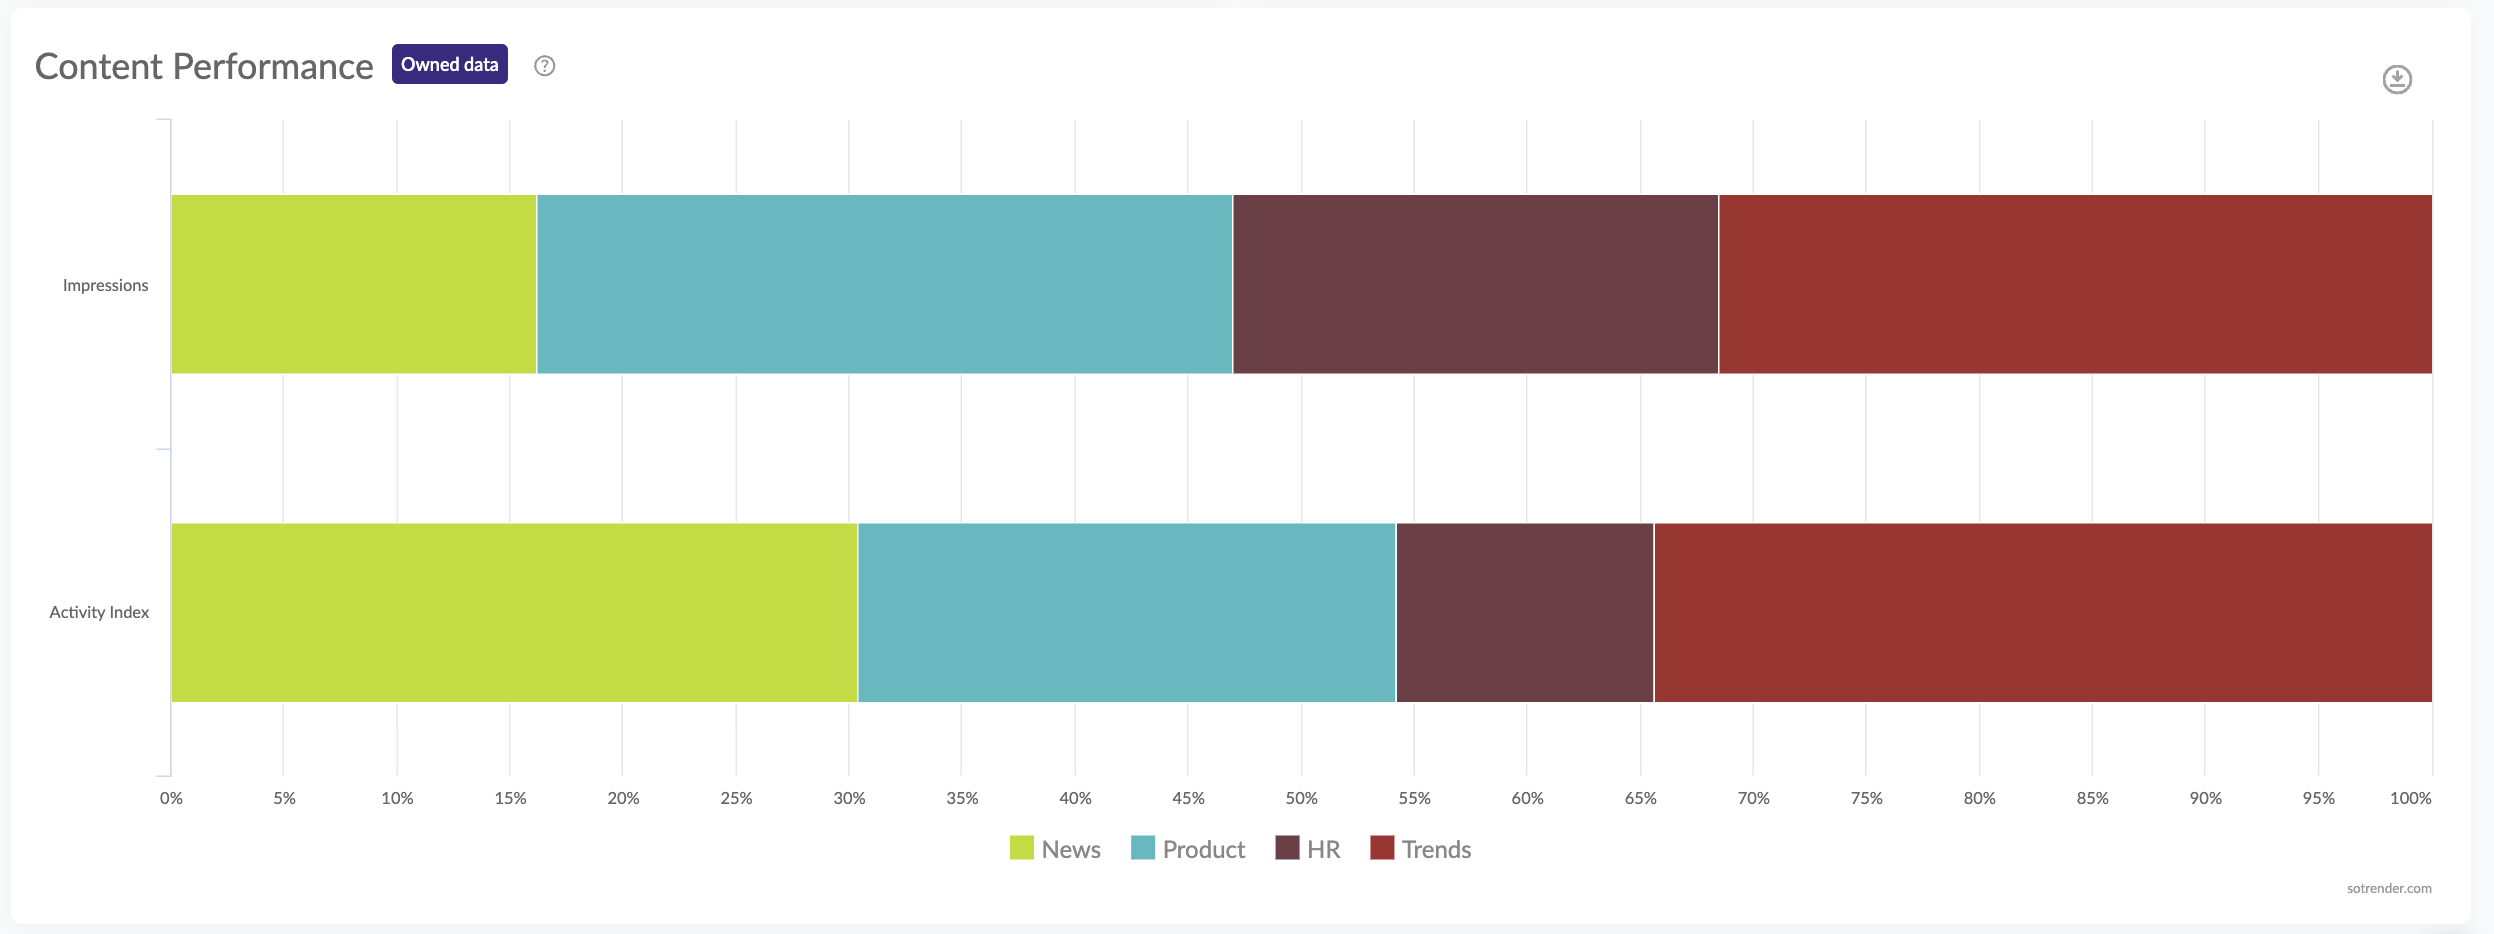
This will help you determine producing what kind of content you should invest in.
Top stories and top posts
So quick and easy but so insightful is the analysis of your top content. See what content was your top-performing one, also in longer time periods, and adjust your future strategy to your audience needs.
In Sotrende, you can sort all your posts and stories according to your needs, e.g. by the number of likes, saves, comments or impressions.
Checking Instagram historical data for competitors’ profile
Keep in mind that not only you can analyze historical data for your own profiles, but also for competitors’ ones. To do so, you’ll need a third-party analytics tool, as in Instagram Insights you’ll only find data regarding your profile and performance.
Basically, you can analyze historical Instagram data for:
- direct competition,
- global players,
- industry leaders in your market,
- influencers (e.g. when looking for influencers for your next campaign),
- brands that inspire you.
You’ll be able to monitor a similar set of data both for your profiles and competitors’ ones. However, there are some data, called insight metrics, that aren’t available publicly. One such metric is, for example, reach.
How to use historical Instagram data to improve my performance?
If you’re not that experienced marketer or Instagram content creator yet, you may wonder what is the benefit of having such Instagram data at hand and how you can use it.
- You know your audience’s interests. By analyzing all the data available, you know what your audience likes to see on your profile. It’s a clear sign of what type of content you should publish more often.
- You know your audience’s online habits. If you know when your audience is using Instagram and when they are interacting with your content, you can plan your content calendar better. By doing so, you’ll have higher chances of popping at the top of users’ feeds.
- You know if your Instagram strategy is right. By monitoring your performance in a longer time frame, you’ll see, for example, if the number of your Instagram followers and follower count is growing or not, and if the content is generally engaging people or not. These variables will tell you if you’re targeting the right audience with the right content.
Also, if you’d like to become an Instagram influencer (we actually have a guide that may help you become one), brands that would like to cooperate with you will be asking you to share Instagram data about your performance. That’s why it’s important to have such data for longer time periods, to prove that you’re consistent and that your numbers (like engagement or followers) are growing and that cooperating with you has potential. Using historical Instagram analytics, you can create comprehensive charts and graphs to visualize your performance trends.
Also, keep in mind that it’s already possible to hide the number of likes our posts get, so brands may have less public data available to analyze your performance. Tracking your Instagram follower count over time is essential for understanding your growth and engagement.
Start taking advantage of your historical Instagram data
Analyzing your historical Instagram data is a powerful way of understanding your performance and identifying your strategy’s weakest points. By looking at your data in the long run, you’ll be equipped with a full set of knowledge that is needed in the process of adjusting your marketing and content plan.
- Analyze your historical Instagram performance
- Benchmark against your competition
- 7-day free trial, no credit card required
Author
Klaudia Żyłka
Marketing Team Lead
Instagram, dogs, books and food lover. Former student at Warsaw University and Malmö University. Improving her marketing skills every day. Proud owner of DIMAQ certificate


