



TikTok released TikTok Next 2026 on January 14, 2026. In its methodology note, the company says it used TikTok One Insight Spotlight and Market Scope, combining paid and organic data. The forecast isn’t the point here. The useful detail is that TikTok explains where the signal came from.
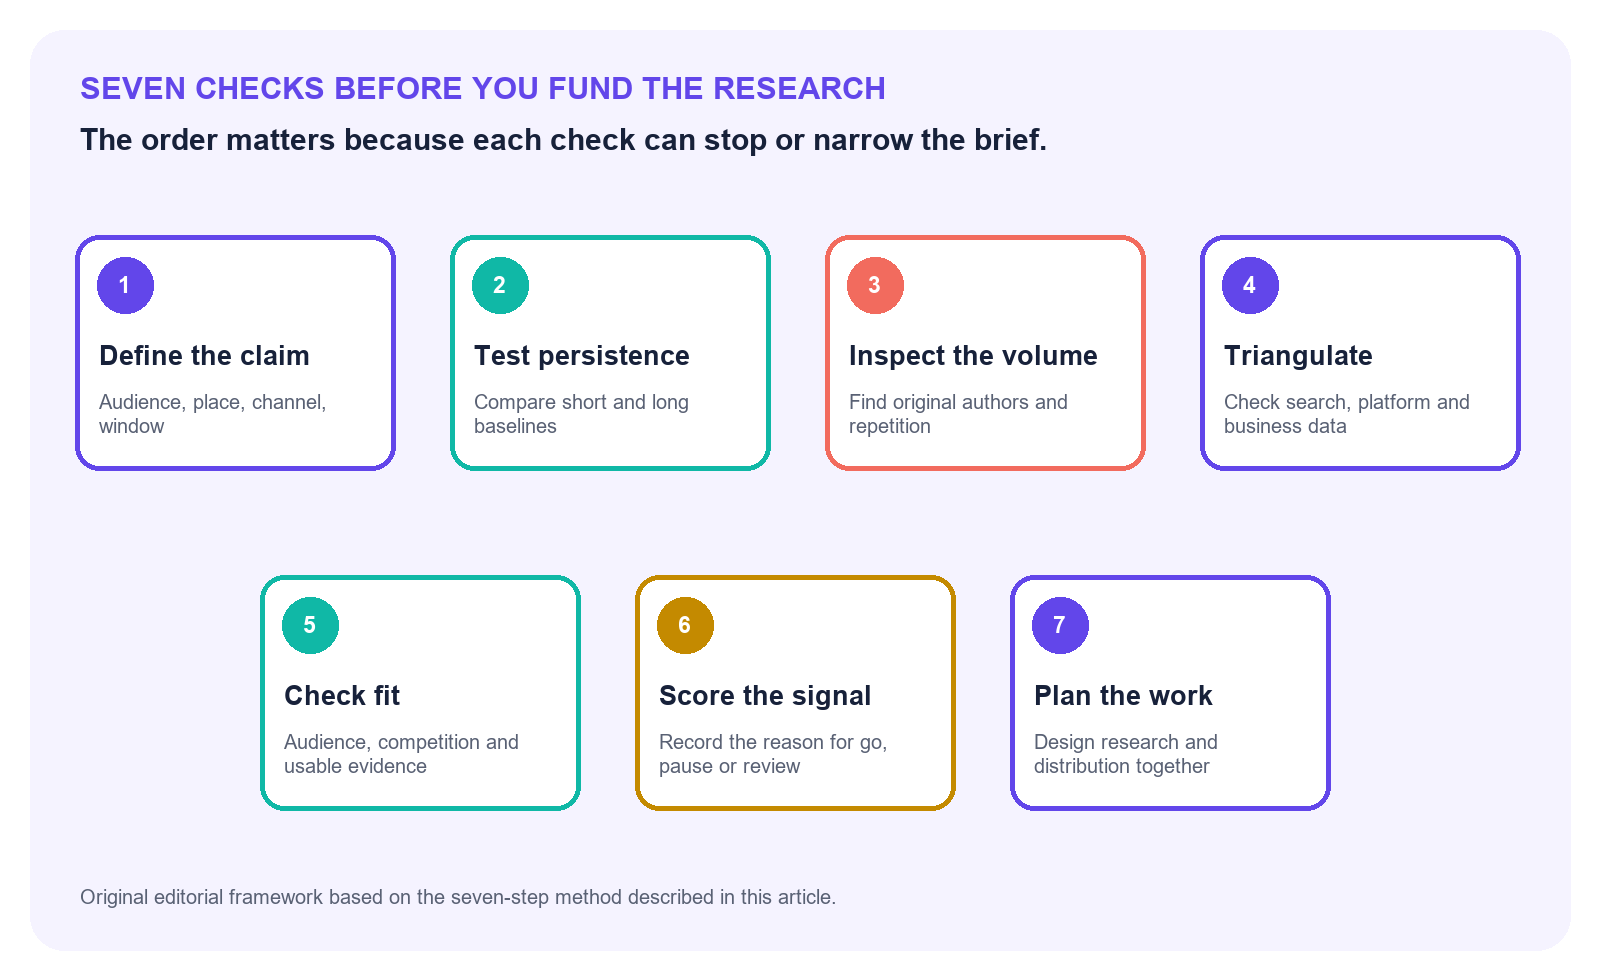
That is the core of social media trend analysis: taking a visible social signal and testing whether it reflects a real, persistent trend or just a temporary spike. For research teams, marketing professionals, social media analysts, and organizations making decisions from platform data, that means defining the claim precisely, checking whether activity persists rather than merely peaks, inspecting who and what is driving the volume, comparing the pattern across platforms and other evidence, and scoring how reliable the signal is before turning it into research.
For a research team, that can look suspiciously like permission to start work. A subject is gaining attention, a major platform has put a name to it, and the charts seem to point in one direction. It feels like the brief has already written itself.
It hasn’t.
The dashboard has shown you something, but it hasn’t written the research brief. Before paying for a survey, booking interviews, or promising a report, the team needs a clearer read on what produced the movement, whether the audience fits the question, how the signal sits in competitive context, whether the evidence is feasible to validate, and whether it survives outside the original feed. Otherwise, weeks of work may end up explaining one creator’s audience, a recommendation change, or a news cycle that was over before fieldwork began.
Nobody needs to prove that a trend is universally real. That’s usually too broad a claim. The useful question is narrower: is this signal sufficiently validated for the decision we’re about to make?
Define the claim before collecting more data
Put the hunch into one sentence. Name who is talking, where, on which channel, and for how long. “People are talking about it everywhere” gives you nothing to test.
Write down the topic, audience, geography, channel, and time window. Each boundary needs to be specific enough to test later. It also states the direction of change. For example:
Negative discussion of AI-generated customer service among US retail consumers increased across at least two independent channels for four consecutive weeks.
That sentence gives the analyst something to test. “People are turning against AI customer service” doesn’t. It leaves the audience, location, starting point, duration, and meaning of “turning against” open to interpretation.
The wording also forces the team to decide what kind of signal it has found. A content spike means more posts or views appeared around a subject. A behavioral shift means people changed what they did. Sentiment shifts describe a change in the tone of conversation, while market demand suggests some form of commercial interest. That distinction changes what you measure. More posts don’t prove that behavior, sentiment, or demand moved with them.
Choose the comparison period before you look at the result. Decide which previous period makes sense, what size of change would justify more work, and how long the movement must last. A seven-day comparison may suit a fast campaign decision. It won’t establish a durable change in category behavior.
Then write down what would weaken the idea. If interest disappears after one creator stops posting, stays inside one community, or fails to show up anywhere beyond views, the team should be willing to pause. A good trend hypothesis includes its own exit door.
Test persistence, not velocity, to identify emerging trends
Fast growth attracts attention because it makes a dramatic chart. The second question is whether it lasts.
Put the current spike beside 30-, 90-, and 365-day views where the data allows it. Thirty days tells you what changed recently. A year shows whether the same shape appears every season, follows a recurring event, or only looks dramatic because the preceding weeks were unusually quiet.
Next, find the trigger. A product launch, celebrity mention, news event, platform feature, paid campaign, or viral post may explain the initial rise. Watch what happens after that trigger loses force. If activity settles at a level above its earlier baseline, the topic may have gained lasting traction. If it falls back at once, the spike still matters as an event, but it shouldn’t be presented as a structural shift.
Repeated windows help here. Instead of asking whether mentions rose on one selected date, compare rolling weekly averages or several consecutive periods. Four modest increases across four weeks usually tell a more useful story than one huge day followed by silence.
Platform mechanics deserve their own check. Recent social media algorithm changes can alter distribution without changing underlying demand. A format may receive more reach because the platform is promoting it, while audience interest remains flat. Pair reach and impressions with a social media engagement analysis that compares responses with the account’s normal performance. Even then, engagement shows reaction to distributed content. It doesn’t prove broader market demand.
Label the pattern honestly. Is it seasonal, episodic, or structural? A seasonal signal may still support timely research. An episodic one may support a fast commentary piece. Structural research needs evidence that outlives the event that created the first chart.
Inspect who and what created the volume with social media analytics
Original editorial framework.
Ten thousand posts can represent ten thousand independent contributions. They can also represent 200 original posts copied, quoted, or reposted dozens of times. The total alone can’t tell you which version you’re looking at.
Now count the people behind the posts. Look at communities, domains, locations, languages, and account types where the dataset allows it. If most of the conversation belongs to a few creators, it may be important to their audience. Keep the claim there until another source shows that it travels.
Look at the content itself. Are accounts sharing the same URL? Does the wording repeat? Do hashtags appear in the same sequence? Are many posts arriving at regular intervals, or within seconds of one another? None of those signs proves automation or coordination by itself. Together, they tell you that raw activity may overstate the number of independent people behind it.
That distinction matters because coordinated campaigns can inflate apparent attention. Scientific Reports researchers studying coordinated link sharing looked at the speed and frequency of posts alongside repeated links, similar content, timing, and account networks. Their work offers a useful warning: a tall activity chart doesn’t tell you how many independent decisions produced it. It’s that analysts should inspect how the volume formed before treating it as spontaneous demand.
Paid creator activity needs similar care. A campaign can generate genuine reach, discussion, and even purchase behavior. Still, it answers a different question from organic adoption. Separate paid, owned, earned, and unknown sources where possible. If the separation isn’t possible, record that limitation rather than blending all activity into one clean story.
Reposts deserve a place in the analysis, but not the same weight as independent creation. One useful approach is to report both total activity and original-author activity. If both rise across a diverse set of communities, the signal is stronger. If only the total rises, investigate further.
Triangulate across platforms, search, business data, and trend analysis
Social data rarely settles the question alone. The next step is to look for directional support from sources produced by different behaviors.
This is where the distinction between social media listening and analytics becomes useful. Listening can show what people are saying beyond an owned account. Analytics can show how content and audiences behave on the accounts a team controls. Neither should be forced to stand in for the other.
Search adds another kind of evidence. According to Google’s explanation of Trends data, Google Trends uses a sample of aggregated, anonymized, and categorized searches from Google and YouTube, which analysts can compare across time, locations, topics, and rising queries. Its values are relative, though. A score of 100 marks peak interest in the selected comparison; it isn’t a search-volume count.
That makes Trends useful for direction, not demand forecasts. If social discussion climbs and related searches rise across several regions, the case gets stronger. If social posts surge while search interest stays flat, there may still be a platform-specific story. The team just shouldn’t describe it as universal curiosity.
Bring in business data when it fits the claim. Website searches can show what existing visitors want. Search Console can reveal whether relevant queries are producing impressions. Customer-support logs may expose repeated questions. Surveys can test recognition or intent with a defined sample. Sales data can show whether attention reaches a commercial outcome.
The curves don’t need to match. In fact, identical movement would be unusual because each source measures a different behavior. Look for compatible direction and timing, then explain the differences. A search rise may lag behind social conversation. Support questions may appear only after people try a product. Sales may never move at all.
TikTok itself used several evidence streams for its forecast. Its account of the TikTok Next 2026 methodology describes first-party tools that combine paid and organic data to study audience behavior, content performance, and market trends. That doesn’t make every forecast certain. It does show why a named trend should rest on more than a view count.
Cross-channel agreement doesn’t prove causation, representativeness, purchase intent, or future growth. It gives the team a better basis for deciding whether the question deserves research.
Check target audience fit, competitive context, and evidence availability
A signal can be valid and still be wrong for the publication, brand, or customer group considering it.
Return to the audience in the claim. Are the people generating the signal the people the eventual research needs to describe? A surge among marketing professionals can’t support conclusions about consumers without another source. Heavy discussion in one country doesn’t automatically travel to another. If the audience fit is weak, either narrow the research or choose a different topic.
Then inspect the competitive context. Search for recent studies, datasets, reports, and articles that make the same claim. The purpose isn’t only to avoid duplication. The search also shows where the old work falls short. That gap is the only good reason to pay for another study.
So ask what the finished piece will tell readers that they can’t get now. Perhaps the team can reach a population earlier work missed, update old data, make a comparison nobody has tested, or use information that isn’t public. “Our version” isn’t enough.
Finally, test feasibility before approval. Can the team reach the right sample? Is there historical data for a comparison? Can it define the audience and screen respondents? Are the proposed demographic cuts large enough to interpret responsibly? Does the team have permission to use the data?
Evidence availability can kill a good idea, and that’s useful information. It is cheaper to discover that during validation than after a survey has been fielded.
Score the signal and make a go-or-no-go decision
The final call is subjective. Write down the reasoning anyway, so the next meeting doesn’t start from zero.
Use a 0–2 scale:
- Persistence: 0 means the spike vanished. 1 means it’s too early to call. 2 means it held up against the relevant baselines.
- Source diversity: Give it 0 when a handful of accounts or repeated posts drive the volume, 1 when there is some independent participation, and 2 when relevant groups are contributing broadly.
- Cross-channel support: Score 0 when other sources push against the claim, 1 when the picture is mixed or missing, and 2 when independent evidence points in the same general direction.
- Audience fit: A 0 means the people behind the signal are the wrong population. 1 means some overlap. Use 2 when the people in the data closely match the research audience.
- Business relevance: 0 if nobody will act on the answer. 1 if it may inform later work. 2 if it changes a decision already on the table.
- Differentiation: 0 if the answer is already published. 1 if this adds a useful slice. 2 if readers would get a genuinely new finding.
- Evidence feasibility: 0 if the team can’t test the claim properly. 1 if access or sample quality is doubtful. 2 if the data and sample are available.
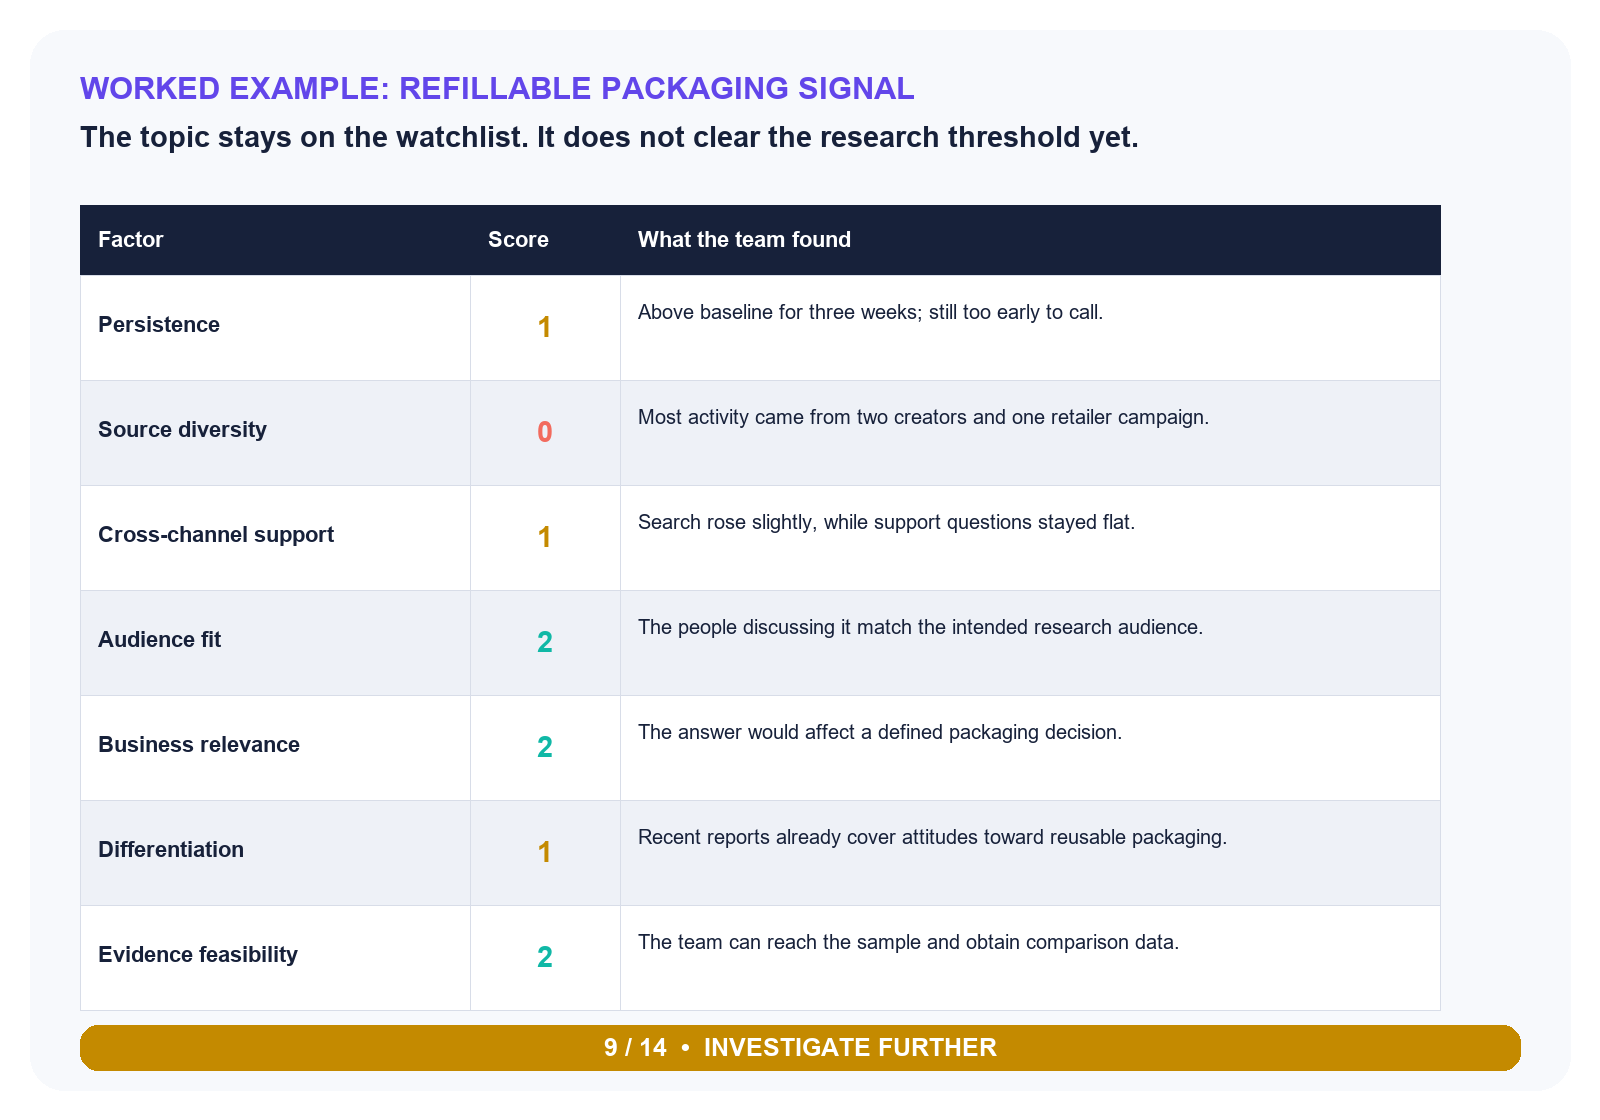
The 9/14 result calls for more investigation rather than commissioning the research now.
As an editorial rule, a score of 10 or more out of 14 can justify moving to a brief, provided there is no zero for audience fit, evidence feasibility, or source integrity. Scores from 7 to 9 call for more investigation. Below 7, pause the idea. These thresholds aren’t a statistical standard. They’re a decision aid, and teams should adjust them to the cost and risk of the proposed research.
Consider a packaging company that notices a burst of posts about refillable containers. The topic stays above baseline for three weeks, but most activity traces back to two creators and one retailer campaign. Search interest has edged up, but customer-support questions haven’t.
The scores are 1, 0, 1, 2, 2, 1 and 2. That’s 9 out of 14. Keep watching. A sensible next move would be another month of monitoring or a small round of interviews focused on the gap between online attention and actual reuse.
Record the score, evidence date, decision owner, caveats, and next review date. Otherwise, the team may reopen the same debate two weeks later using a different chart.
Design the research and distribution plan together
Once a signal passes the validation threshold, the research plan and distribution plan should be developed together. A campaign built around a digital skills survey offers one practical example: the research asset was paired with a defined publication audience, an outreach process, and repeated testing of the pitches. Before fieldwork begins, decide which charts editors could use, which limitations must accompany the data, and who would find the result useful.
Define the claims the data may support, the audience that will care, the formats editors can use, and the limitations that must travel with every chart. If the distribution plan depends on a stronger claim than the method can test, revise the plan or the method before collection begins.
Virality isn’t validity
The right order is simple: define the claim, test persistence, inspect the source of the volume, triangulate the evidence, check fit and feasibility, then score the decision. A social spike may become a strong research idea. It earns that status through validation, not velocity.


