Instagram’s growth hasn’t slowed down. With around 3 billion monthly active users and hundreds of millions business accounts competing for attention, ad costs have risen 20-30% year-over-year. Smart optimization isn’t a luxury anymore—it’s survival.
So what exactly is Instagram competitors analysis? It’s systematically comparing your account against others using key metrics like engagement rate, reach, content formats, and posting habits. Instead of guessing why your competitor’s Reels blow up while yours fall flat, you dig into the data.
This article walks through how to do Instagram competitors analysis in 5 clear steps. Each step covers what to look at, how to measure it, and how analytics platforms like Sotrender can streamline the process. Let’s get into it.
Key Takeaways
- Instagram now has around 3 billion monthly active users, with 90% following at least one business account—making structured competitor analysis essential for standing out, not optional.
- The 5 steps to effective Instagram competitive analysis: (1) identify the right competitors, (2) collect reliable data, (3) benchmark KPIs, (4) analyze content and audience patterns, (5) turn insights into strategy and experiments.
- Compare your account against 5–15 relevant rivals (mix of brands and creators) over at least 30–90 days to spot real patterns instead of one-off viral spikes.
- Using a dedicated competitor analysis tool like Sotrender dramatically speeds up tracking, benchmarking, and reporting versus time consuming manual spreadsheets.
- The ultimate goal isn’t copying posts—it’s building a differentiated, data-informed instagram strategy that drives actual business outcomes like leads, sales, and sign-ups.
- 7 days for free
- No credit card required
- Access to all premium features during trial
Step 1: Identify the Right Instagram Competitors
Here’s where most people trip up: they only track direct product rivals. But “right competitors” means any account competing for the same audience attention in your niche—not just brands selling identical products.
Finding direct competitors:
- Same or similar products/services
- Same geography and price tier
- Search Instagram keywords and niche hashtags (#veganskincare has 500k+ posts monthly, #b2bmarketing pulls 1.2M)
- Use Instagram’s “Similar accounts” suggestions in the explore tab
Finding indirect competitors: These are publishers, creators, and influencers who address the same customer need through different angles. A SaaS CRM company should track not just other CRMs, but also sales training influencers who command higher engagement through educational Reels. They’re capturing your target audience’s attention—that makes them competition.
Building your list: Start with 10–20 accounts, then narrow to 5–15 that match your follower count range and audience demographics. Benchmarking against Nike’s 300M+ followers when you have 15K followers won’t give you realistic targets.
Tag each competitor in a spreadsheet or inside Sotrender by type:
- Direct competitors
- Indirect competitors
- Aspirational accounts (industry leaders you want to learn from)
Segment by region or vertical to keep your competitive landscape organized.
Step 2: Collect Reliable Competitor Data
One week of data tells you almost nothing. A viral Reel or product launch can inflate metrics by 50-100%, skewing your entire analysis. You need at least 30 days of data collection—ideally 90—to smooth out anomalies and spot real patterns.
Core metrics to collect for each competitor:
| Metric | What to Track |
|---|---|
| Followers | Total count and follower growth rate |
| Posts | Number published in time frame |
| Engagement rate | (Likes + comments + saves + shares) / followers |
| Content mix | Breakdown of Reels, carousels, photos, Stories |
| Hashtags | Which tags they use, how many per post |
| Posting schedule | Days and times with highest activity |
| Profile elements | Bio links, CTAs, highlight covers |
You can gather some of this manually from public profiles. But once you’re analyzing competitors across multiple markets and tracking essential Instagram analytics metrics? Manual tracking becomes error-prone and time consuming.
Tools like Sotrender automatically pull daily data, backfill historical metrics, and standardize engagement rate calculations across all profiles you’re tracking. No more spreadsheet chaos.
What about paid campaigns?
You can’t see competitors performance in Ads Manager directly. But you can infer paid activity through:
- Meta Ad Library scans for dark posts
- Sudden reach/engagement spikes exceeding organic baselines by 3x
- Creative volume changes (competitors average 10-20% boosted content)
Concrete example: Brand A (skincare niche): 45 posts in 30 days, 60–70% Reels, ~0.5–1.2% average ER depending on size, posting frequency concentrated Tue–Thu 6–9 PM local time. Hashtag #veganskincare continues to outperform broad tags in niche engagement. This is the kind of detailed insights that drive real decisions.
Step 3: Benchmark KPIs and Set Your Own Targets
Here’s the thing about targets: most are pulled from thin air. “Let’s grow followers 10% this month” sounds nice, but compared to what? Competitive benchmarking gives you realistic KPIs based on what’s actually achievable in your niche.
Key KPIs to benchmark:
| KPI | How to Calculate | Industry Benchmark |
|---|---|---|
| Follower growth rate | (End followers – Start followers) / Start followers × 100 | ~3–10% monthly for small accounts, ~1–5% for mid-sized |
| Engagement rate per post | Total interactions / Followers × 100 | ~0.4–0.8% average (median ~0.48%) |
| Posting frequency | Posts per week | Top accounts: 3–7x weekly |
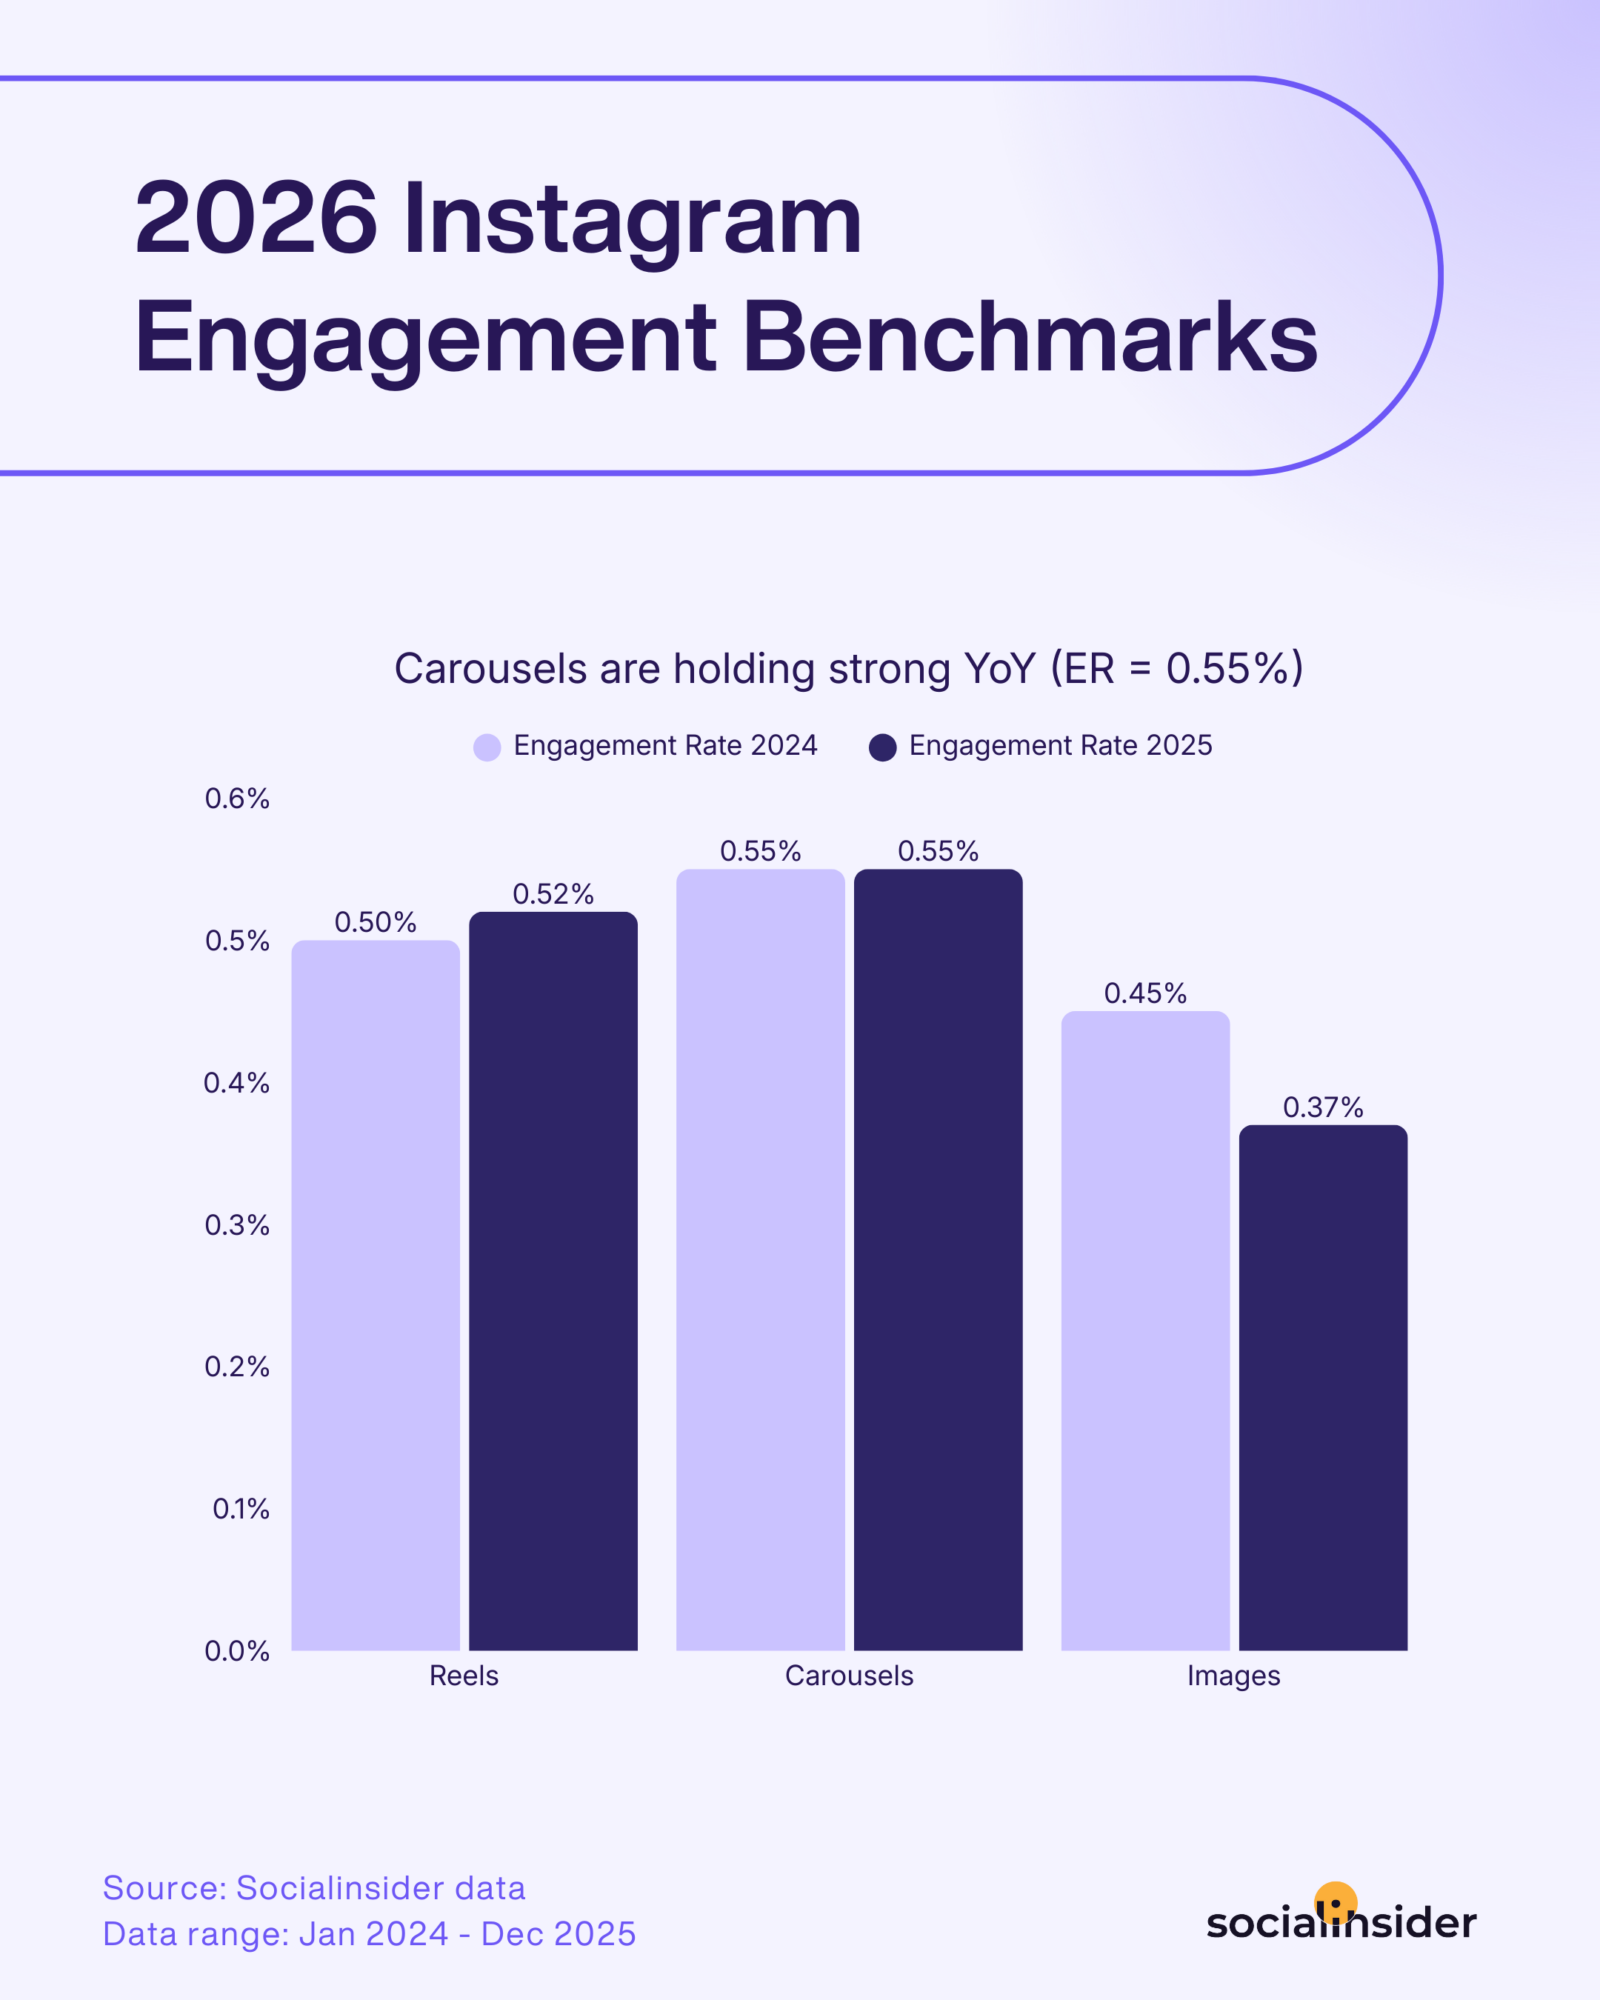
| Reel share | Reels / Total posts × 100 | 50–70% for many brands in 2025–2026 |
Spotting gaps and opportunities:
Compare metrics side by side. Maybe you’re posting 6x weekly with 1.8% ER, while competitors hit 2.5% ER on just 4 posts. That signals content quality over posting frequency as your priority.
Or maybe your instagram engagement rate outperforms 70% of peers on Reels but lags 40% on Stories. Now you know where to focus.
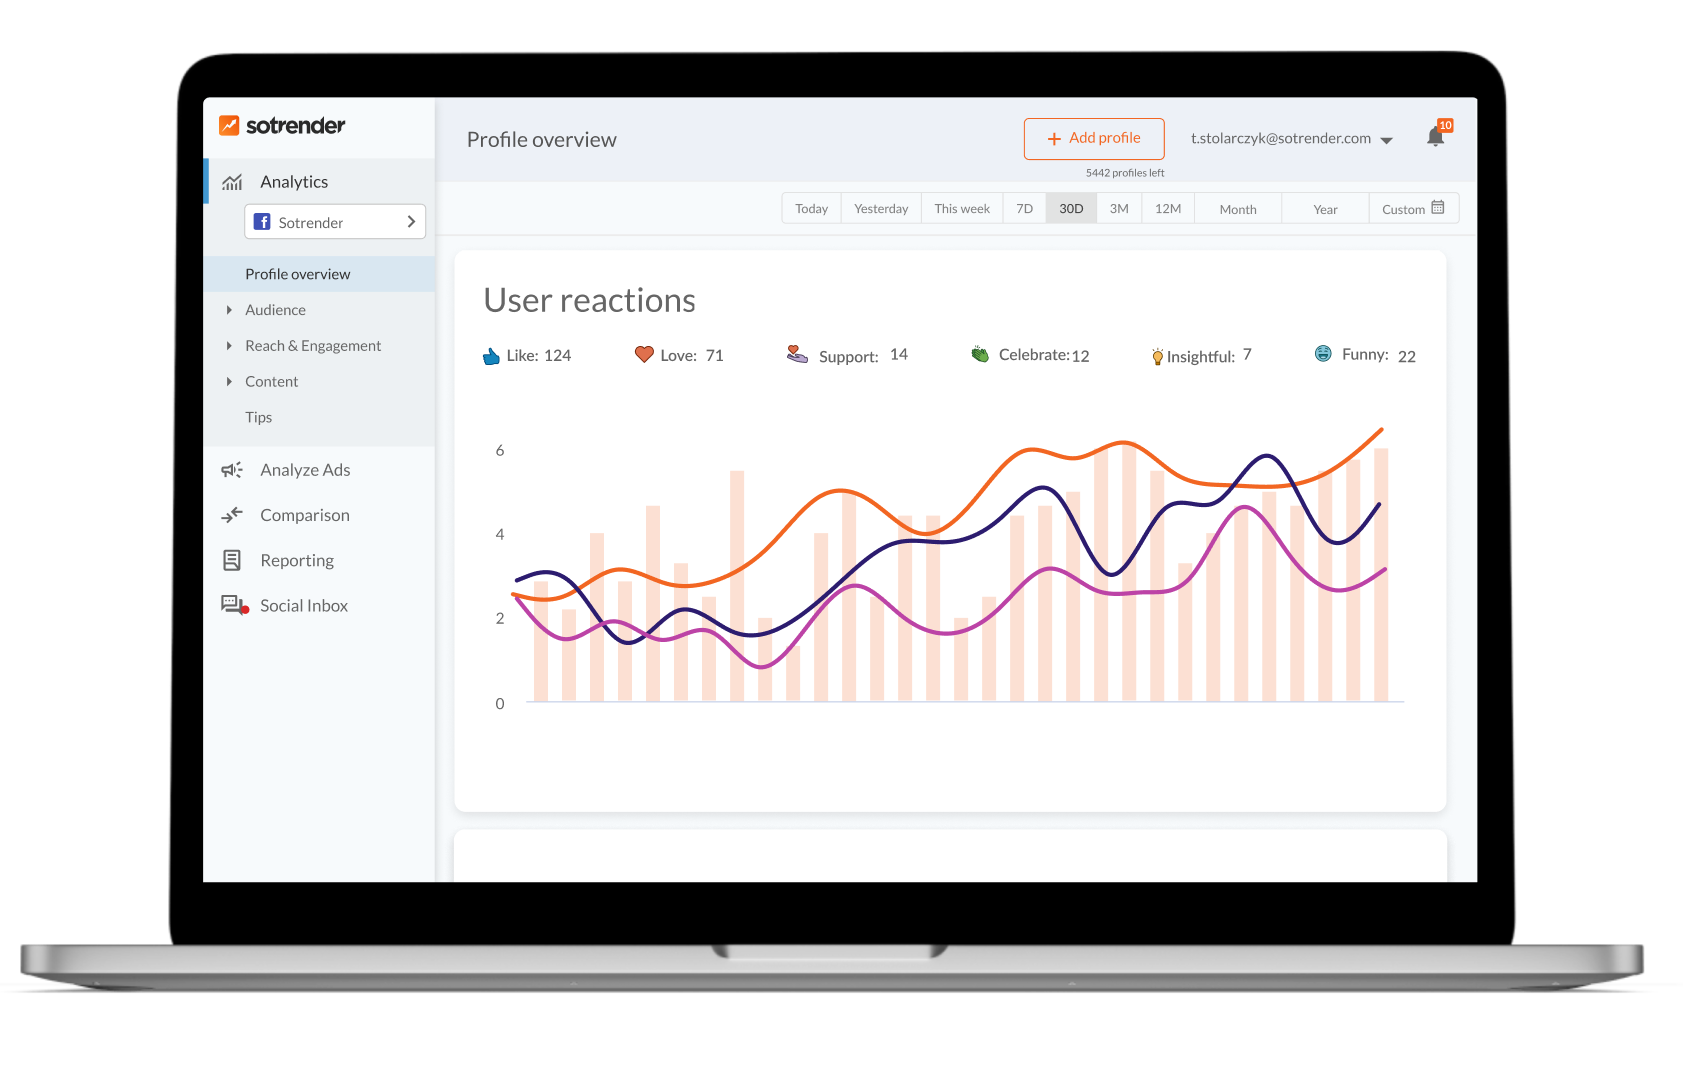
Sotrender’s benchmarking features make this visual: multi-profile charts rank 10+ accounts on growth and engagement, auto-calculate industry benchmarks, and show percentile rankings. Instead of drowning in numbers, you get a clear picture of market position for stakeholders.
Step 4: Analyze Content, Audience, and Engagement Patterns
Metrics tell you what’s happening. Content analysis tells you why.
Numbers alone won’t reveal why a competitor’s educational Reel hit 50K views while your polished brand video got 2K. You need to dig into the content itself.
Analyzing top performing posts:
Pull the highest and lowest-performing competitor posts from your time frame. For each, note:
- Content type (Reel, carousel, image)
- Topic and hook (first line or opening 3 seconds)
- Visual style and content quality
- Caption length and CTA used
- Audio (trending sounds boost views 40%)
High-ER Reels typically feature hooks in the first 3 seconds, short captions under 100 characters, and strong CTAs like “DM for discount.” Low performers often rely on static images with vague messaging.
Mining audience insights from comments:
Comment sections are goldmines. Look for:
- Recurring questions (“Does this work on sensitive skin?”)
- Objections about pricing or features
- Language patterns your audience preferences reveal
These highlight content gaps 60% of competitors ignore. Address them, and you differentiate.
Mapping posting patterns:
Which days and times do competitors post most? When do their posts get highest audience interaction? Sotrender’s heatmaps visualize this automatically—no manual logging required. Mid-week evenings (Tue–Thu) still tend to show stronger engagement patterns across many industries.
Stories and Reels focus:
Instagram’s algorithm prioritizes short-form video—Reels account for up to 50% of time spent on platform. Track competitors’ Reel frequency (3-5 weekly is optimal), length (15-30 seconds), use of native stickers, and trending hashtags. Daily Stories with polls drive 2x replies compared to static content.
Step 5: Turn Insights into Strategy, Experiments, and Reporting
Analysis without action is just expensive procrastination.
The goal isn’t a one-off static report gathering dust in your Google Drive. It’s transforming insights into concrete changes in your social media strategy.
Identifying opportunities:
List 3–5 specific opportunities your analysis revealed:
- Underused content formats competitors ignore
- Topics with high audience interest but low competitor coverage
- Posting times when engagement is high but feed is quiet (identify trends like 10 AM slots with 30% less competition)
- Trending topics your competitors haven’t touched
Designing experiments:
Translate each opportunity into a testable hypothesis:
| Opportunity | Experiment | Success KPI |
|---|---|---|
| Competitors underuse educational content | Publish 3 educational Reels weekly for 4 weeks | 25% higher ER vs. current average |
| Low competition at 10 AM | Schedule posts for 10 AM Tue-Thu for 30 days | 15% reach increase |
| Audience asks about pricing | Create pricing comparison carousel | Track profile visits and bio link clicks |
Building competitive reports:
Your stakeholders don’t need 47-page data dumps. They need:
- Executive summary (2-3 key findings)
- Visual charts showing growth curves vs. competitors, engagement ranking, content mix breakdown
- Prioritized action list for next quarter
Sotrender automates recurring competitive reports—weekly or monthly pdf reports with white-label options for agencies. No more manual screenshots or spreadsheet exports. Agencies report 50% faster client deliverables using automated reporting.
Tools and Tactics to Make Instagram Competitors Analysis Easier
Let’s be honest: serious competitive benchmarking falls apart once you’re tracking more than a handful of accounts across multiple markets. Manual methods don’t scale.
How Sotrender helps:
Connect your Instagram Business account (plus Facebook, TikTok, LinkedIn) and add competitors’ profiles. You get unified dashboards showing organic metrics and paid performance where accessible—all in one place.
Practical features for competitor analysis:
- Comparison charts across multiple profiles
- Best-time-to-post recommendations based on engagement signals (+18% uplift potential)
- Top content lists ranked by instagram performance
- Hashtag performance and trending hashtags insights
- Campaign-level views for paid social optimization
For agencies specifically:
Sotrender’s automated, white-label custom reports are built for client communication. Show clients their benchmark performance vs. competitors every week or month without manual effort. Real time insights updated daily in the background.
Ready to see your competitive landscape?
Start a 7-day free trial (completely free, no credit card) or book a demo to see real competitor data for your instagram profile using the last weeks and months of activity.
FAQ: Instagram Competitors Analysis
How often should I repeat an Instagram competitors analysis?
A full deep-dive analysis works best quarterly—90 days gives you enough data to see real patterns beyond seasonal spikes. Monthly, run lighter check-ins covering key metrics, top performing posts changes, and any new followers or new features from competitors. Tools like Sotrender update data daily in the background, so you always have fresh numbers when you need them.
How many Instagram competitors should I track at once?
5–15 competitors hits the sweet spot. Fewer than 5 and you won’t see meaningful patterns; more than 15 and the insights become noisy. Split them into direct competitors (same products), indirect competitors (same audience, different offerings), and aspirational accounts (industry leaders). This structure keeps your analysis focused while covering the full competitive landscape.
Can small brands really learn from much bigger Instagram accounts?
Absolutely—for content ideas, positioning, and marketing strategies. Studying how Sprout Social or other industry leaders structure their Reels gives you creative direction. But don’t use their metrics as your benchmarks. Their growth rates, budgets, and audience size aren’t comparable to a 15K-follower account. Treat big players as inspiration for content strategy, not numeric targets.
What’s the difference between Instagram competitors analysis and social listening?
Instagram competitor analysis focuses on specific accounts and their social media performance—follower growth, engagement rate, content mix, posting schedule. Social listening focuses on conversations and mentions around brands, products, and market trends across social platforms. Competitor analysis asks “how is this account performing?” Social listening asks “what are people saying about this brand?” Sotrender bridges both by combining competitor benchmarking with profile and influencer monitoring.
How do I show the business impact of Instagram competitor analysis to my boss or client?
Tie every recommendation to measurable goals: engagement rate uplift, more profile visits, increased bio link clicks, new followers from specific campaigns. Use before/after competitive reports showing your own performance gains relative to competitors over 1–3 months. Data driven decisions backed by competitor benchmarks are far more convincing than “this is what we think will work.” Sotrender’s compare metrics features make it easy to visualize progress and stay ahead of rivals in stakeholder presentations.


