
Instagram analytics are performance measurement tools that provide data points revealing how your Instagram account and content perform over time. These systematic tracking capabilities help social media managers, marketing teams, and agencies understand what drives growth and engagement on the platform.
This guide covers the essential Instagram metrics you need to monitor, the tools available for tracking performance, implementation strategies for setting up analytics, and solutions to common measurement challenges. The target audience includes social media professionals managing business accounts, agencies handling multiple clients, and marketing teams seeking to improve their Instagram efforts through data driven decisions.
Instagram analytics help businesses track follower growth, engagement rate, reach, impressions, and audience demographics to optimize their social media strategy. Understanding which content resonates with your audience through Instagram analytics can lead to more targeted and successful marketing campaigns, ultimately improving ROI.
By the end of this guide, you will:
- Understand the core Instagram metrics that matter for business growth
- Know how to choose between native and third party tools for analytics
- Learn how to implement effective tracking systems and reporting dashboards
- Solve common measurement challenges like limited historical data
- Build actionable insights from raw performance numbers
- 7 days for free
- No credit card required
- Access to all premium features during trial
Understanding Instagram Analytics
Instagram analytics refers to the systematic measurement and interpretation of performance data generated by posts, Stories, Reels, and profile activity. This data provides a solid foundation for understanding how your content strategy performs and where adjustments can drive better results. For businesses, analytics matter because they connect Instagram activity directly to marketing ROI and business outcomes.
Types of Instagram Analytics Data
Quantitative metrics form the backbone of Instagram performance measurement. These include basic metrics like follower count, which shows how many users follow your account, helping gauge growth and identify when your strategy is effective or slipping. Likes, comments, impressions, and reach are the numbers that tell you how visible and engaging your content is to your audience.
These numbers aren’t just vanity statistics—they drive business decisions and strategy optimization. Tracking Instagram metrics allows marketers to diagnose what isn’t working in their campaigns and adjust strategies accordingly, leading to more effective marketing efforts. When you understand which individual posts generate the most engagement, you can replicate successful approaches across multiple posts.
Performance vs Audience Analytics
Performance analytics focus on how your content performs: post engagement, story views, video completion rates, and action-based metrics. This data shows whether your publishing schedule and content strategy are generating results. Story Completion Rate, for example, measures the percentage of users who watch an entire story without skipping, helping assess content effectiveness.
Audience analytics deal with who engages with your content. Audience Demographics include breakdowns of followers’ age ranges, gender, and geographical locations. This category also covers audience behavior patterns—what content types they engage with, when they’re most active, and their interests. Active Hours data from Instagram Insights shows when followers are most active by day and hour, informing optimal posting times for maximum engagement. You can use this information to schedule content releases to align with peak audience activity, maximizing engagement and reach.
Understanding both performance and audience analytics creates a complete picture of your Instagram performance, setting the stage for tracking specific key metrics.
Key Instagram Analytics Metrics to Track
Building on the foundational understanding of analytics types, businesses should monitor three main categories of Instagram metrics: account growth, engagement performance, and content performance. An Instagram analytics dashboard centralizes these key metrics, providing a comprehensive view of performance that helps identify trends and opportunities for optimization.
Account Growth Metrics
Total followers is a key metric that shows how many users follow your account, helping gauge growth and identify when your strategy is effective or slipping. However, raw follower count alone doesn’t tell the full story.
Follower Growth Rate tracks how quickly you’re gaining or losing followers and helps identify if your content strategy is effective. This metric reveals momentum—a stalling growth rate combined with dropping engagement might signal content misalignment with potential followers. Reach indicates how many unique accounts have seen your content at least once, serving as a key indicator of brand awareness and exposure. Reach to non-followers is especially valuable because it shows successful content discovery.
Engagement Performance Metrics
Engagement rate tracks how many people interact with your content (likes, saves, shares, comments) compared to how many people viewed it, and a high engagement rate increases visibility in the algorithm. This single metric often provides the clearest picture of content effectiveness.
Saves and Shares are high-value engagement signals; a save indicates long-term value, while a share expands reach to new audiences. In 2026, Instagram’s algorithm weights DM shares as the strongest signal, followed by saves, watch time, and profile visits. High profile visits and saves suggest the audience has significant interest in the brand, indicating potential conversion intent. Action-Based Metrics include Profile Visits, Website Clicks, and Follows earned from specific posts.
Content Performance Metrics
Impressions tell you the total number of times your content was displayed, including multiple views by the same account. When combined with reach data, you can understand how often users return to view your content.
Content Preference analysis compares engagement rates across different formats, helping to determine which type of content resonates most with the audience. Video completion rates for Reels matter significantly—content that maintains high completion rates (50-80%+) receives algorithmic rewards in distribution. Post analytics across different formats help identify your top performing posts and inform future content creation.
Key metric categories summary:
- Account growth metrics track audience size and expansion velocity
- Engagement metrics reveal content value and audience connection
- Content performance metrics show which formats and topics work best
Understanding these metrics creates the foundation for selecting appropriate tools to track them effectively.
Tools and Methods for Instagram Analytics
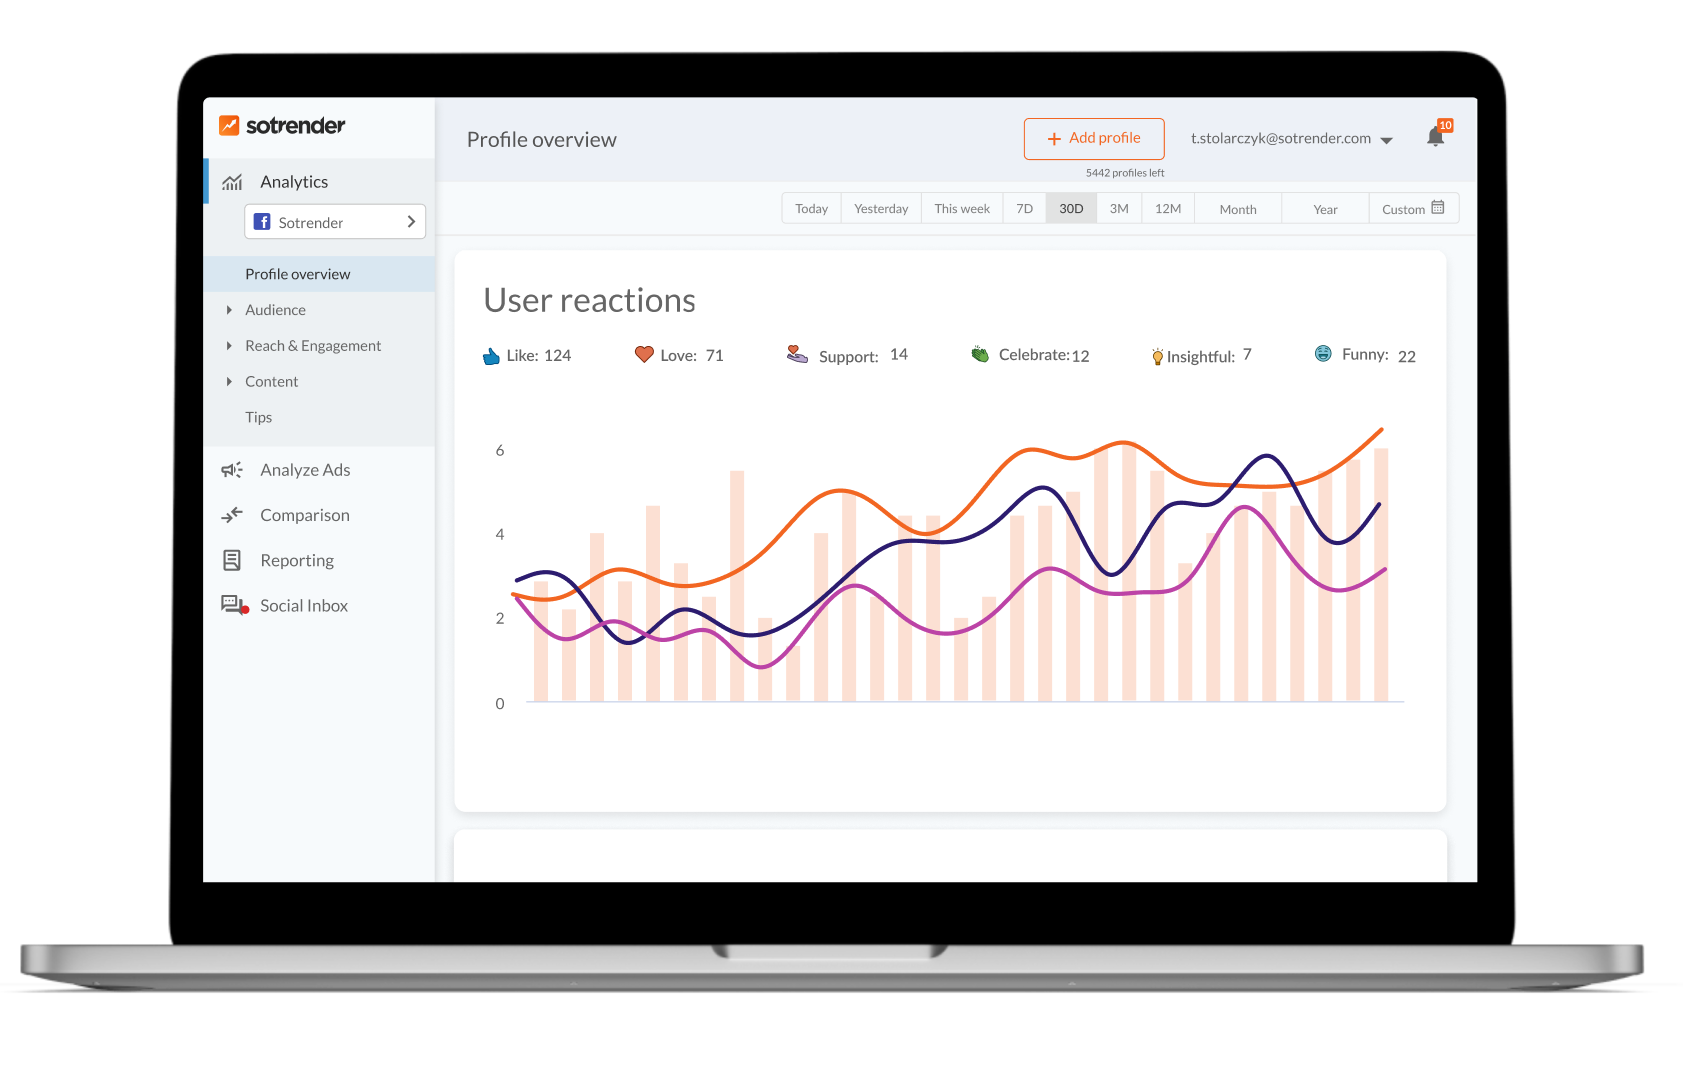
With a clear understanding of key Instagram metrics, the next step involves implementing tracking systems using the right tool approaches. Instagram’s built-in analytics tool, known as ‘Insights’, is a free resource for any creator or business account, providing a solid foundation for understanding account performance. However, the choice between native and third party tools depends on your specific needs.
Setting Up Instagram Analytics Tracking
Before diving into tool selection, businesses need systematic analytics tracking in place. Here’s how to establish your tracking infrastructure:
- Convert to Professional Account: Instagram Insights requires a Professional (Business or Creator) account to access analytics features. This is the essential first step that gives users gain access to native insights.
- Define KPI Goals: Establish key performance indicators aligned with business objectives—whether that’s awareness (reach), engagement (saves, shares), or conversion (profile visits, link clicks).
- Choose Tracking Tools: Select tools based on whether you need basic metrics from native insights or advanced features like competitor benchmarking and campaign tracking from third party tools such as Sotrender, which offers comprehensive Instagram analytics capabilities tailored for small businesses, content creators, and agencies.
- Set Up Reporting Schedule: Create a consistent reporting rhythm—weekly check-ins to spot engagement trends and sudden spikes, monthly deep dives for strategic planning, and quarterly reviews for broader content strategy adjustments.
Native vs Third-Party Analytics Comparison
| Criterion | Instagram Insights | Third-Party Tools (e.g., Sotrender) |
|---|---|---|
| Data Depth | Basic metrics (reach, impressions, demographics) | Detailed metrics including hashtag performance, follower demographics, optimal posting times, and scheduling posts |
| Historical Access | Limited to 90-day date range | Extended or unlimited historical data |
| Competitor Analysis | Not available | Benchmarking against industry standards and competitors |
| Export Capabilities | Limited export options | White labeled reports, automated dashboards, CSV/PDF exports |
| Cross-Channel | Instagram only | Integration with other social media platforms |
| Cost | Free with professional account | Subscription-based pricing |
Instagram Insights has significant limitations, including a data retention cap of 90 days, which makes long-term trend analysis impossible. Third-party analytics tools like Sotrender offer more granular metrics, such as hashtag performance analysis and optimal posting time recommendations based on historical data, allowing for a more in-depth analysis of content strategy.
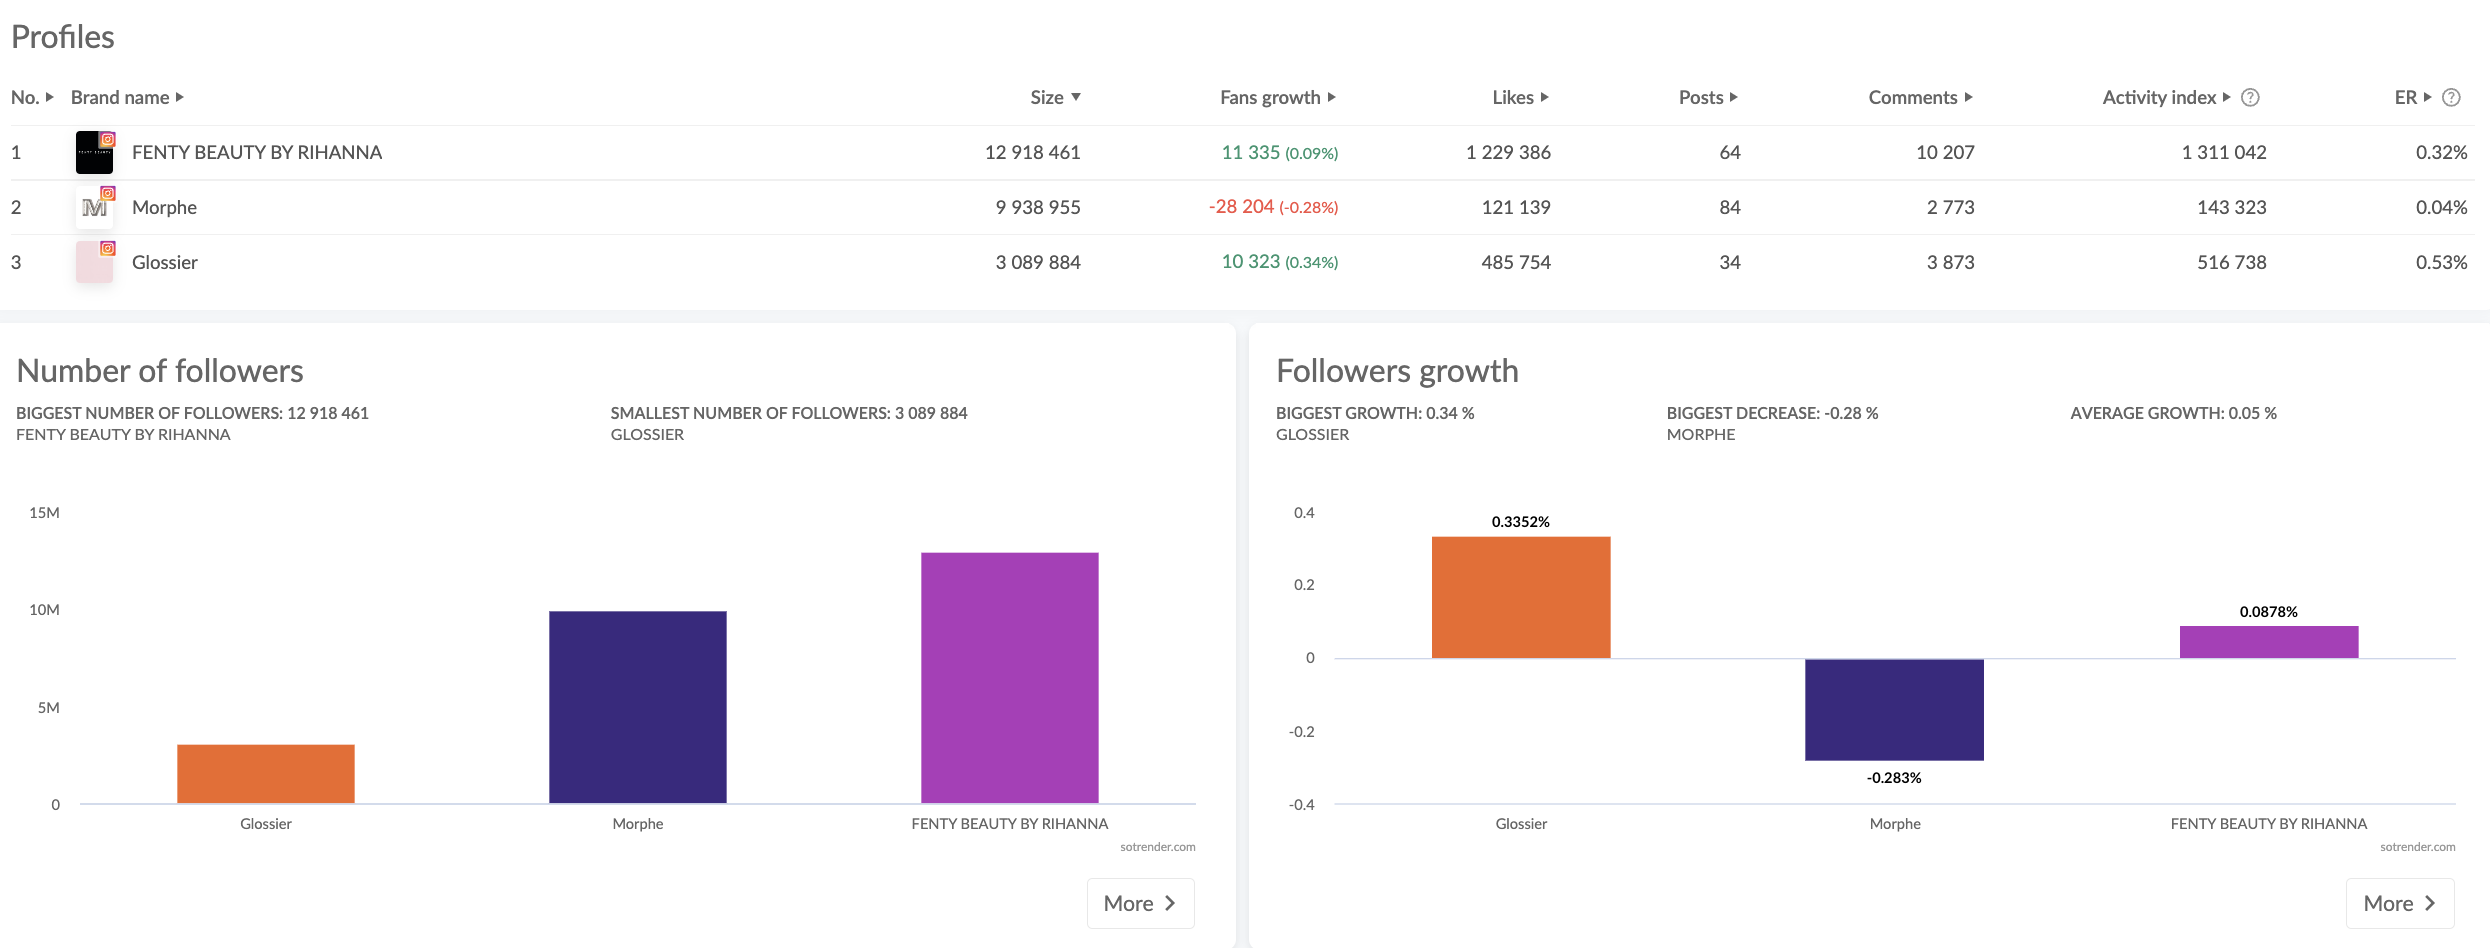
Third-party analytics tools enable competitor analysis and benchmarking, allowing brands to monitor their competitors’ follower growth and engagement rates, which helps in measuring performance against industry standards. Using third-party analytics tools can also facilitate cross-channel reporting, integrating Instagram data with metrics from other marketing channels, providing a unified view of overall marketing performance.
For agencies and teams managing multiple accounts, the ability to schedule content according to optimal posting times, track progress across campaigns, and generate white labeled reports makes third-party tools like Sotrender essential for maximizing engagement and reach. Many teams also benefit from shared calendars and features that save time on manual reporting tasks.
The choice between native and third-party solutions often comes down to your need for real time data versus historical analysis and whether competitor benchmarking matters for your strategy. Understanding these tradeoffs helps navigate common analytics challenges.
Common Challenges and Solutions
Even with the right tools selected, Instagram analytics implementation faces several obstacles. When analyzing audience engagement on Instagram, it’s crucial to assess changes in content strategy, posting frequency, and audience behavior to identify potential causes for fluctuations in reach or impressions.
Limited Historical Data Access
Instagram’s 90-day data retention makes tracking long-term trends impossible through native insights alone. This gap prevents year-over-year comparisons and campaign effectiveness measurement over extended periods.
Unlike Instagram’s 90-day data retention limit, many third-party analytics platforms like Sotrender offer extended or unlimited access to historical data, which is crucial for tracking long-term trends and campaign effectiveness. Tools like Sotrender begin collecting and storing data from the moment you connect your account, preserving metrics that would otherwise be lost. This historical data enables seasonal analysis, helps identify latest trends, and supports strategic planning based on past performance patterns.
Lack of Competitor Benchmarking
Native Instagram Insights offers no direct competitor or industry averages, leaving brands without context for whether their performance is strong or weak relative to their market. A 2% engagement rate might be excellent in one industry but below average in another.
Third-party analytics tools like Sotrender provide industry benchmarks and competitor tracking through the official Instagram API and aggregated data. This allows you to compare your engagement rate against similar accounts, understand where you stand within your vertical, and set realistic goals. For example, nano accounts (1K-10K followers) average 4-6% engagement rates, while mid-tier accounts (50K-500K) typically see 1-2.5%—context that’s impossible to get from native analytics alone.
Manual Reporting and Data Export
Creating reports manually from the Instagram app is time-consuming and error-prone. Native export capabilities are limited, and combining organic and paid performance data requires significant effort. External factors such as seasonality, trending topics, or increased competition can significantly impact audience engagement and should be considered when analyzing performance metrics.
Automation solves this challenge through scheduled reports, white labeled reports for client presentations, and dashboards that update in real time. Third-party tools like Sotrender can generate formatted reports covering specific posts or entire campaign performance, with visually appealing charts and clear communication of results. To effectively analyze audience engagement, marketers should compare engagement and reach across similar periods and review reach by content type to pinpoint patterns and make informed adjustments to their strategy.
These solutions address the primary obstacles to using Instagram analytics effectively, setting the stage for consistent implementation.
Conclusion and Next Steps
Effective Instagram analytics require the right combination of metrics understanding, appropriate tools, and consistent tracking approaches. The metrics themselves aren’t just numbers—they’re signals that inform content strategy, reveal audience interests, and drive business decisions. Whether using native Instagram Insights for basic metrics or third-party tools like Sotrender for advanced features, the goal remains turning raw data into actionable insights that drives growth.
Immediate next steps:
- Audit your current analytics setup—confirm you have a professional account and identify gaps in your tracking
- Define the key metrics most relevant to your business goals (awareness, engagement, or conversion-focused)
- Select an appropriate analytics platform based on your needs for historical data, competitor benchmarking, and reporting automation—consider Sotrender for comprehensive capabilities tailored to small businesses and content creators
- Create a regular reporting schedule with weekly quick checks and monthly strategic reviews
- Establish benchmark targets using industry averages and your own historical performance
For teams seeking deeper measurement capabilities, related topics include Instagram advertising analytics (connecting paid and organic performance), cross-platform social media measurement (unified reporting across channels), and social listening tools for broader brand monitoring.
Additional Resources
For technical implementation details, Meta’s Instagram Graph API documentation provides specifications for data access through the official Instagram api. Understanding platform-specific metric definitions helps ensure accurate interpretation of analytics data across different tools.
Complementary resources for expanding your analytics capabilities include competitive benchmarking guides that provide context for your engagement rate and follower growth relative to industry standards. Cross-platform social media performance measurement resources help connect Instagram efforts to broader marketing campaigns and demonstrate overall campaign effectiveness to stakeholders.


