
Social media analytics reports are comprehensive documents that transform raw social media data from platforms like Facebook, Instagram, LinkedIn, and X (formerly Twitter) into actionable insights that drive business decisions. These reports compile performance metrics, audience demographics, and campaign data into structured formats that reveal what’s working, what’s not, and where to focus your social media efforts next.
This guide covers everything you need to know about creating social media reports that matter—from selecting key metrics and building effective templates to establishing reporting frequency and avoiding common pitfalls. We focus specifically on the reporting process itself rather than general social media management or content creation strategies. Whether you’re a marketing manager presenting to executives, a social media manager tracking multiple platforms, or a business owner demonstrating ROI to stakeholders, this resource will help you build reports that inform strategy and prove value.
By the end of this guide, you will:
- Understand the fundamental components that make social media reports effective
- Master the selection of key social media metrics aligned with business goals
- Follow a step-by-step process for creating stakeholder-ready reports
- Avoid common reporting mistakes that undermine credibility and impact
- 7 days for free
- No credit card required
- Access to all premium features
Understanding Social Media Analytics Reports
Social media analytics reports are systematic compilations of performance data that translate complex metrics into business-relevant insights. Rather than presenting raw numbers from individual social platforms, effective reports synthesize all this data into narratives that answer critical questions: Are our social media campaigns reaching the right target audience? Is our content strategy driving engagement? How do our social media efforts contribute to business outcomes?
These reports prove essential for demonstrating social media marketing ROI, optimizing content and posting strategies, and making data-driven decisions about budget allocation across social media channels. Without structured reporting, marketing teams operate on assumptions rather than evidence.
Essential Components of Effective Reports
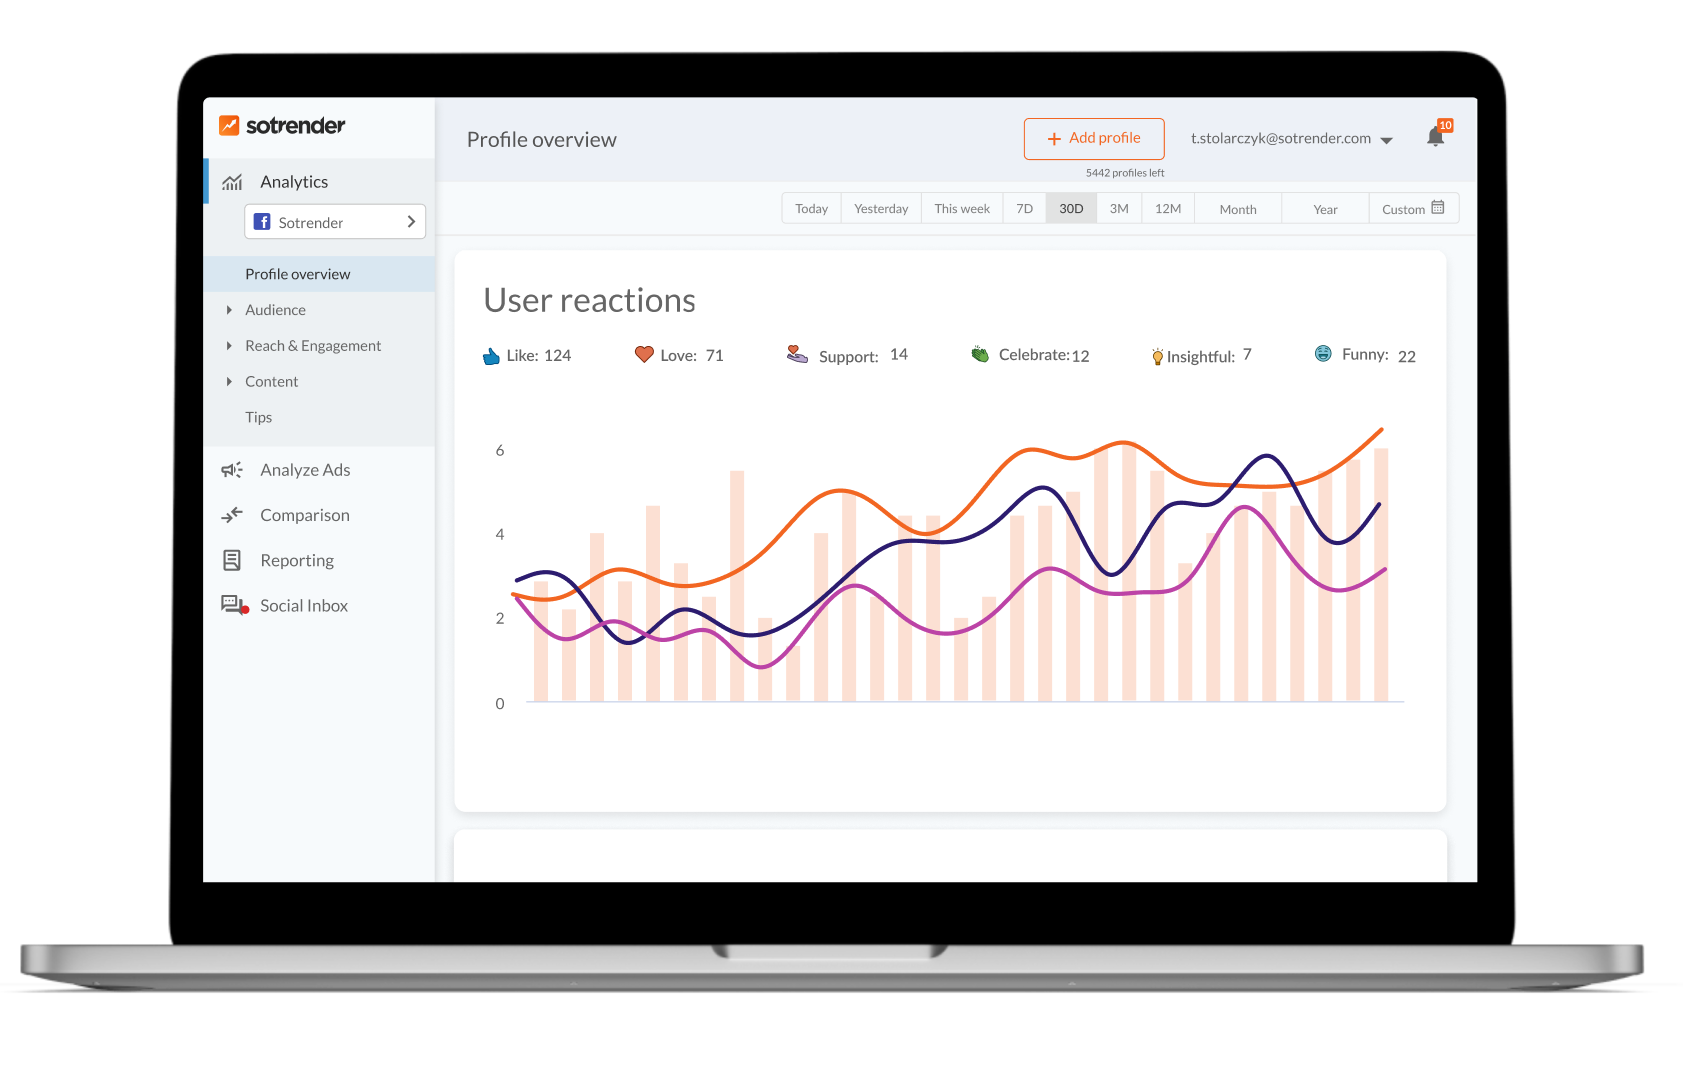
Core report elements work together to tell a complete performance story. An executive summary provides high-level key insights for busy stakeholders. A metrics dashboard displays performance data visually for quick comprehension. Performance analysis sections dig into specific platforms, campaigns, or content types, such as how to analyze Instagram post performance. Actionable recommendations translate findings into next steps for social media teams.
These components connect isolated data points into strategic intelligence. A spike in engagement rate means little without context—did it come from a viral post unlikely to repeat, or from a content approach worth replicating? Effective reports provide this context through analysis rather than data dumps.
Data Sources and Integration
Primary data sources include native analytics from social media platforms—Meta Business Suite for Facebook and Instagram, LinkedIn Analytics, YouTube Overview Report data, and X Analytics. Third-party tools like Sotrender aggregate data across platforms. Google Analytics tracks social media traffic to your website and conversion paths.
Integrated data provides more comprehensive insights than single-platform reporting. When you can compare performance across social channels within the same period, identify trends in audience behavior, and connect social activity to website conversions, your reports become genuinely strategic. This data foundation determines which key metrics you can reliably track and report.
Essential Metrics and KPIs for Social Media Analytics Reports
Selecting the right metrics separates valuable insights from vanity metrics that look impressive but don’t inform decisions. Your social media objectives should drive metric selection—brand awareness campaigns require different key performance indicators than lead generation efforts.
Engagement Performance Metrics
Engagement metrics include likes, comments, shares, saves, and calculated engagement rate. Engagement rate—typically calculated as total engagements divided by reach or followers—provides a standardized measure for comparing performance across social media posts and platforms. Industry benchmarks suggest 1-5% engagement rates depending on platform and industry, with Instagram averaging higher than LinkedIn or X.
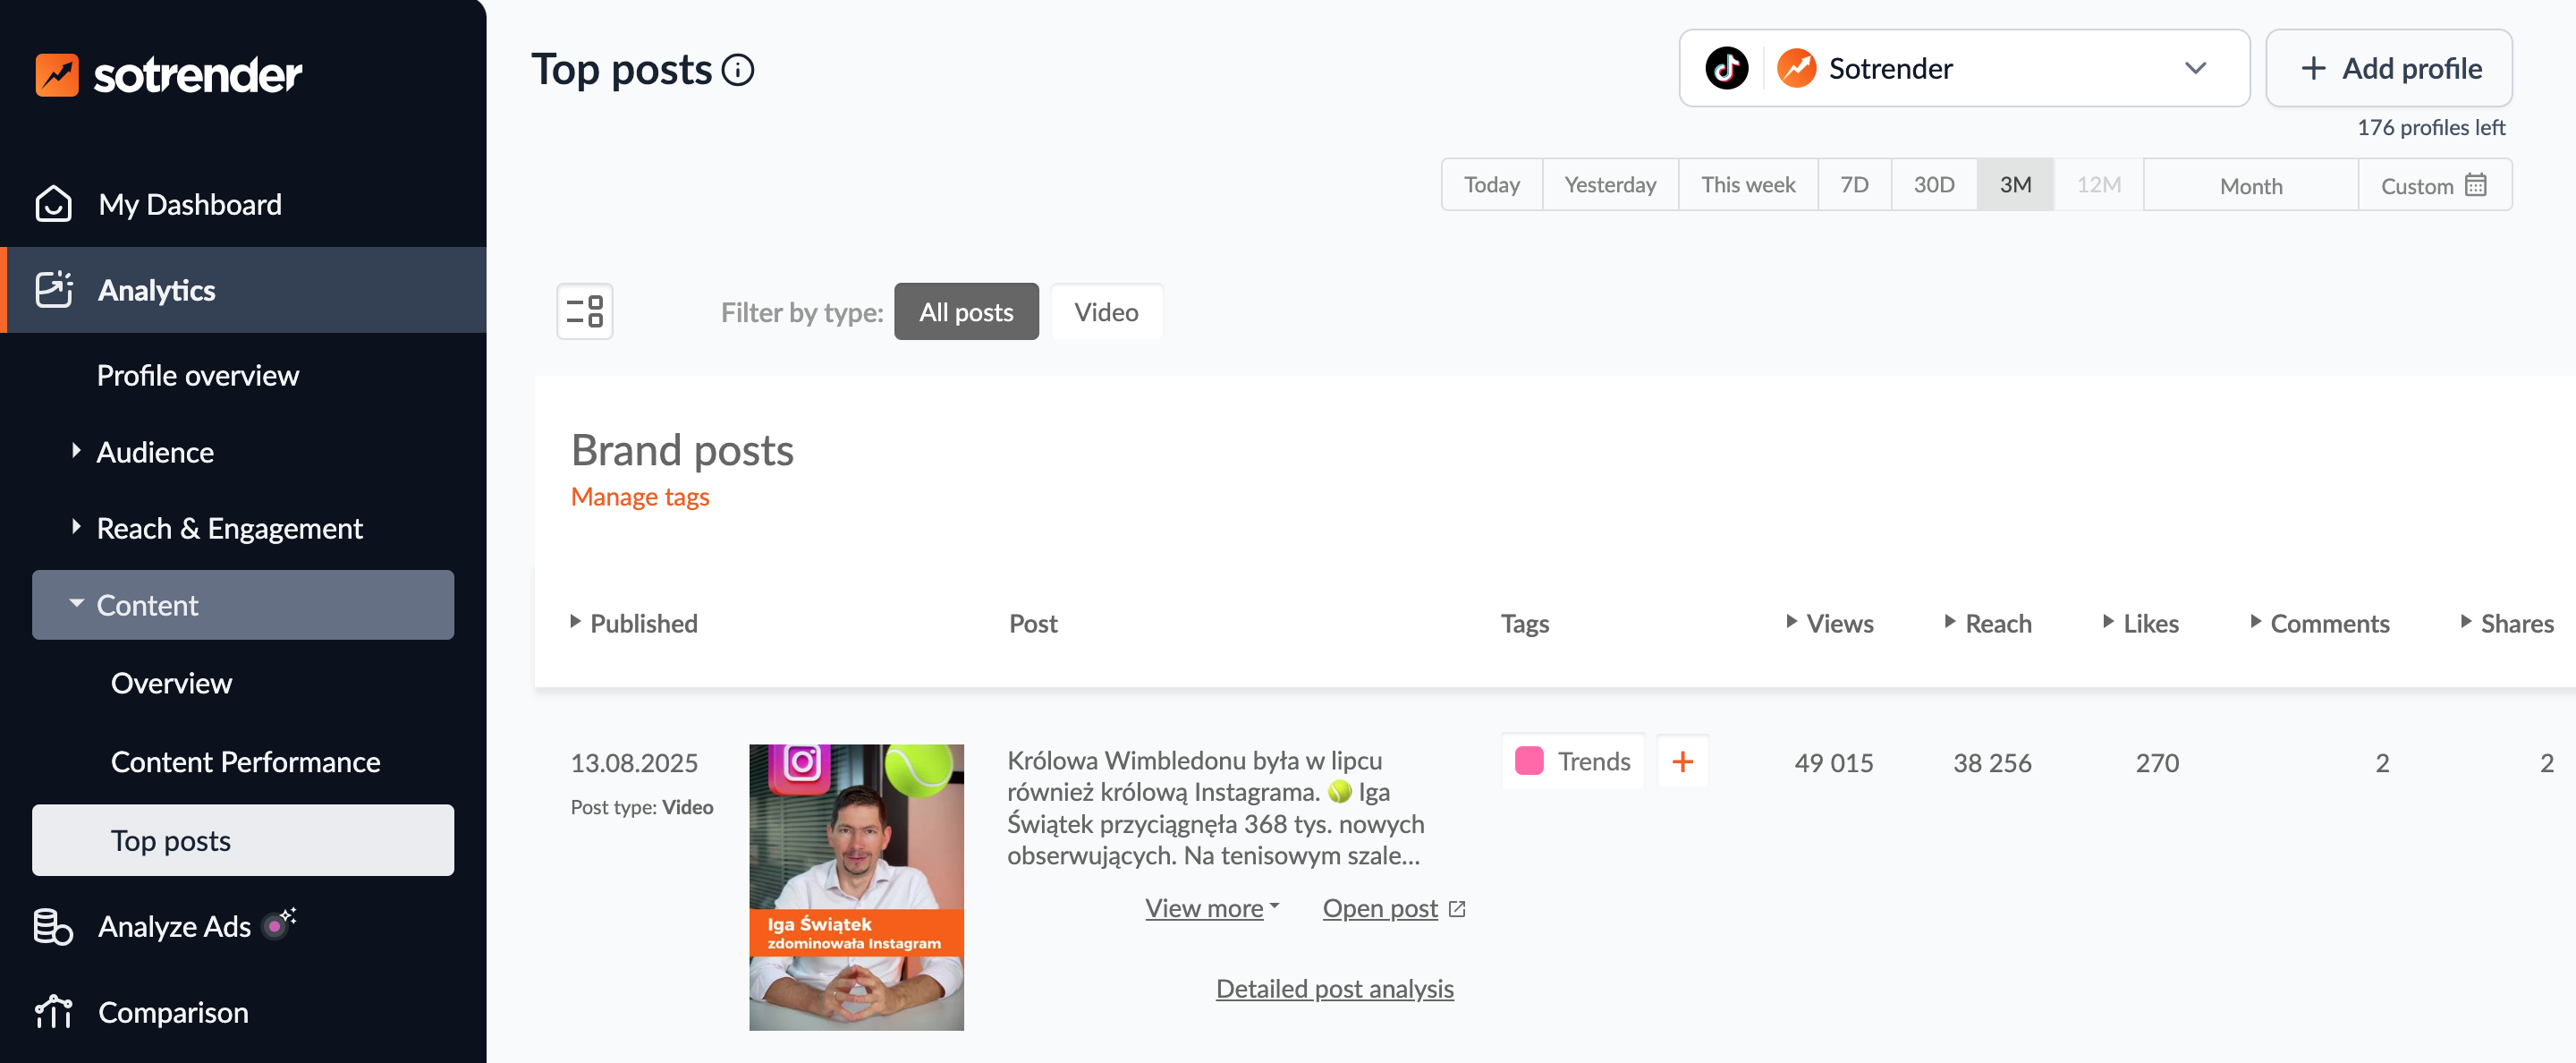
These metrics indicate content resonance and audience connection quality. High engagement signals that your content strategy aligns with what your target audience values. Tracking top performing posts reveals patterns in format, topic, and timing worth replicating.
Reach and Awareness Indicators
Awareness metrics encompass impressions (how often content appeared), reach (unique accounts that saw content), follower growth, and brand mentions. Tracking audience growth over time reveals whether your social strategy is expanding your potential reach or stagnating.
These indicators connect directly to top-of-funnel marketing objectives. For brands focused on awareness, reach and impressions matter more than conversions. Monitoring brand mentions through social listening also supports competitor analysis and reputation management.
Conversion and Business Impact Metrics
Conversion metrics include click-through rates, landing page conversions from social traffic, lead generation numbers, and revenue attribution. UTM parameters and platform pixels enable tracking the path from social media accounts to business results. For YouTube, metrics like average view duration and subscribers gained indicate content effectiveness.
Connecting social activities to bottom-line outcomes proves ROI definitively. When you can show that LinkedIn campaigns generated 50 qualified leads or that Instagram drove $25,000 in attributed revenue, you transform social reporting from a marketing exercise into a business intelligence function.
Combining engagement, awareness, and conversion metrics provides a complete picture of social media performance across the customer journey. This comprehensive view enables strategic recommendations grounded in evidence rather than assumptions.
Step-by-Step Social Media Analytics Report Creation Process
Understanding which metrics matter leads naturally to implementing them in actual reports. This systematic approach ensures consistency, thoroughness, and stakeholder alignment.
Planning and Setup Phase
Before gathering data, establish clear parameters that guide every subsequent decision:
- Define report objectives and target audience—executives need high-level business outcomes; marketing teams need tactical detail; clients need ROI demonstration and strategic recommendations.
- Select reporting frequency—monthly reports suit ongoing performance tracking; quarterly reports work for strategic reviews; post-campaign reports analyze specific marketing campaigns in depth.
- Choose relevant social media KPIs—align metrics with business goals and audience expectations; a brand awareness campaign emphasizes reach while a lead generation campaign focuses on conversions.
- Establish data collection sources—ensure access to all necessary analytics platforms; configure any social media management tool integrations; set up Google Analytics tracking for social traffic.
Report Format Comparison
Different report formats serve distinct purposes and audiences. Selecting the right structure ensures your report resonates with its intended readers.
Social media report types
Summary
Analysis
Specific
Media Report
When you manage multiple platforms, comprehensive cross-platform reports provide strategic overview while platform-specific appendices enable tactical decisions. Agencies often use custom reports tailored to individual client needs and branding.
Understanding which format fits your situation helps avoid common implementation challenges that can undermine report effectiveness.
Common Challenges and Solutions
Even with proper planning, report creators face predictable obstacles. Recognizing these challenges allows you to implement preventive solutions.
Data Integration and Accuracy Issues
When gathering data from multiple social media platforms, discrepancies arise. Native analytics may use different attribution windows or calculation methods, leading to inconsistent metrics across platforms.
Solution: Use cross-platform reporting tools that normalize data, establish clear definitions for how you calculate key metrics, and validate numbers against source platforms periodically. Document your methodology so stakeholders understand how figures are derived. Many social media management tools offer built-in integrations that reduce manual errors.
Stakeholder Engagement and Report Adoption
Reports that go unread provide zero value. Common issues include excessive length, irrelevant metrics, and unclear recommendations.
Solution: Customize report depth for specific audiences—lead with key insights and provide detailed appendices for those wanting deeper analysis. Use audience insights to understand what each stakeholder cares about. Present data visually when possible; a chart showing audience growth communicates faster than a data table.
Proving Social Media ROI
Many organizations struggle to connect social media activity to business outcomes, leaving social media marketing undervalued and underfunded.
Solution: Implement attribution tracking from day one. Connect social metrics to website conversions using Google Analytics. Use historical data to show trends over time and calculate cost-per-acquisition for paid social. When you can compare performance against the same period last year, you demonstrate meaningful progress rather than isolated numbers.
Solving these challenges positions you for long-term reporting success that builds credibility with stakeholders.
Conclusion and Next Steps
Effective social media analytics reports transform scattered data into strategic intelligence. By understanding core components, selecting appropriate key social media metrics, following systematic creation processes, and avoiding common pitfalls, you create reports that demonstrate value and drive better social media reports over time.
The difference between reports that get ignored and reports that shape strategy lies in relevance and clarity. Focus on metrics tied to business outcomes, present findings visually, and always include actionable recommendations based on what the data reveals.
Immediate next steps:
- Download and customize a report template suited to your primary reporting audience and goals.
- Audit your current metrics to ensure alignment with stated social media objectives—eliminate vanity metrics that don’t inform decisions.
- Set up automated data collection through your social media analytics tool (like Sotrender) to streamline future reporting and reduce manual errors.
- Schedule regular report reviews with stakeholders to maintain engagement, gather feedback, and refine your approach.
For those ready to expand capabilities, consider advanced applications like AI-powered insights that automatically identify trends in performance data, competitive analysis using brand mentions and share-of-voice metrics, or social listening integration for deeper audience behavior understanding.


