
YouTube is a force to be reckoned with. They have 400 hours of video content uploaded every minute and 1.9 billion active users logged in. With so much content being created, you have to make sure that your content stays relevant, and the best way to check it is with a YouTube analytics tool.
If you’re a business on YouTube, you have to invest a great deal of time and effort into planning, recording, and editing video content. That takes up a lot of resources, doesn’t it? You need to make sure that you’re publishing the right type of content that your viewers will appreciate. To grow your business, you not only want to get the attention of new users, but you also want your current viewers to be entertained and invested. It’s crucial that your business uses a YouTube analytics tool to make sure that you’re always improving the quality of your content.
When you’re not familiar with checking your YouTube analytics, it can be a daunting task to figure out what’s what. That’s exactly why using Sotrender to check those for you is a lot easier: the tool keeps all of your metrics simple, neat, and informative. Here’s a walk-through of how you can use our app to check your YouTube analytics.

What’s what in the app?
If you’re new to Sotrender, you might be confused about what metrics we consider. We have a quick explanation of which metrics matter for YouTube.
If you want to follow along using your own data, create an account and start the free trial.
The screen below is the first thing you’ll see after you’ve added an account. For our purposes, we’ll be using the Netflix profile.
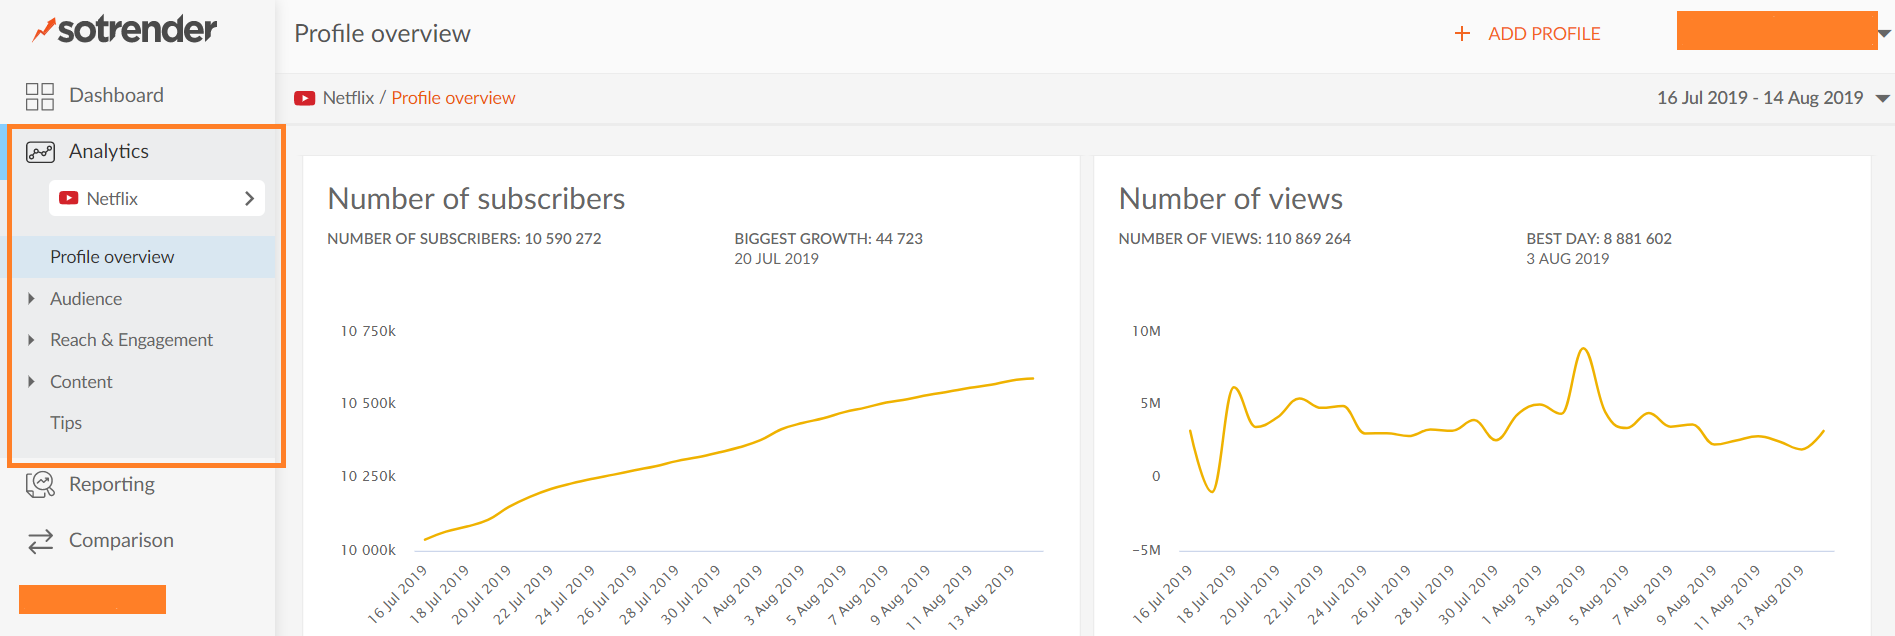
Analyzing YouTube in the Sotrender app
We have a collapsed menu on the left-hand side, where you can click on any of the tabs and it will show you the different metrics you can choose from. This is just the overview, and you can see how neat the graphs are. Every graph will come with a tool-tip, just in case you’re wondering what you’re looking at.
Now, if you’re ready, let’s start analyzing.
Who’s watching my videos?
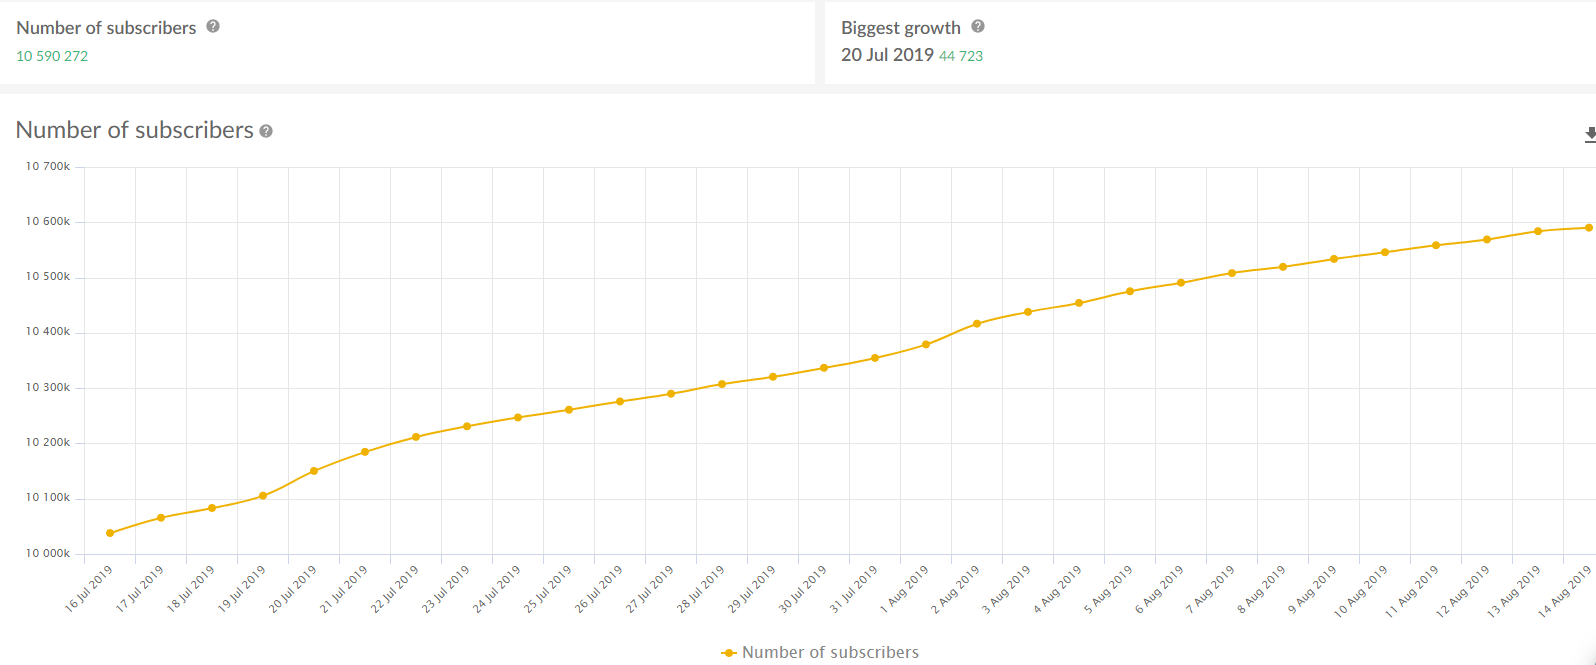
The first metric you’ll want to check out is how many people follow your account. When you open the Audience tab, there are two graphs you should pay attention to. The first one indicates the total number of followers you have on your account. It’s also crucial that you pay attention to when you had the biggest increase in followers.
The biggest growth appears to be on the 20th of July, 2019. You can find out what happened by clicking on the graph on that date, or any date for that matter. Sotrender’s graphs are interactive, so you can pick and choose the information that’s the most important for you.
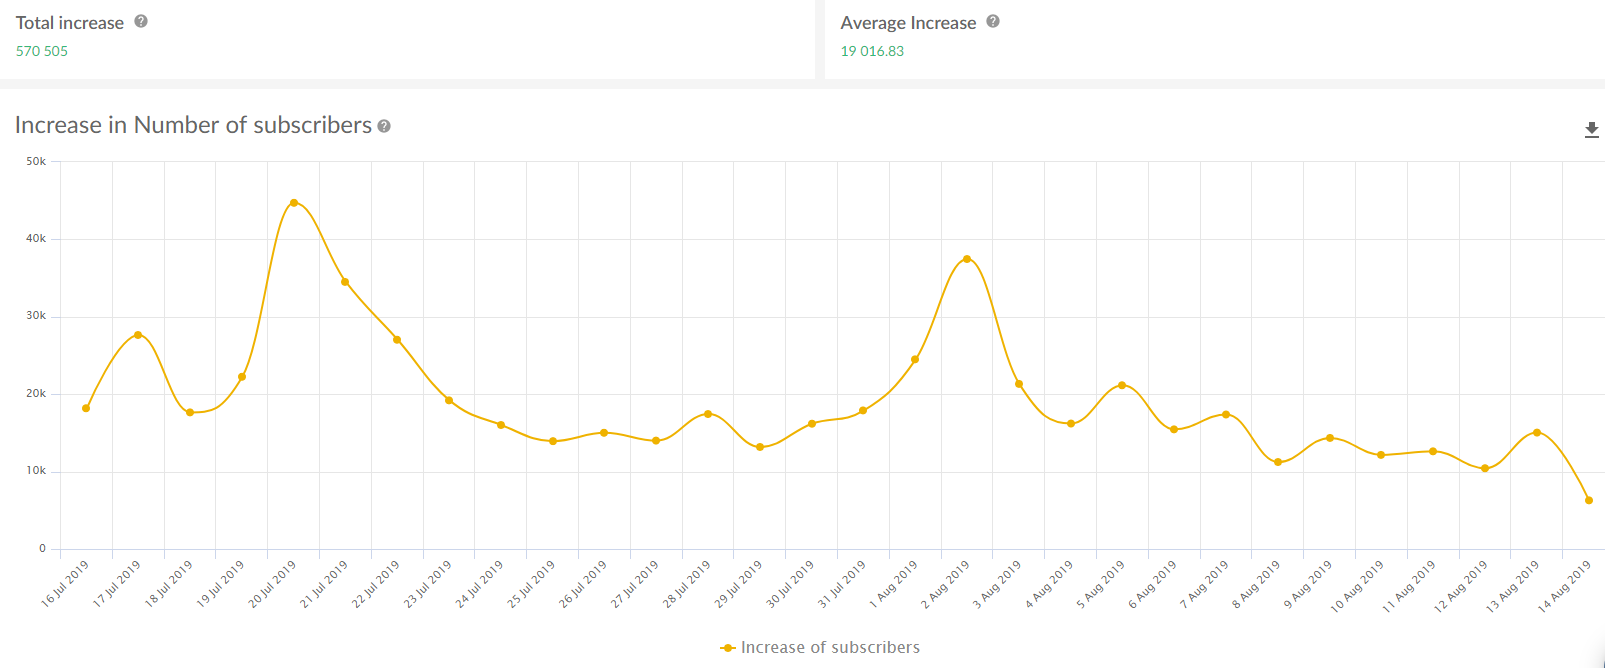
The second graph in the Audience tab is the increase in the number of followers. Basically, you have a visualization of your growth here. This one is important because the number of followers doesn’t give you the full picture. People may subscribe or unsubscribe to your account at any time, so you need to keep an eye on whether your viewership is growing quickly or stabilizing. By clicking on the dates when you had smaller growth, you can find out what your audience finds less appealing.
Perhaps we can incentivize you to keep an eye on these metrics regularly. Do you know how YouTube’s algorithm favors some channels over others? One thing we know for sure is that channels and videos that have a faster growth rate and view velocity tend to get favored, so keep that in mind when you’re planning your YouTube strategy. How often you upload videos is also taken into account (see: How often should I post on YouTube?).
Is my content engaging my audience?
It isn’t enough to check your audience growth and call it a day. YouTube’s algorithm picks up videos based on more than just your channel size. The level of engagement that your videos get is one of the metrics that will impact whether your video comes up on a user’s search results or suggested videos. Here’s why it’s crucial to check more than just your audience data.
You might have noticed that some channels on YouTube have a large number of followers on their account, but they’re only getting a fraction of the views on their videos. That could be because those viewers aren’t engaged enough with the creator’s content, or because their content that was once novel and interesting is now outdated. You’ll have to check your engagement metrics to find out what type of videos your audience cares enough about to leave comments and likes on.
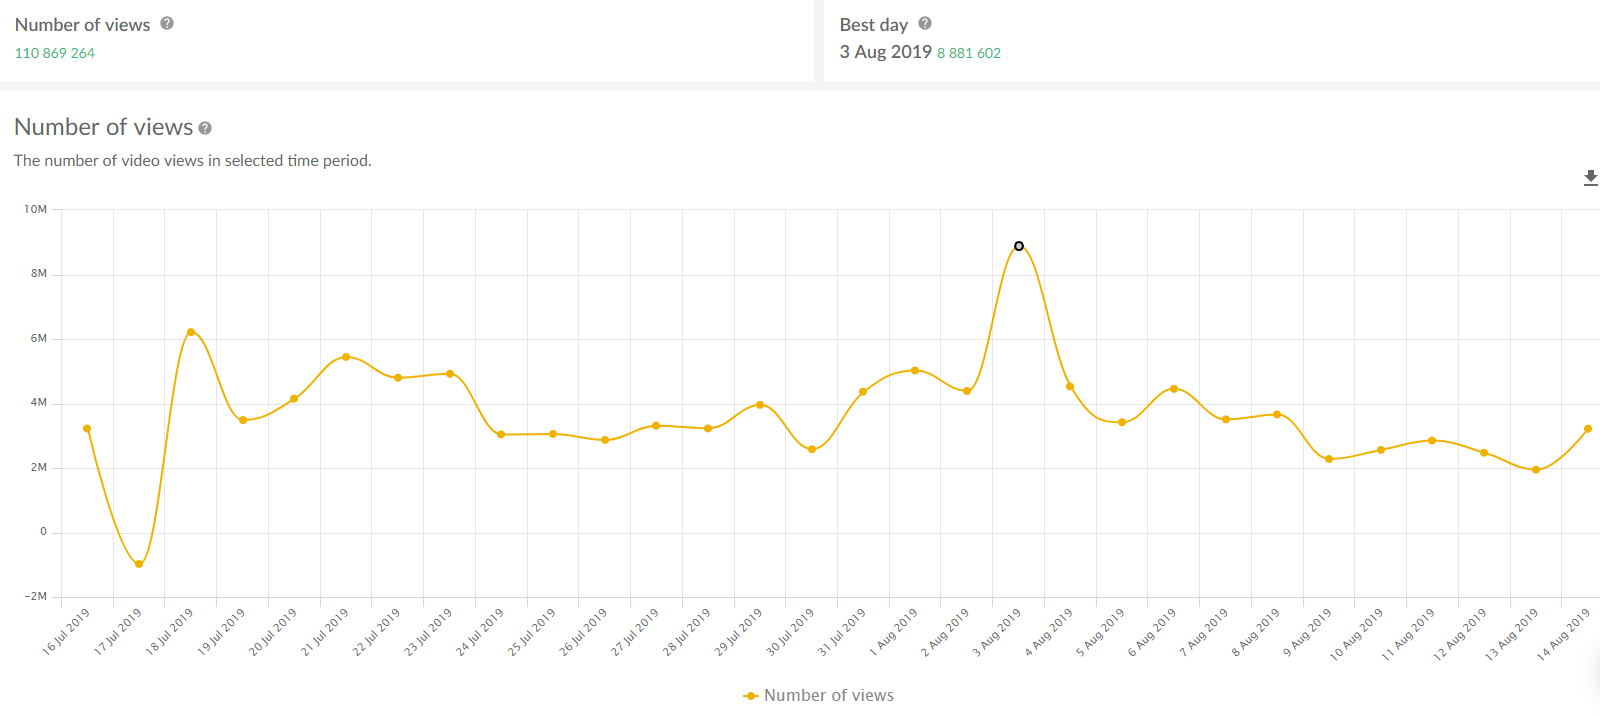
Here’s the number of views.
You can see the total number of views on your videos, as well as the best day. Just keep one thing in mind: not all attention is positive attention, and it could be the case that your number of views is due to something controversial. Let’s go into more detail about that.
You should see whether your content is getting more positive or negative attention. You can do that by monitoring your likes and dislikes on your videos, for one. It’s a pretty simple indicator, but a rather useful one.
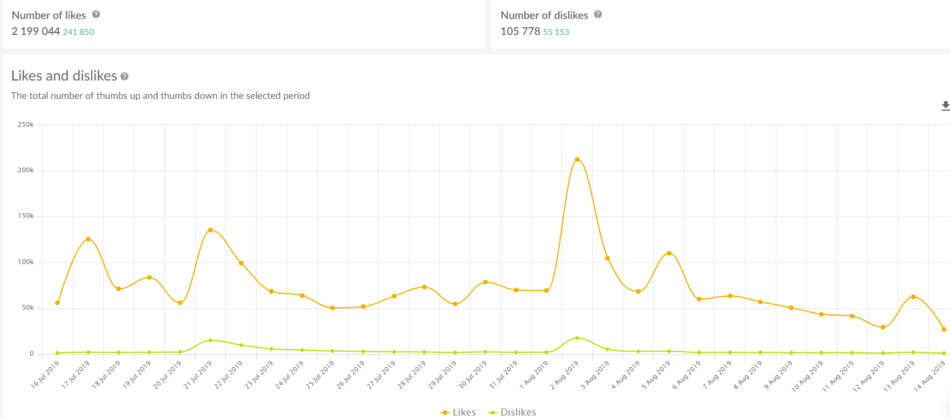
Analyzing likes and dislikes in Sotrender
The number of likes is generally higher than dislikes, so that’s good news! The total number of dislikes is relatively low here, which is also good. Using our line graph, you can find out if the number of dislikes is overtaking likes, and that should be a sign that this type of content might not be the best way to go.
What gets them talking?
Now you know whether your audience generally likes the videos you’re putting out there. Still, you need to see which of your videos are conversation-starters. This is what you will see when you click on “comments” in the collapsed menu.
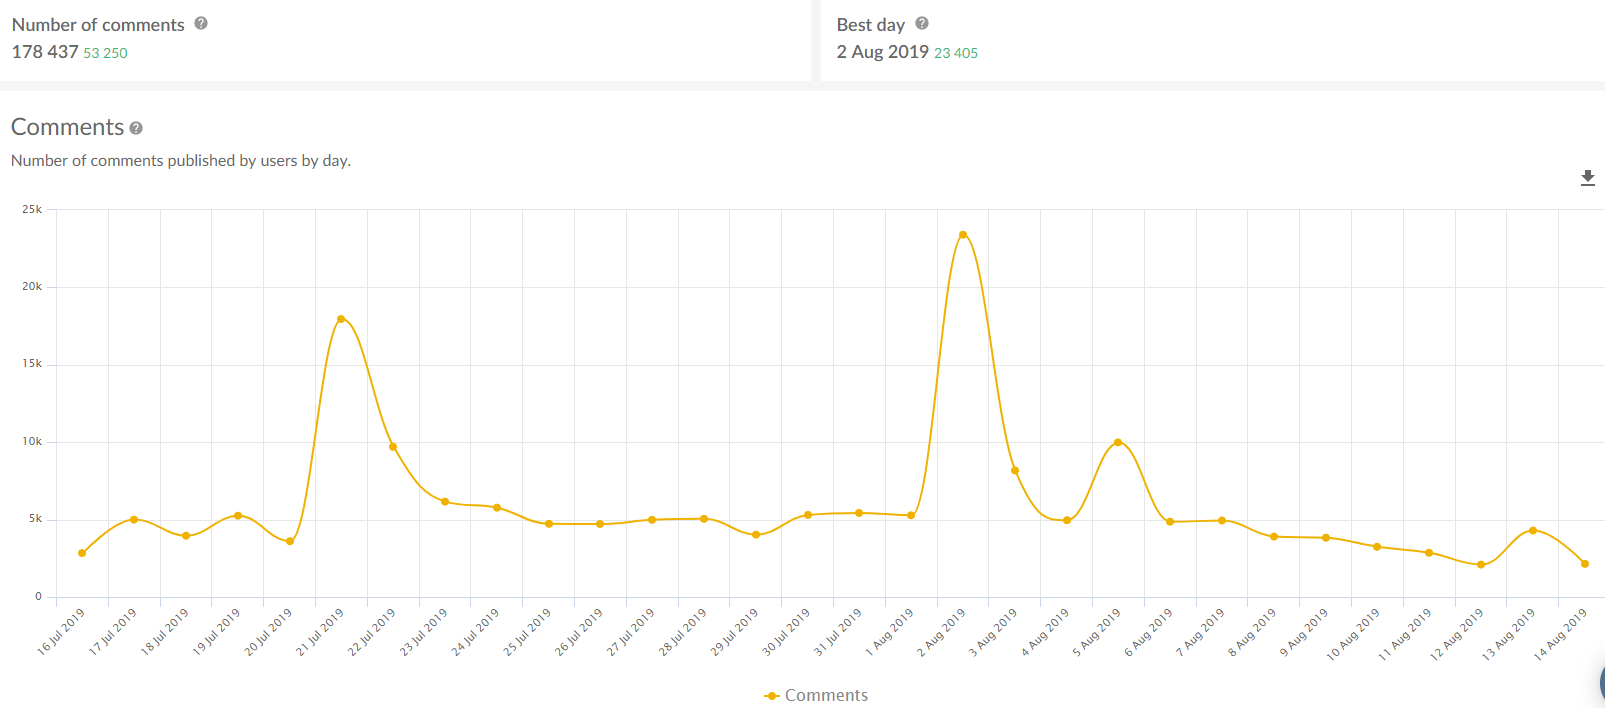
You can see the number of comments increasing on the line graph as well. That’s indicative of really engaging content. Your audience is taking the time to comment and discuss the content of your videos with other users. You should generally keep track of how the number of comments is changing per day, so you can see people are still talking about your content.
Here’s what I mean.
Notice how one of the peaks was on the 21st of July. What was published at the time?
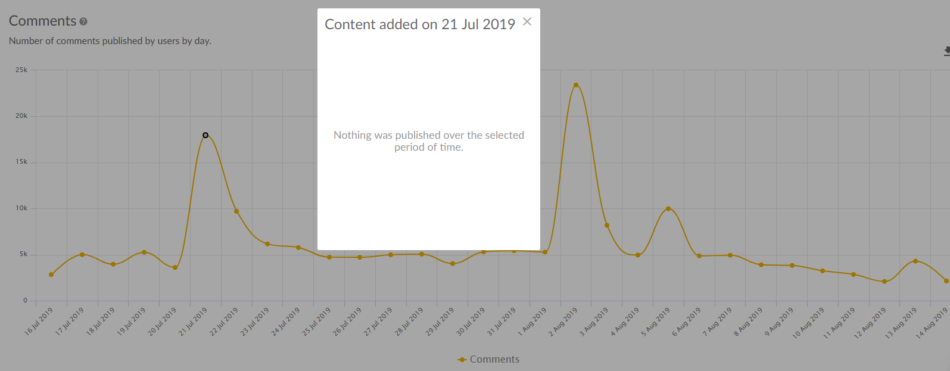
Actually, nothing was published on that day. That’s why you have to explore the graphs in our YouTube analytics tool. Take a look at what was published just a few days before that.
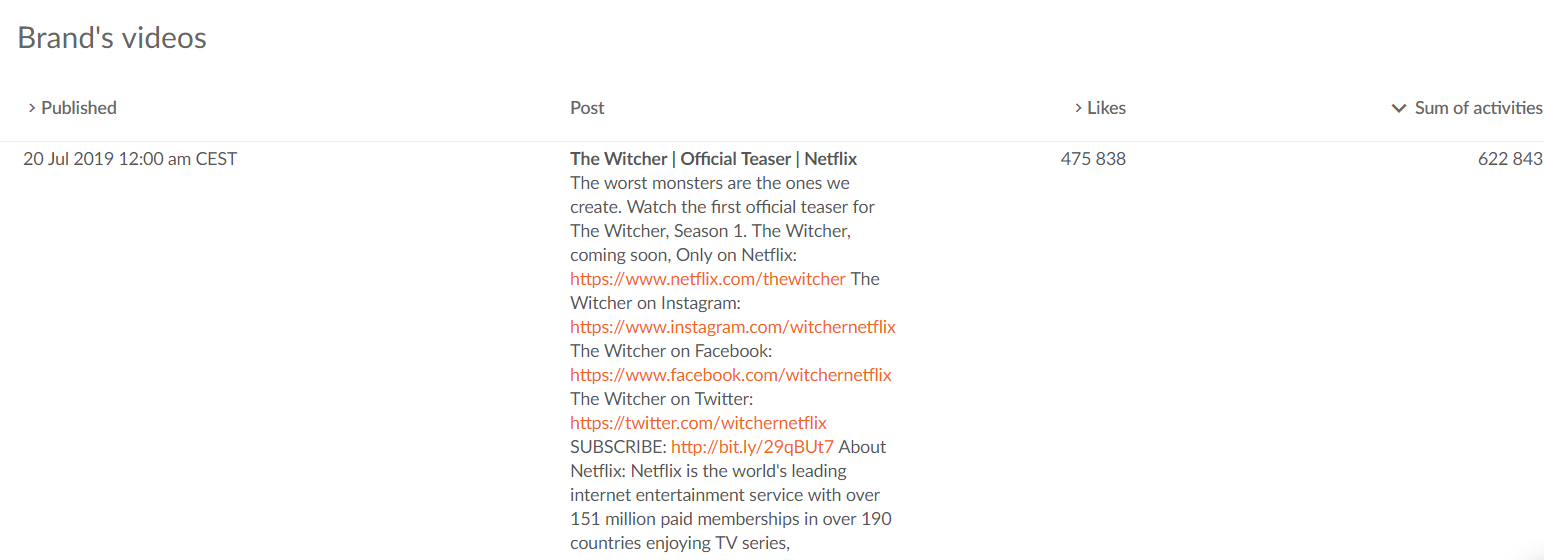
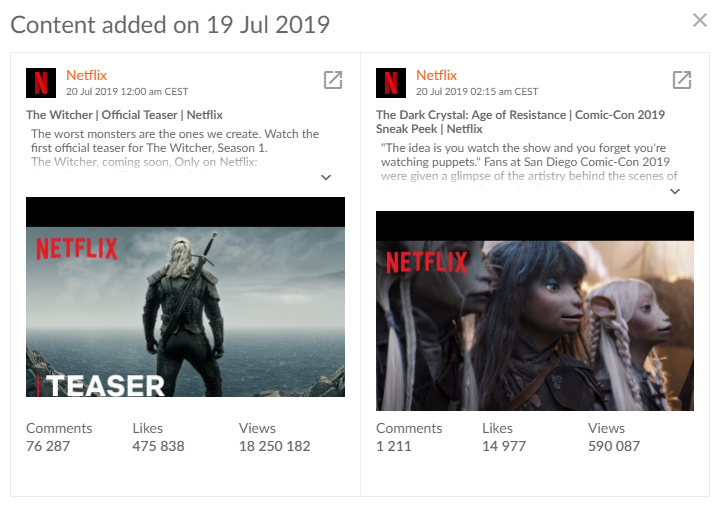 If we click on the 19th of July, you’ll see that they uploaded the trailer for their rendition of “The Witcher” series. As you can see, The Witcher stole the show on YouTube that day, boasting 18 million views and almost 80 thousand comments. You might be wondering why the number of comments was not as high on the day it was posted. Let’s see what Netflix was doing on the day that the comments really took off.
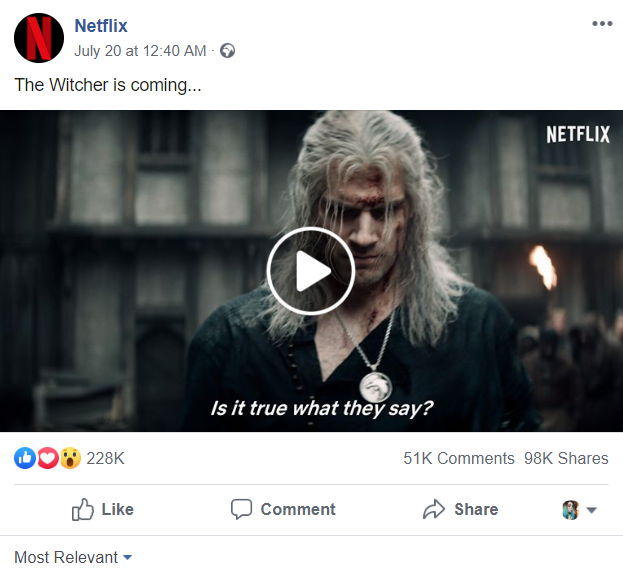
Unsurprisingly, they posted about The Witcher. If you want to save yourself the time I spent looking for this post manually, you should add multiple social media profiles on the Sotrender app. That way, you can cross-check to see if the marketing campaign is effective and integrated across different social media platforms. It looks Netflix’s audience is really invested in The Witcher.
You’ll want to be able to make sense of this data in a more general way. You know what your audience cares about, but when should you generally post? When are they on YouTube? Some days tend to be better than others for businesses on the platform, but it’s hard to generalize about posting times. You can find out which days are good specifically for your audience by looking at this bar graph in the Activity Index tab.
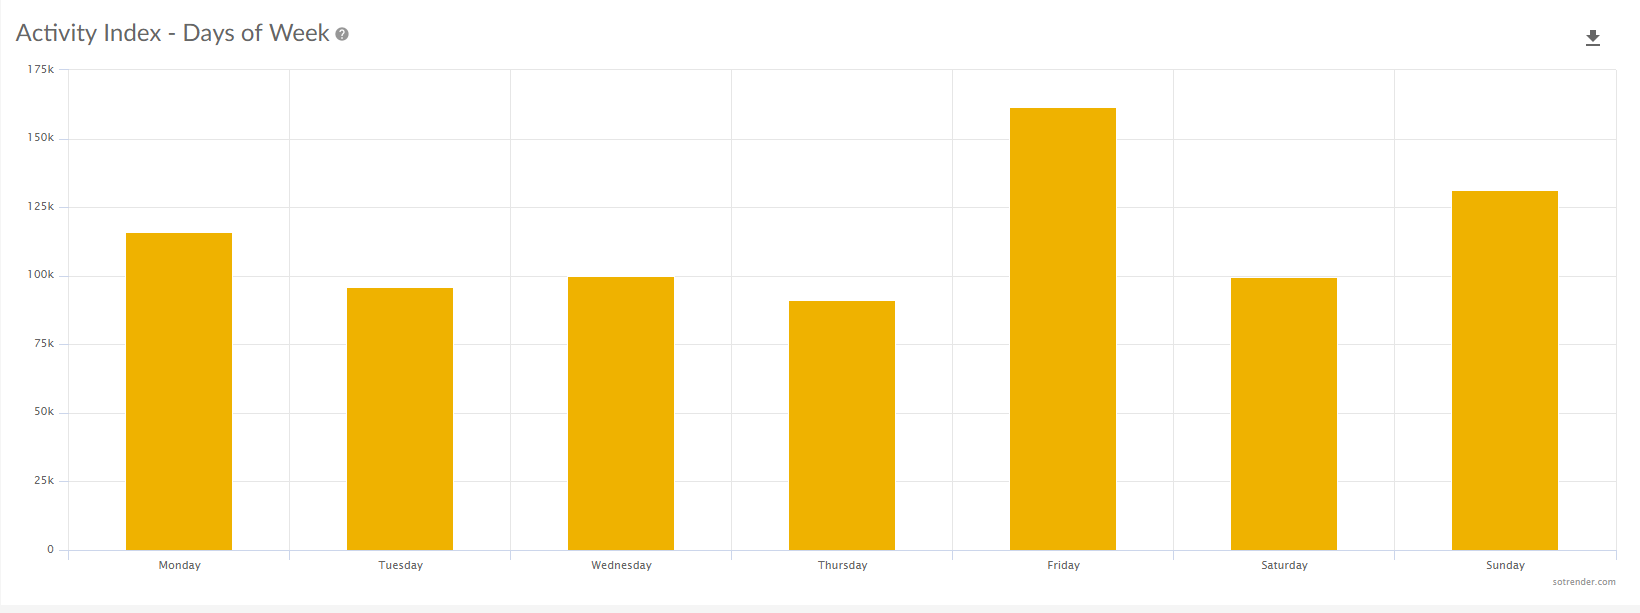
Activity Index in the Sotrender app
As you can see, most days are rather stable, but Monday, Friday, and Sunday seem to be performing better than the others. That should be your clue as to when you should be uploading your content. Depending on your audience’s demographics, the peak of the Activity Index could vary.
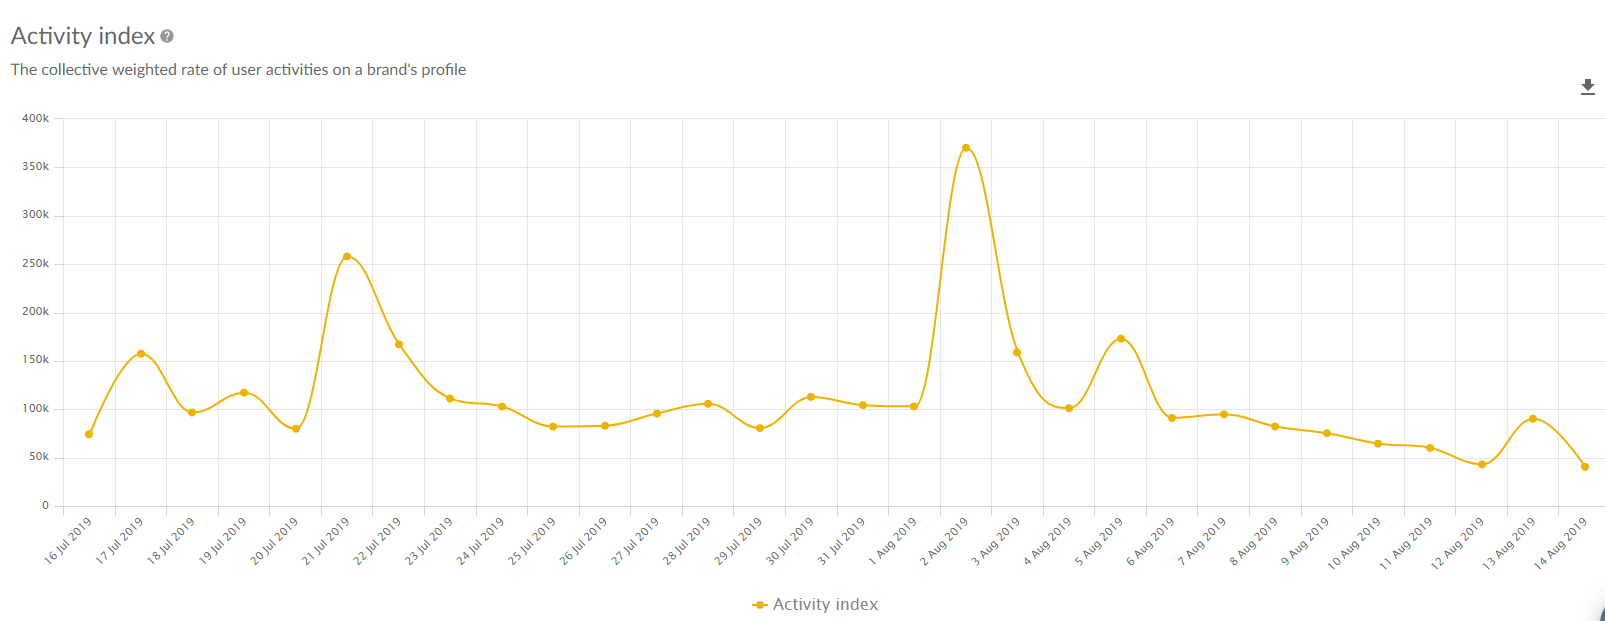
If you want a summary that combines the likes and comments, you can look at the Activity Index over time. This will help you step back and see the bigger picture over a longer period of time.
Can I see all of my top content in one place?
Yes, and it will save you so much time!
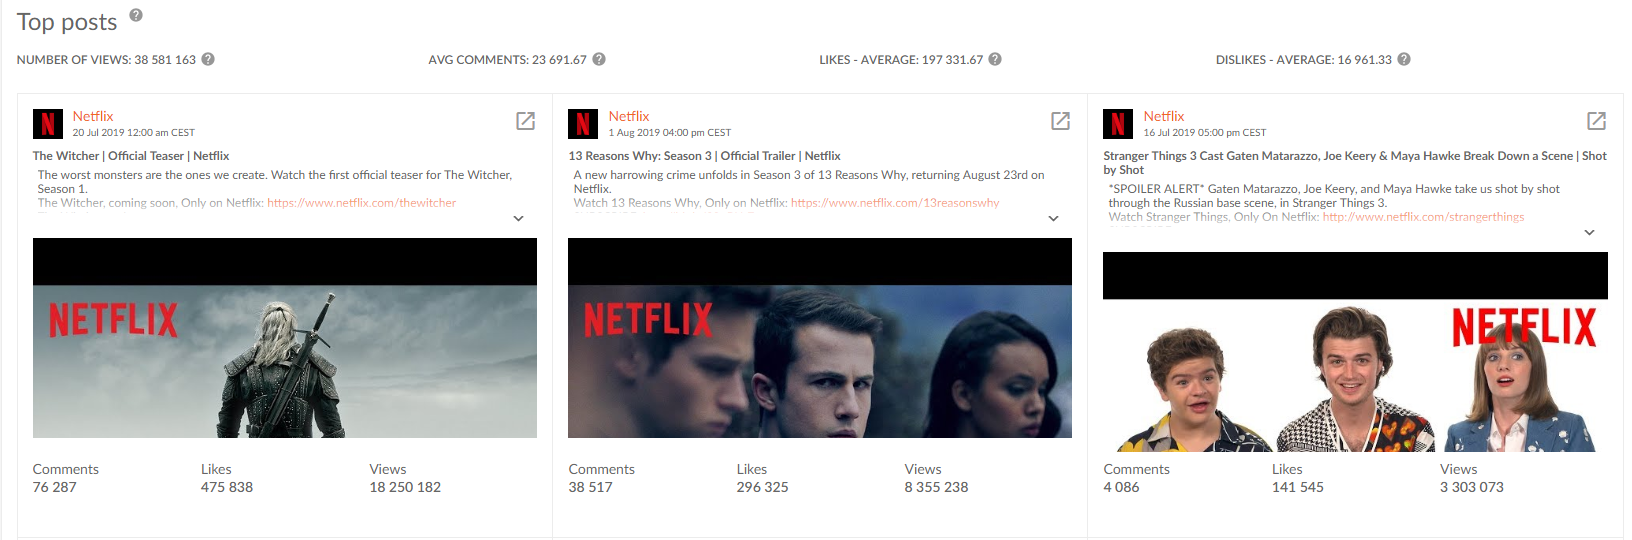
If you scroll through your top videos, you might notice a pattern. In Netflix’s case, The Witcher was the most popular video, but the videos that keep retaining interest over time involve Stranger things. Out of ten of their top posts, eight of them were Stranger Things related. The message seems loud and clear: Netflix’s audience enjoys engaging with content that includes the heroic kids from Hawkins, Indiana. You might not have picked up on that immediately without a YouTube analytics tool. 😉
Can I generate a report?
You can generate two types of summaries of your data: a PDF report and an XLS file.
With the PDF report, you can see all of the same metrics that were previously mentioned, just in a single file.
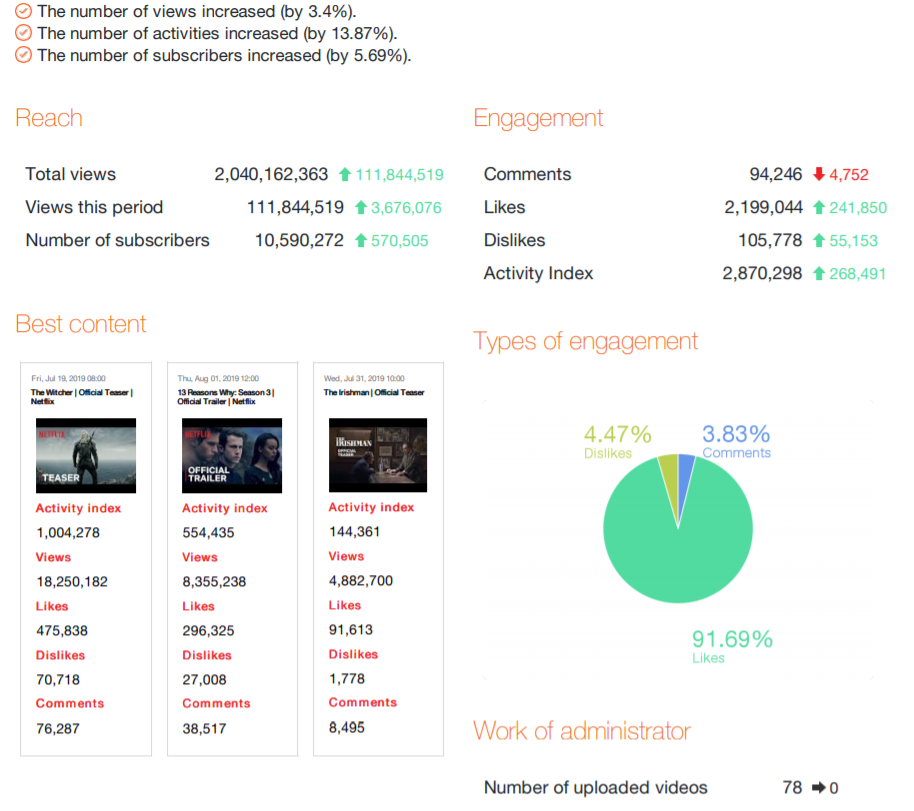
This will make it easier if you have clients or other coworkers that aren’t sure how to use a YouTube analytics tool. They can read it the report, and feel confident in the insights that they’ve gathered.
If you want to use our data but plot it yourself, you can always download the XLS file.
That’s a wrap!
Before we wrap up the metrics, you need to be aware of a few things. As a trial user, you get access to 30 days worth of historical data for your profile, but if you become Sotrender’s client, you’ll get 90 days worth of data. You can always contact our sales team to ask them what other data we can provide you.
And that’s all there really is to it! Hopefully, now you’ll feel comfortable navigating our YouTube analytics tool. Good luck with analyzing and growing your channel! 😉


