Instagram Insights has its own metrics for tracking your business profile’s performance. However, not every metric you come across is as crucial as you might think, vanity metrics are a thing, after all. In this post, we’ll tell you more about the specific Instagram metrics you should care about to improve your social media performance.
Instagram metrics in a nutshell
Before we begin, you have to make the switch to a business profile if you want access to see your analytics for free in Insights. Just keep in mind that Insights will only provide you with data from the past seven or 30 days. This means there is no way to select a specific period of time you are interested in which means you lose out on data. For more historical data, you’d have to subscribe to a tool like Sotrender.
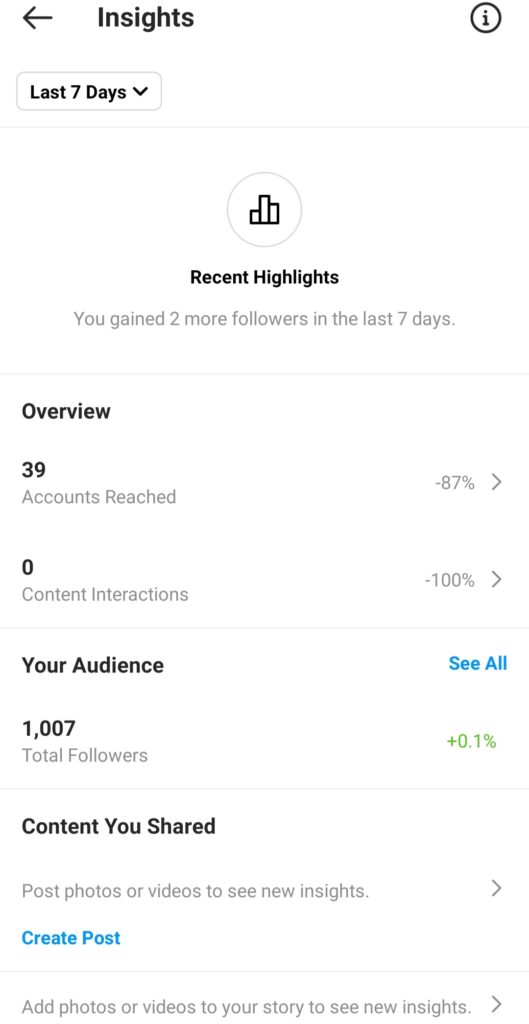
You can find your Instagram metrics by visiting your profile, tap the top right-hand corner, and select Insights. The metrics you should be focusing on in Insights are follower audience demographics, reach, and user engagement.
Audience metrics
Let’s start by getting to know your audience. Audience demographics are just one way you can get to know who is following you and why. You can see:
- the top locations by cities and countries,
- gender demographics and age range,
- how your follower count changed over time, but you don’t see the average followers you gain a week
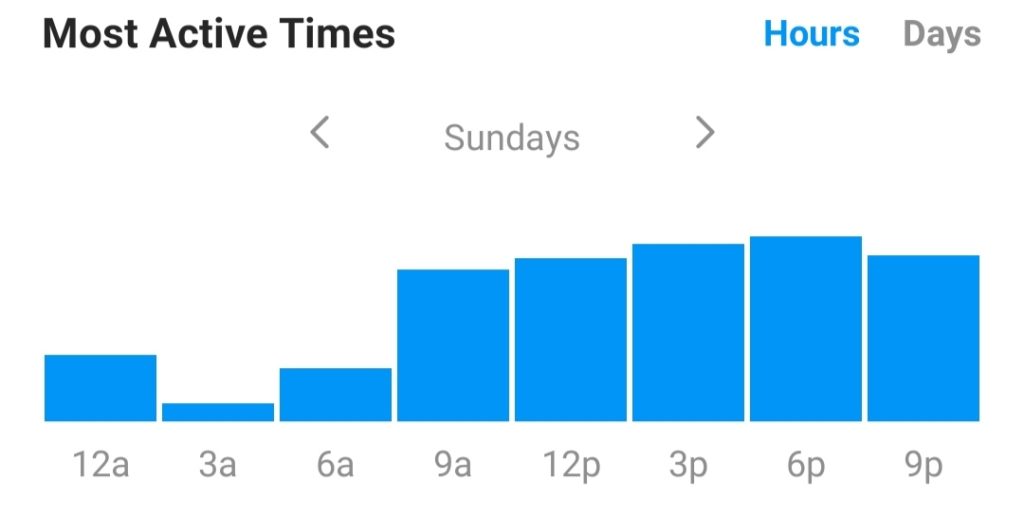
- and when your audience was active during the day and week.
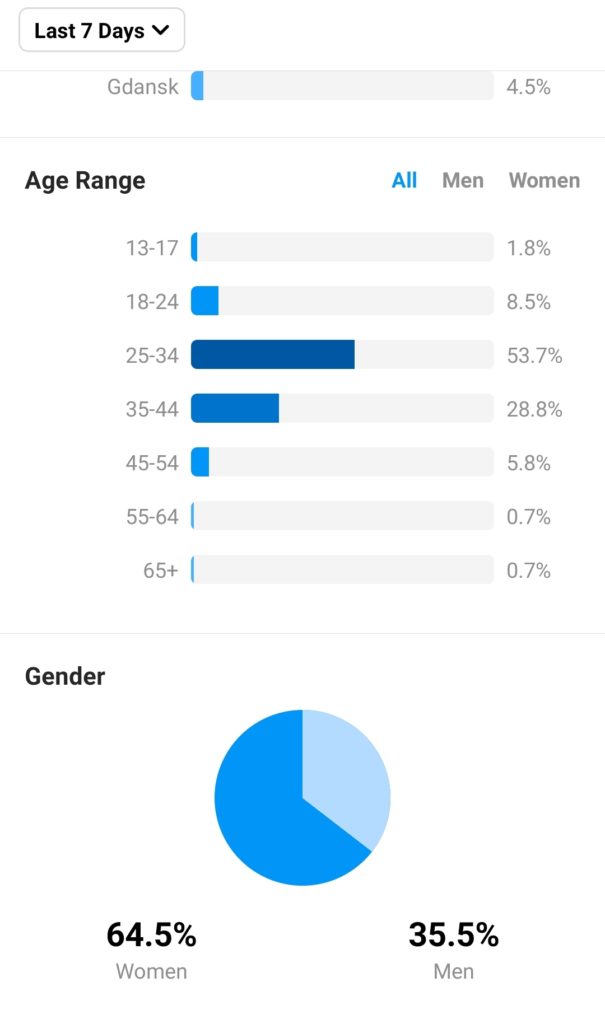
Why are those audience metrics important? Well, you might learn that your account is popular in a few specific regions, so it might be worthwhile putting out ads where you target users from that location. On the other hand, it might mean that you should also have posts available in more than one language if you have a lot of followers from foreign countries. And finally, by finding out their age ranges, you can think about changing your strategy to appeal to your audience more. After all, marketing to Gen Z isn’t the same as marketing to Gen X.
You can even see follower growth rate over time on Instagram, and we generally recommend keeping an eye on this. This metric matters because it’ll give you an idea of what content might be attracting more followers than usual. 😉
There isn’t an easy way to decide what time you should post on Instagram just based off of the most active times bar graph. Unfortunately, you’ll have to go through each of the days of the week one by one to figure that one out.
Reach metrics
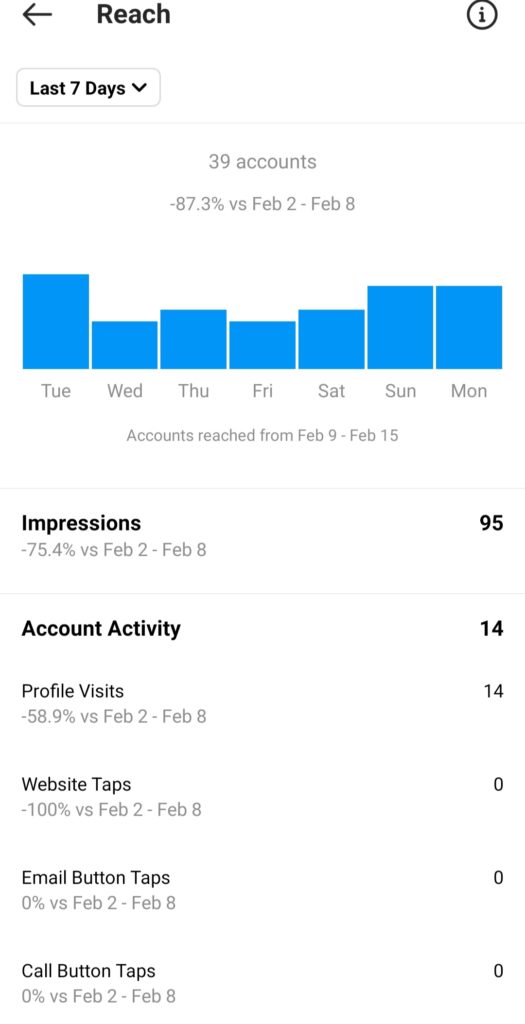
Alright, this next part is actually pretty easy. You can check your reach by clicking on “accounts reached” in the overview. You’ll immediately see a graph showing you the number of people reached by day and a comparison to the previous week. The rest of the metrics are also going to be two-week comparisons. It’ll make it a bit easier when you need to write up the results for each metric!
Interaction metrics
And finally for engagement, the number of post and Story interactions will be visible. You’ll see the number of each type of interaction on the right, though there isn’t a direct comparison between periods.
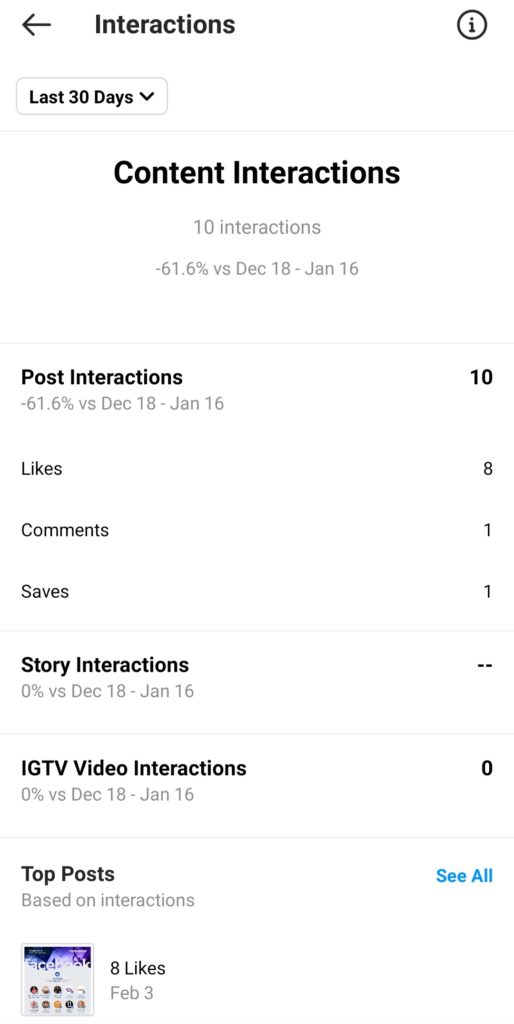
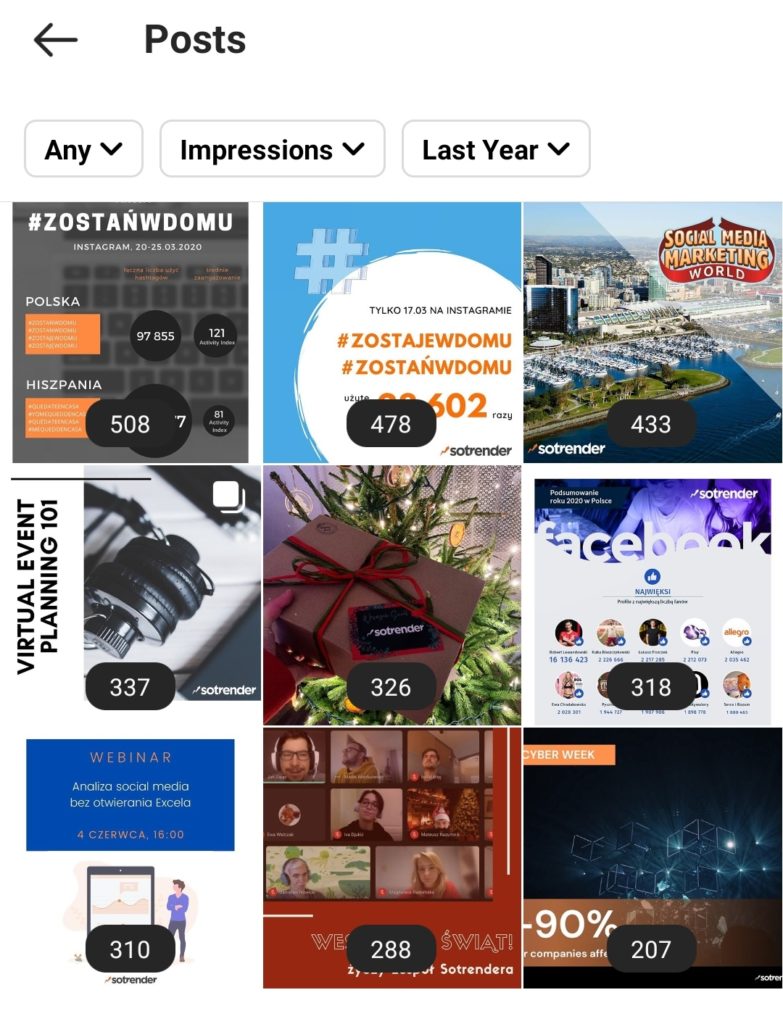
Top posts and stories also make it a bit clearer what content will interest your audience more, but once again, the date range is limited. There is another downside in Instagram’s tool – it isn’t easy to compare all of the metrics at once for your top posts and Stories.
As you can see, these are limited metrics that will not give you a fuller picture of your performance. Although Instagram Insights have improved over the years, you can’t keep track of the changes over a longer period of time. You can’t edit the graphs to suit your needs, either. You’ll have to use a social media analytics tool, like Sotrender.
Using Sotrender to track the most important Instagram metrics
More and more people are switching to third-party tools to meet all of their social media analytics needs.A quick glance will show you that Sotrender has the same metrics and more. Here’s how Sotrender compares with Insights.
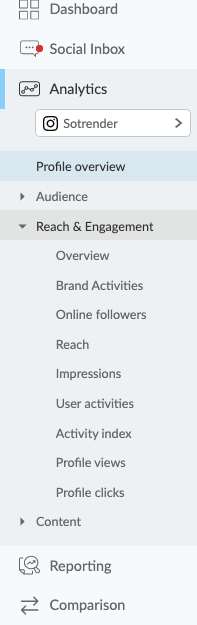
Firstly, you’ll notice that Sotrender’s metrics are organized in a pretty clear way. The metrics and features are organized in a menu on the left-hand side, which can collapse depending on which tab you open.
Let’s click on the audience tab and see what we can learn about our followers!
Audience metrics in Sotrender
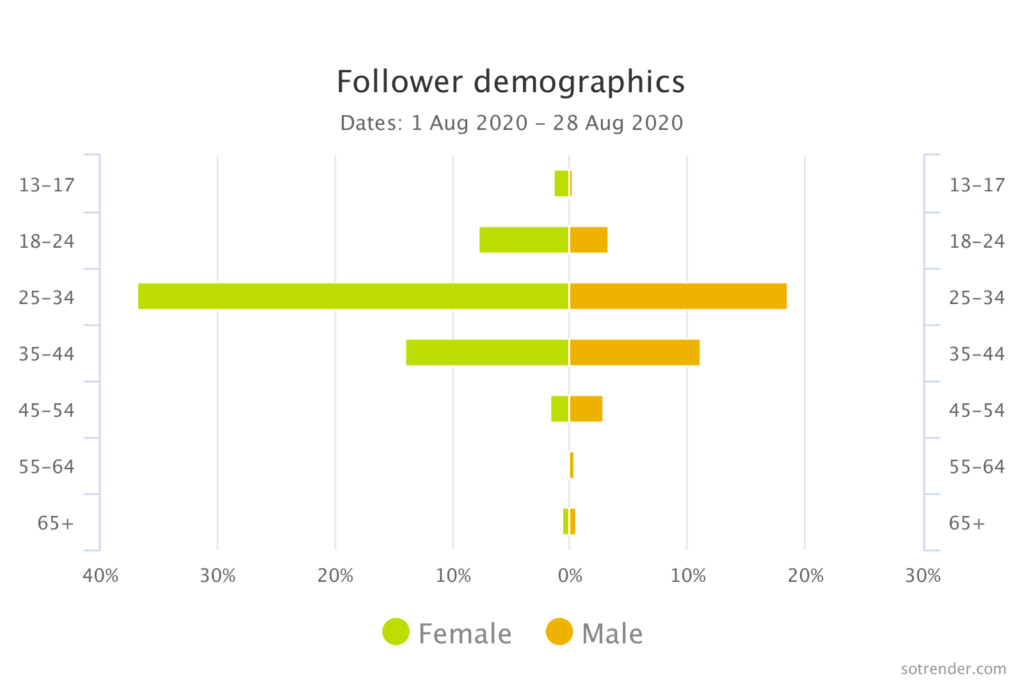
Here’s how your audience is divided by age and gender, in just one graph. You basically get a better hint about how your audience might behave online (but of course, you should be checking more than just the audience tab).
What about tracking demographic changes over time? Glad you asked. 😉
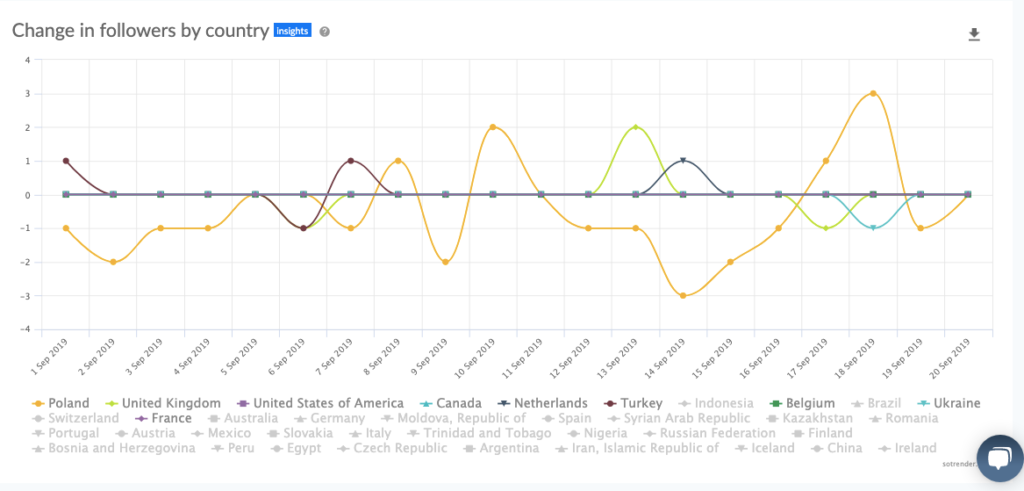
Why are some of the labels greyed out? That’s because we can click on the graph to modify it, and show you a few countries at a time.
Reach and engagement metrics in Sotrender
If your boss or client asks you about how your followers interact with the profile, you can show them one of these graphs from the reach and engagement metrics.
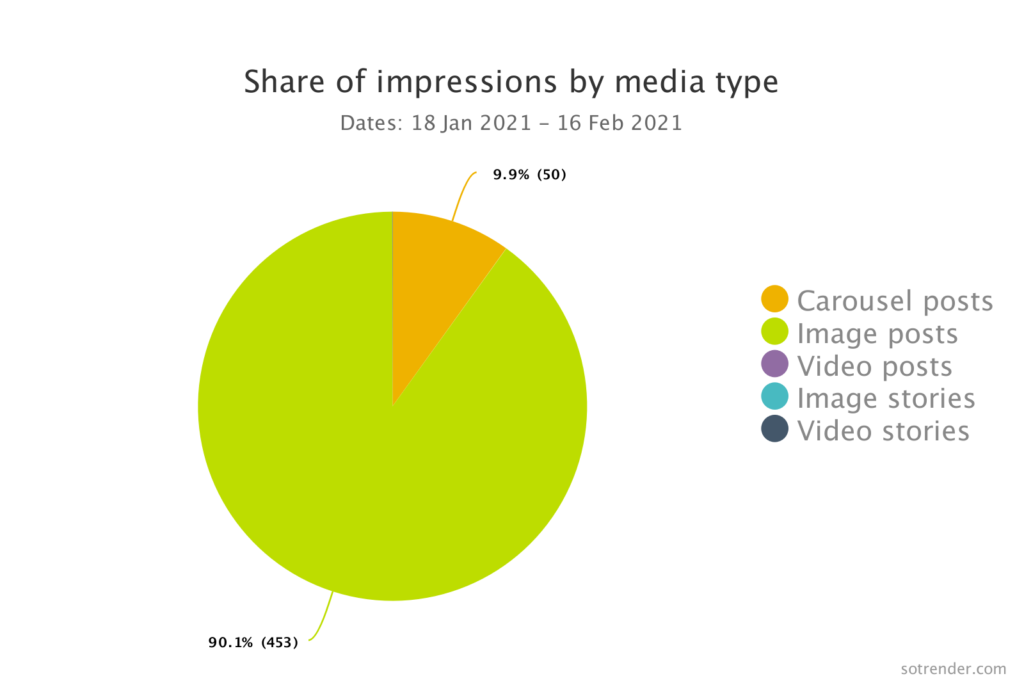
It shouldn’t be too hard to figure out which of your posts get the most visibility, nor which of your posts got the most diverse types of interactions. 😉
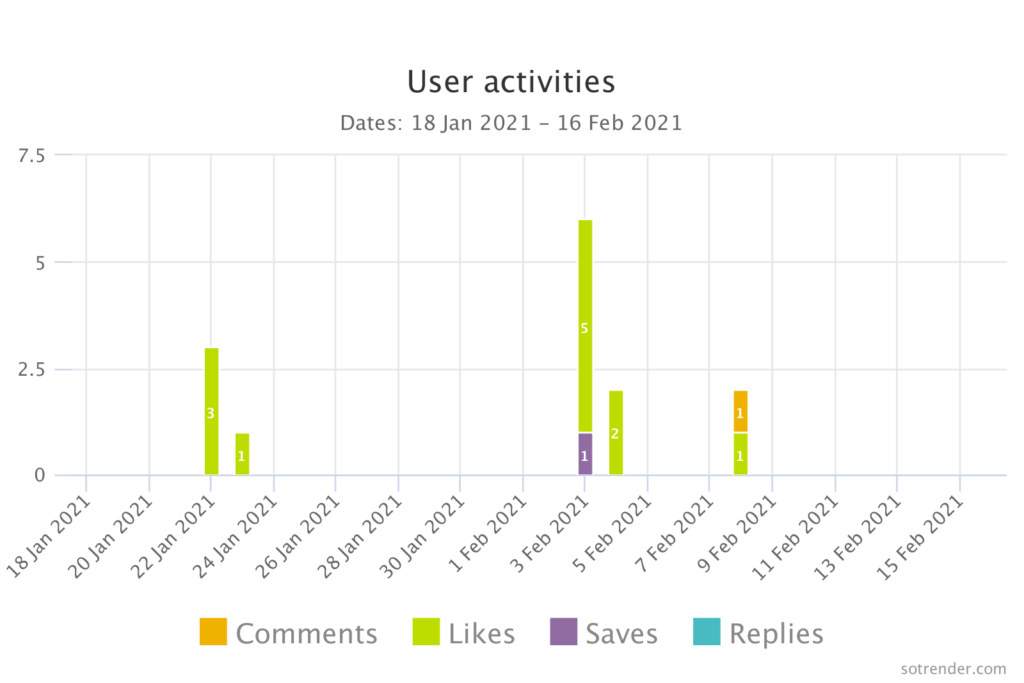
But what about additional metrics? At Sotrender, we realized that Instagram counts interactions as if they’re all the same. However, double-tapping the screen to like a post doesn’t mean they’re as invested as users who comment, share, or save your posts. Don’t focus too much on the number of likes your posts get – for one, likes won’t be visible to other users anymore, and it’s easily classified as a vanity metric since people can buy Instagram likes. So what did we do?
We made our own metric that weights the types of interactions and how much effort is involved. This is our Activity Index. You can read more about the details in the link, but the gist of it is likes are less invested than shares. Seems pretty intuitive, doesn’t it?

So even if you got thousands of likes but only a couple of comments on a single post, the Activity Index will show you the difference. It’s important that you know which of your content is especially engaging so you can spend more time making similar content. As your engagement increases, so will your visibility on people’s Instagram feeds and Explore page. 😉
Track the most important metrics to get ahead
That was our quick summary of which Instagram metrics you should care about! We hope it’s easier for you to navigate your Instagram analytics to find the crucial data. Now you just have to decide which tool to work with: Insights or a third-party application? To make that choice easier, feel free to check out our free trial that lasts 14 days! 😉 You don’t even have to put in your credit card information, just sign up with your email, add your Instagram profile, and start analyzing.