Creating engaging content is essential in running successful social media marketing. Now that there’s so much content to consume, it is hard to cut through the social media noise. Without appealing graphics and captions, you don’t even have a chance to be visible.
But how can you know what kind of content is the most attractive to your audience? There is no doubt that you need to stay up to date with your content performance and run comprehensive analytics.
Below, we will explain how you can track your content results and how to identify the best posts for your social media profiles.
How to easily check your content performance?
Analyzing content results does not seem to be a challenging task. And if you will be checking your results systematically, it can add to a better social media performance. By tracking the content that you’ve already published, you will be able to identify your top posts and use them as a base for your strategy.
You can take a look at your Facebook Insights to get an idea of your content performance. It is possible to check there the types of posts that were the most engaging as well as a list of all your posts with some basic stats beside them: their reach and activities.
However, if you want to take a closer look at your content stats, we recommend using a more advanced tool like Sotrender. Whether you’re implementing a perfectly crafted content strategy, or relying on a trial and error method, analyzing your posts performance with an external tool will help you to understand your results in a more comprehensive way.

Analyze content results in a more advanced way
If you decide to analyze your content marketing activities in Sotrender, simply log in to the app and choose a profile you want to take a closer look at. It can be any Facebook page, but also your Instagram, Twitter or YouTube profile.
Once you choose a profile, go straight to the ‘Content’ section. Here, you will find all important data regarding your content performance.
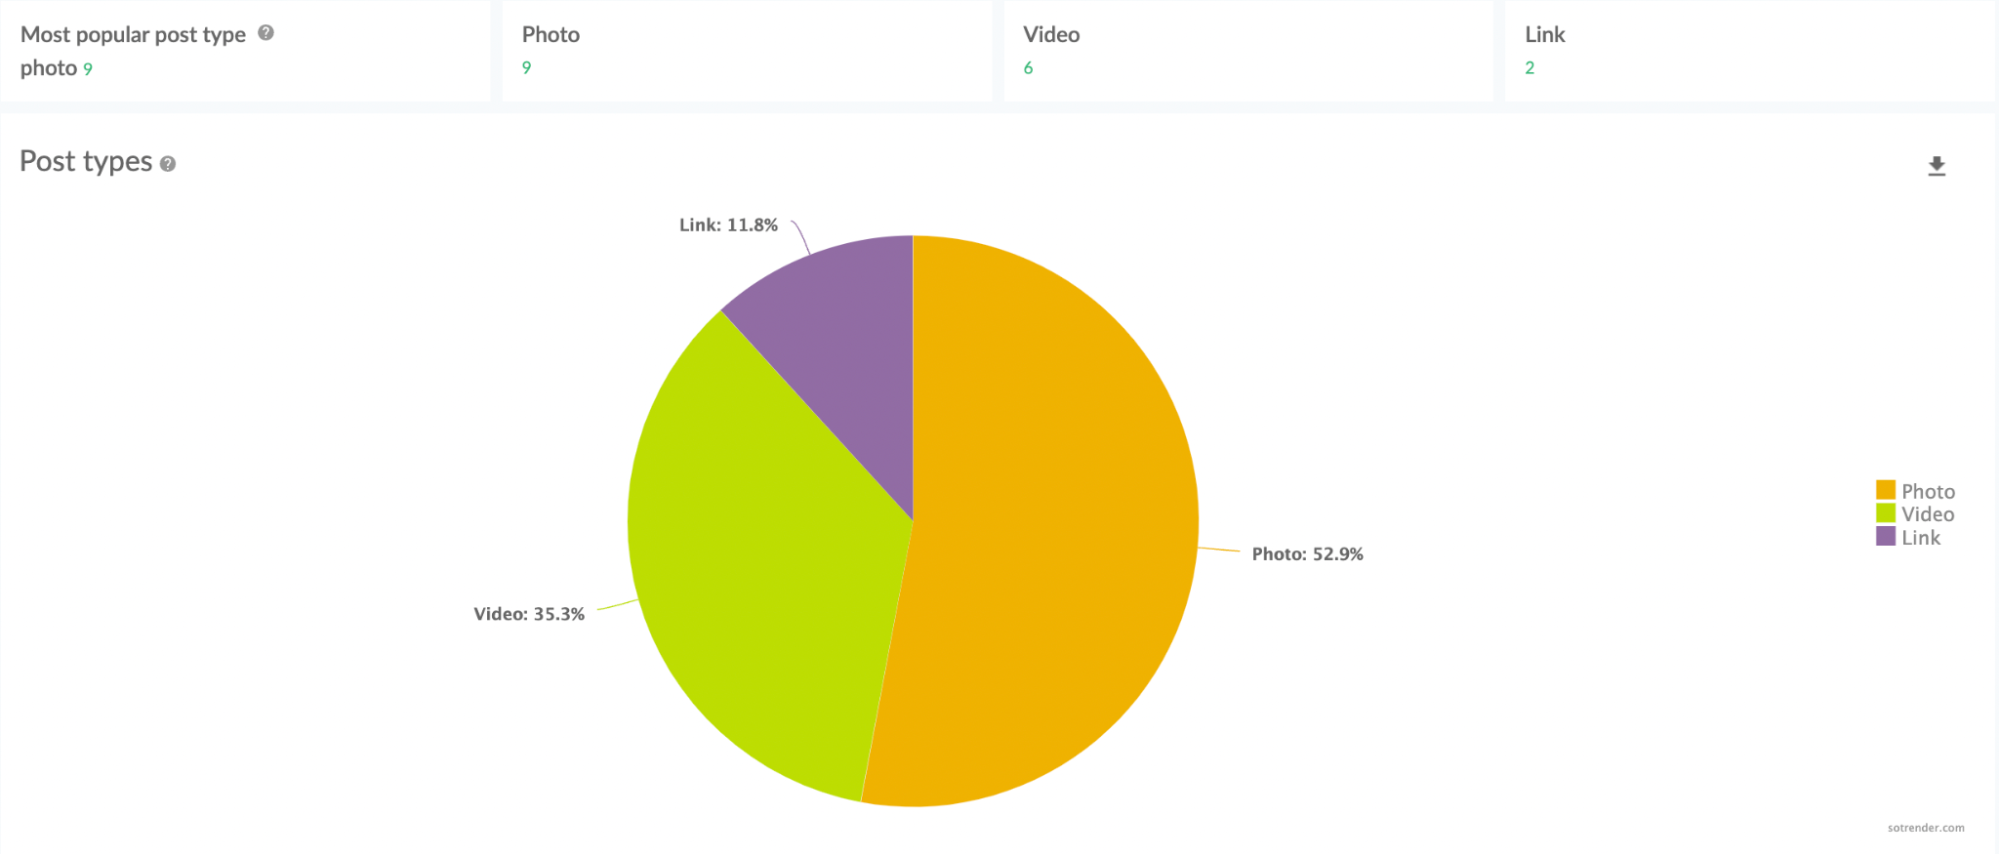
In the ‘Overview’ section, you will see, among others, a pie chart with the post types that you use. Click on it and you will see a percentage share of particular post types – photos, videos, links and regular text posts.
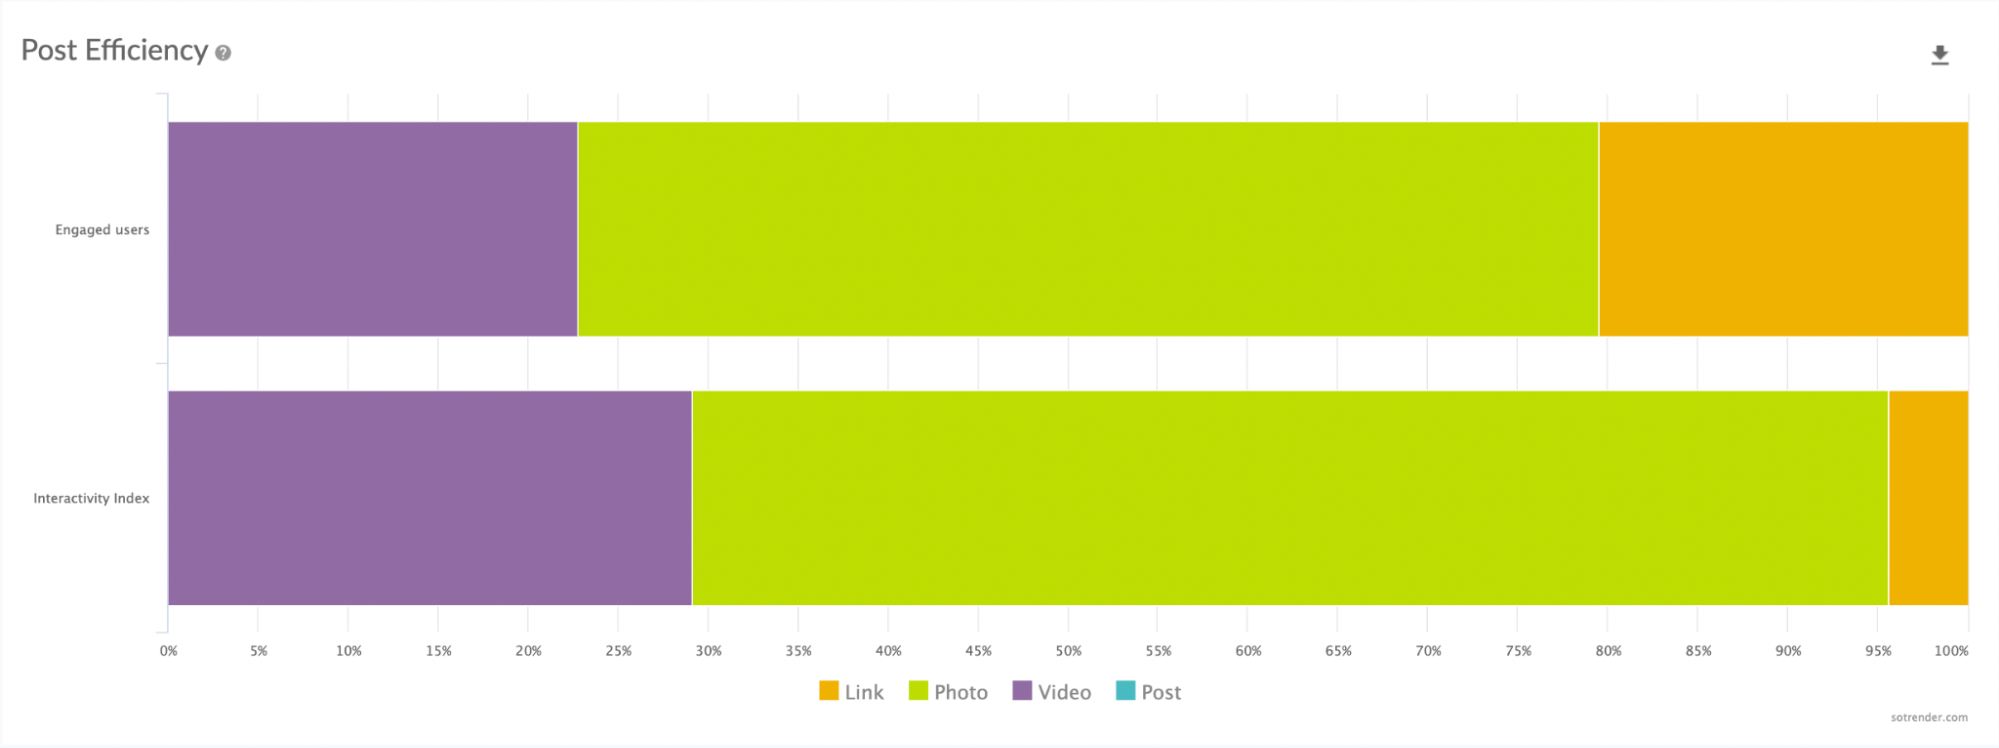
Below, you can see another chart presenting post efficiency for each post type. It shows you which post type turned out to be the most engaging for your audience. You can also see the Interactivity Index metric (Sotrender’s unique engagement rate) for each post type. Thanks to such data you’re getting very useful insights about the effectiveness of particular post types. Based on this you can plan your future content more accurately.
Now that you know which post types engage your users at the highest level, head on to the ‘Top posts’ section to see which posts exactly gained the biggest interest. In this tab, you will see a list with all your posts from a selected time period (dates can be adjusted in the right upper corner).
If you’re getting lost with the vastness of publications, filter the results by post types. Then, you will only see posts of a preferred category (for example, only posts with pictures or videos).
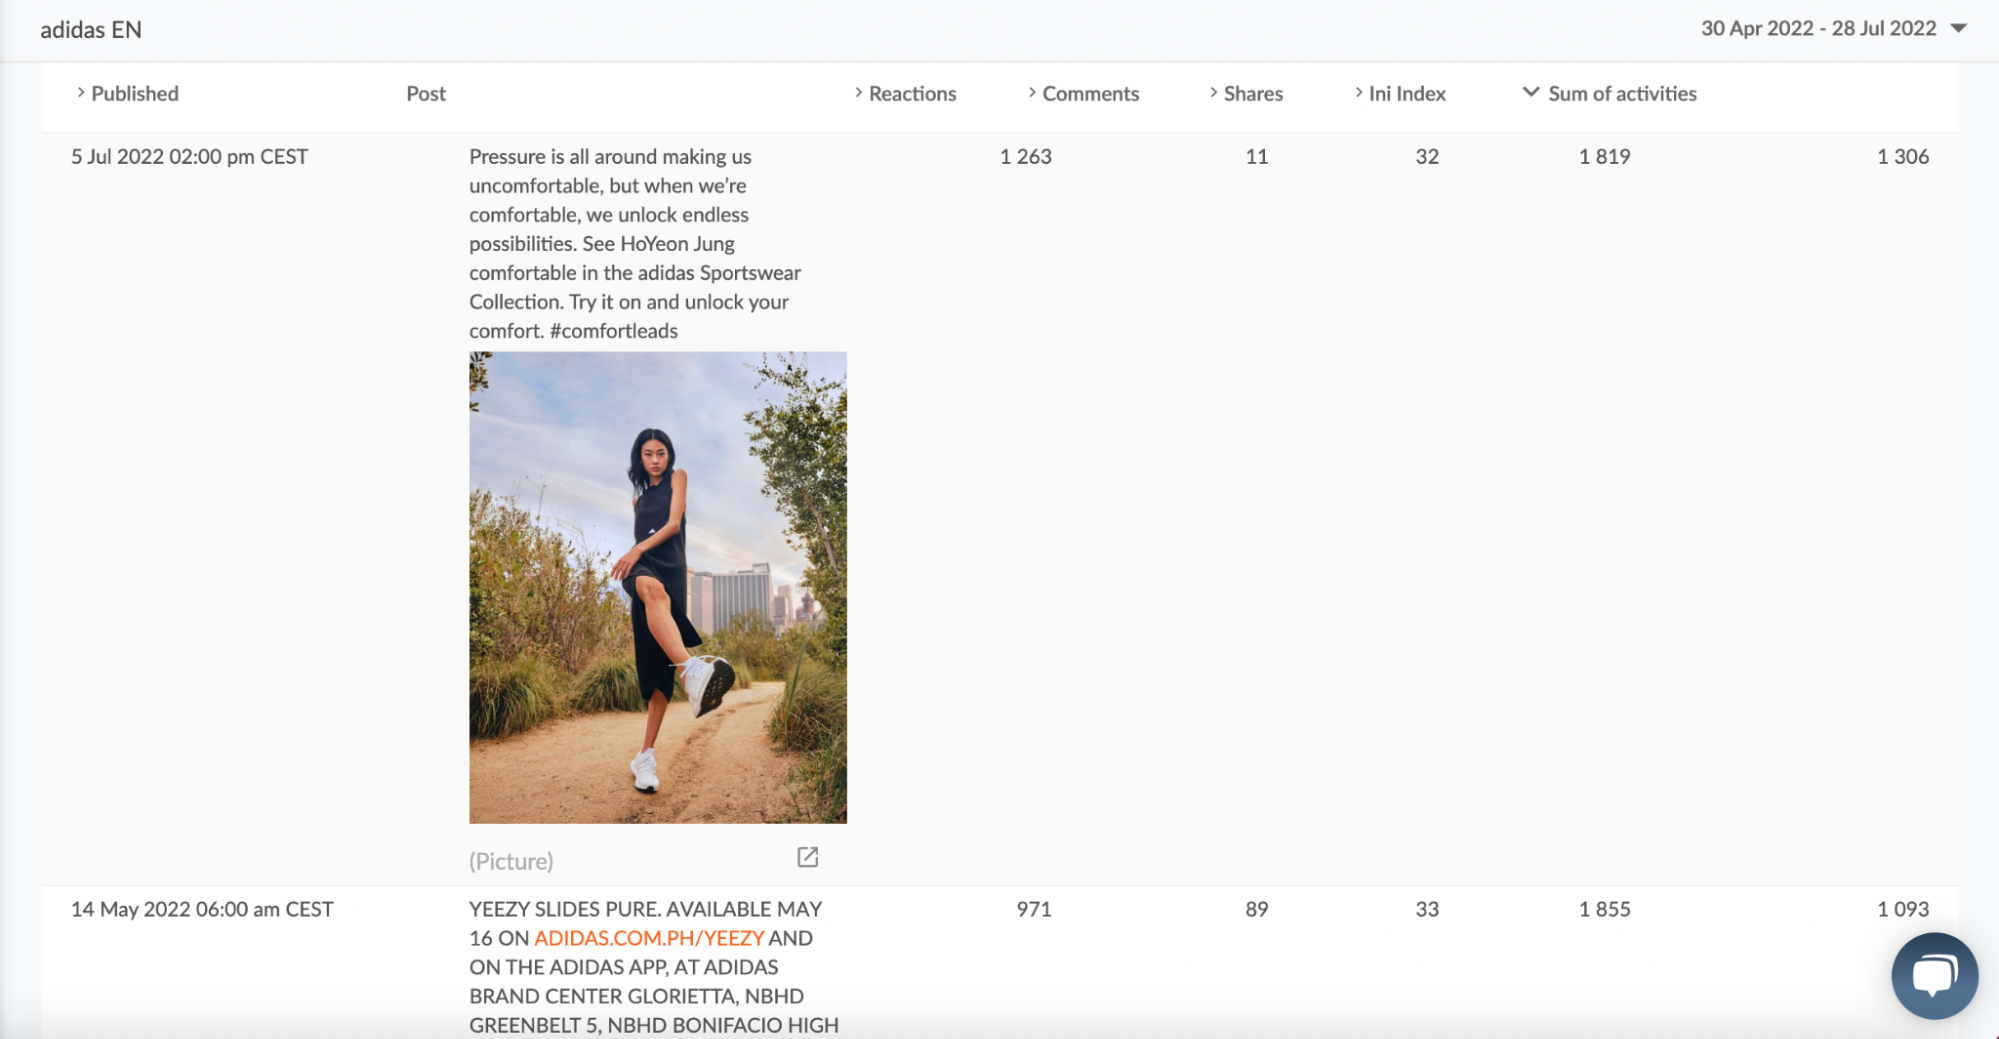
Next to each post, you will see their statistics: post reactions, comments, shares, InI index as well as sum of activities.
If you want to quickly see particular posts directly on your profile, just click on an arrow below a post and you will be taken to Facebook.

Are you focusing on video content? You can get some useful stats about them specifically, too.
Simply use a ‘Video views’ section to monitor the number of:
- video views,
- 10-second views,
- complete views,
- total watching time.
Track competitors’ content strategy with ease
If you lack ideas for your content calendar, or simply, you want to check what your competitors’ are posting, we’ve got good news for you. Checking competitors’ content activity in Sotrender is as easy as checking your own.
Simply enter the Facebook profile name you want to analyze, and catch all useful stats: how often do they publish, what types of content do they use, what are their top posts etc.
What is more, you can create a comparison group for Facebook profiles to compare different brands’ content and other stats. Below, you can see a post types chart for 4 different car brands. As you can notice, last month, Mercedes-Benz was focusing on photo content, while Mazda was posting mostly links and videos, with a little use of photos.
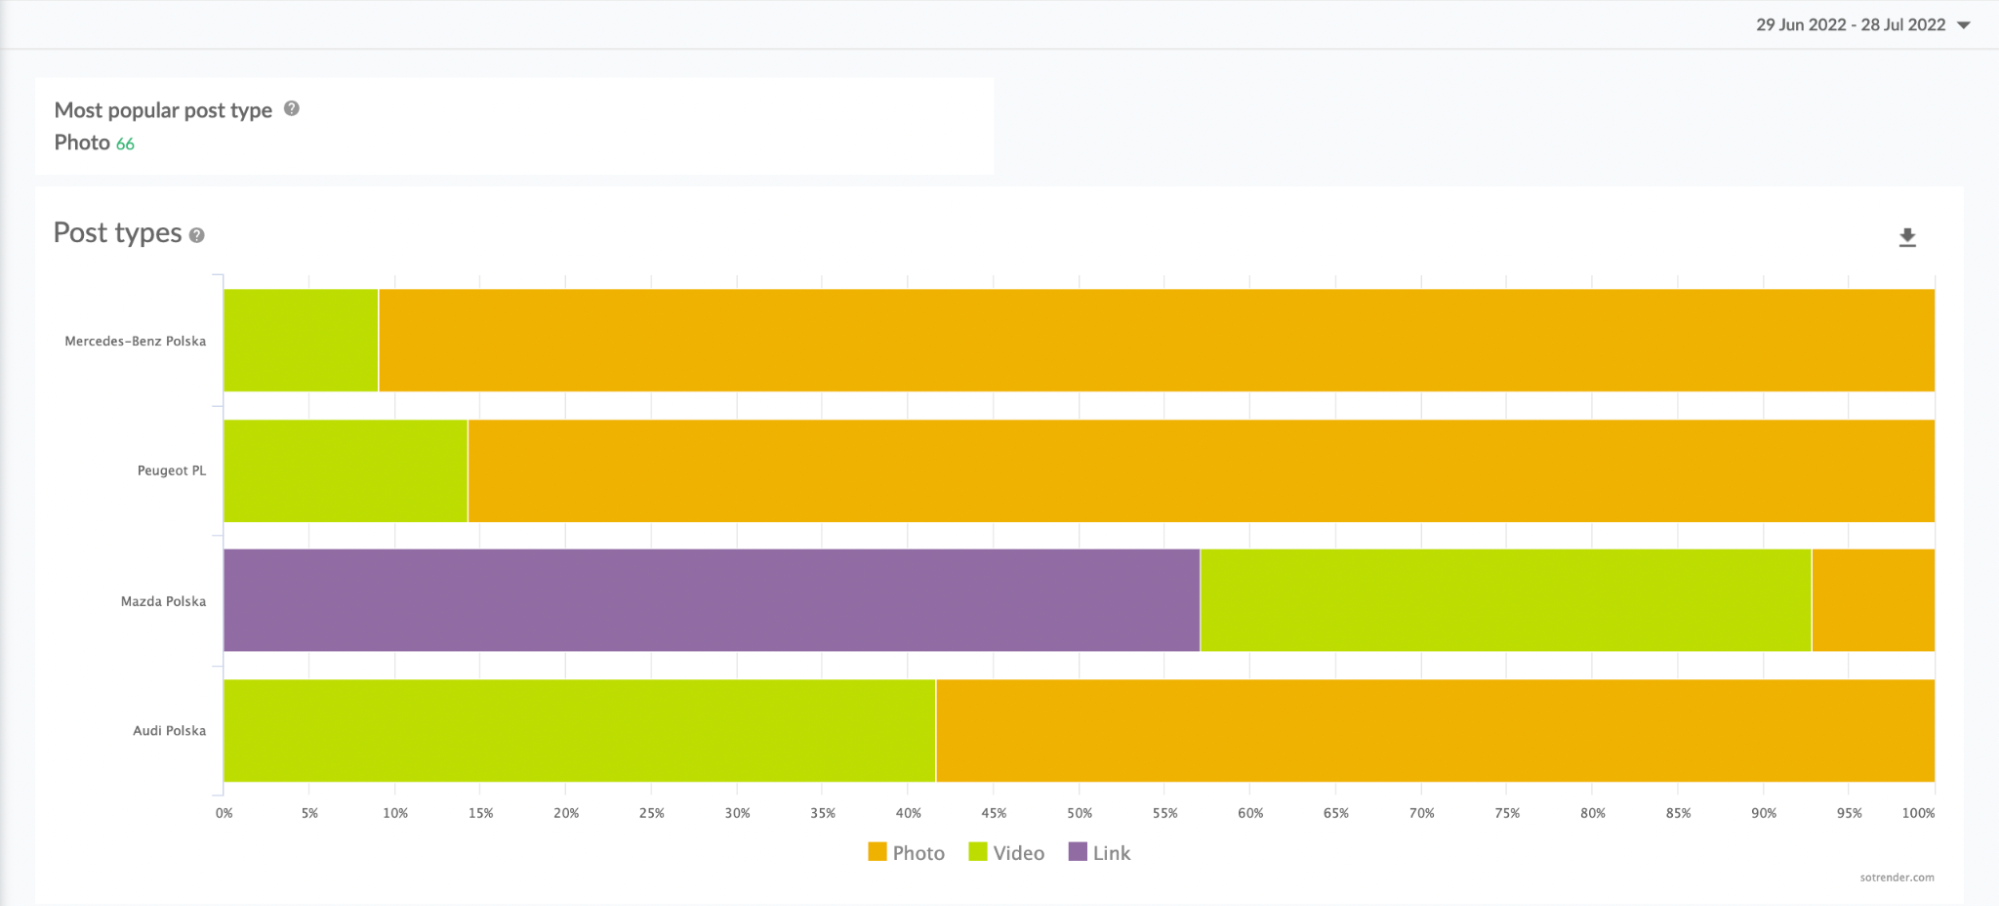
This clearly shows that brands might use different content strategies to engage their users. For sure, there is no universal method that would be a guarantee of success for each and every brand, but it is always worth it to get inspired by others.
Stay on top of things
Keep tracking your content performance systematically, and sooner or later you will figure out what works for you best. A thorough content analysis might help you to achieve bigger engagement on your social media profiles.
Remember, content plays a crucial role in social media marketing, so every effort put to improve your strategy is really worth it!