Instagram Stories are the hottest content type on the platform. It’s promoted by Instagram, it gets better reach and people love it, even though it’s very ephemeral type (Stories disappear after 24 hours). But did you know that you can analyze their performance?
If you have a personal account on Instagram, you can only see who saw your Story. You get more data when you switch to a Business Profile. After that, you get access to Instagram statistics from the app itself. It’s not very convenient – if you want to do a comparative analysis, analyze your performance in a longer period of time, see which Stories performed the best, it would be tedious and tiresome.
Did you know that there are special tools designed to help you understand the Instagram stats and show them in one place in a comfortable way? Sotrender is a social media analytics tool with developed Instagram analytics. You can analyze your performance, followers (not only their demographics but also when they are online, their actions on Instagram), content and even benchmark with and follow your competitors. Cool, right?
All you have to do is to have an Instagram Business Account (you can learn how to convert your personal profile into Business Account in this article) and create an account in Sotrender here. After that you get an access to all the data you need to analyze your performance and become social media king and your brand benchmark for others.
That’s not all. You can analyze Stories in Sotrender, too.
You get following metric for each Story:
- reach
- impressions
- replies
- exits
- taps forward
- taps back

Knowing that data, you can decide what Stories were the most engaging for your followers, which caused the highest number of reactions and which Stories your followers didn’t like. And knowing all that, you can improve your Stories, make them as engaging as ever.
But you know, analyzing Instagram Stories is important, but you should also analyze performance of your posts, too.
Kickstart your Instagram performance analysis
Analyzing your Instagram performance is crucial to understanding how your content is resonating with your audience. With Instagram Stories analytics, you can gain valuable insights into your account’s performance and make data-driven decisions to optimize your content strategy. To start analyzing your Instagram performance, you need to have a business or creator account. This will give you access to Instagram Insights, which provides detailed analytics about your account’s performance. By leveraging these insights, you can tailor your content to better engage your audience and achieve your social media goals.
Understanding Instagram Story analytics
Instagram Story analytics provides insights into how your stories are performing. The data is categorized into three main types: Reach, Impressions, and Engagement. Reach signals how many unique users viewed your story, while Impressions signal how many times your story was displayed to users. Engagement signals how users interacted with your story, including likes, comments, and saves. Understanding these metrics is essential to optimizing your Instagram Stories strategy and creating content that resonates with your audience. By analyzing these metrics, you can identify what works best for your followers and refine your approach to maximize engagement.
Accessing Instagram Story data
To access your Instagram Story data, you need to have a business or creator account. You can view your Instagram Story analytics using Instagram’s native Insights and reporting with tools like Sprout Social. Instagram aggregates your Stories data for up to two years, allowing you to track your performance over time. To view your Instagram Story analytics, tap the menu icon in the top right corner of the Instagram app, then tap Insights. From there, you can select the type of content you want to view, including Stories. This will provide you with a comprehensive overview of your Stories data, helping you to make informed decisions about your content strategy.
Start analyzing your Instagram performance
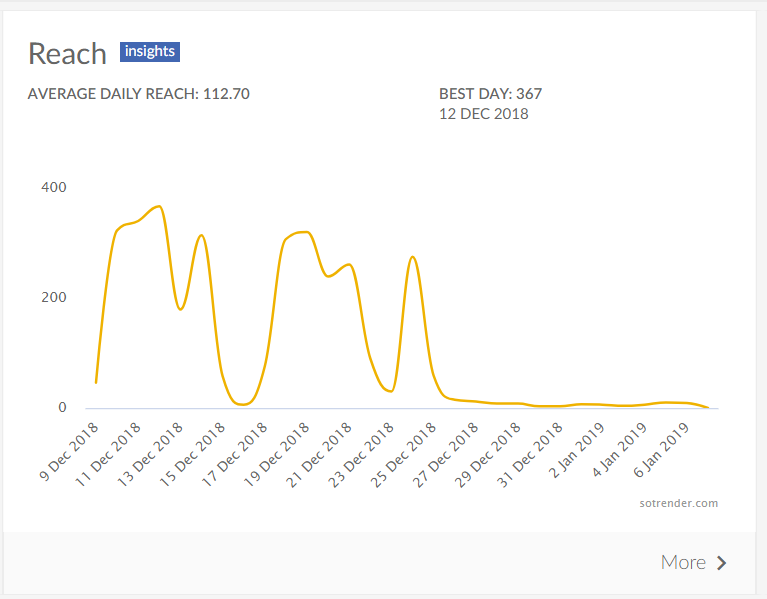
The most basic (but still incredibly important) indicator of the effectiveness of your performance is reach. It shows how many users saw your content. If someone saw your content more than once, they still count as 1 in this metric. Sotrender offers you a deeper Instagram reach analysis – you can also check, which day of the week is the most effective for you to post.
Additionally, tracking various Instagram Stories metrics is crucial for understanding performance. These metrics, such as Discovery, Navigation, and Interactions, provide insights into how users engage with your Stories and can help optimize your content strategies.

Metric quite similar to Reach is Impressions. It indicates how many times your content was seen on social media. One user can view your content more than once and each it appears in their content counts. That’s why Reach can never be higher than Impressions. Just like with Reach, you get a deeper analysis of Instagram Impressions. We break down our impressions over days of the week, so you can see, when to post, but that’s not all.
You can also analyse how many Impressions different kinds of post – photos, videos and carousel – had. It can help you in deciding what is most engaging for your audience.
Get the most of your audience with account insights
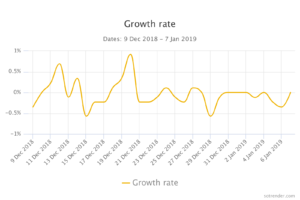
A good social media marketing specialist knows everything about their brand’s audience. In Sotrender you can analyze its number – that’s obvious – its growth and growth rate. Understanding Instagram Stories performance helps in refining content strategy by identifying top-performing content and tracking engagement metrics like click-through rates.
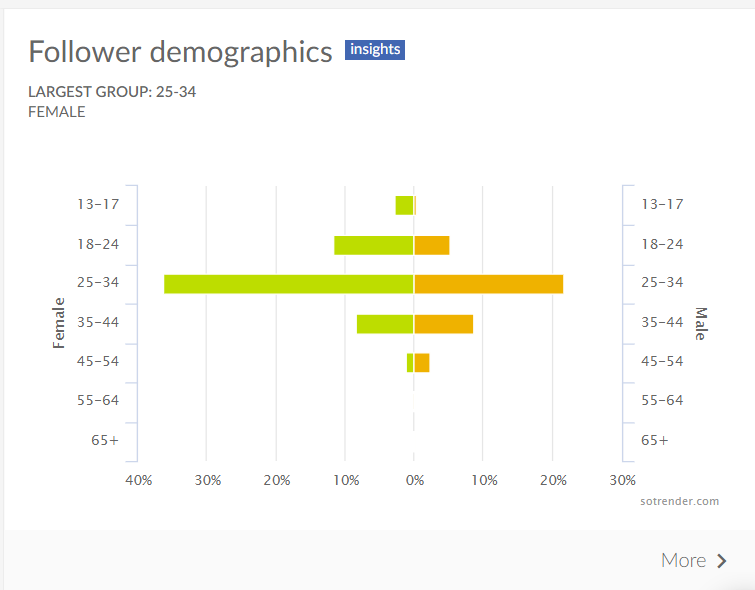
We offer you also a deeper analysis of their demographic data – gender, location (country and city) language they use on Instagram. All this data gives you knowledge about how to communicate with them.
Key Metrics for Instagram Stories Strategy
When it comes to Instagram Stories strategy, there are several key metrics to track. These include:
- Reach: The number of unique users who viewed your story.
- Impressions: The number of times your story was displayed to users.
- Engagement: The number of likes, comments, and saves on your story.
- Story Replies: The number of Instagram DMs you received on your story during its lifetime.
- Story Taps Back: The number of times people tapped to return to your previous story.
- Story Taps Forward: The number of times people tapped your current story to move on to your next story.
- Story Exits: The number of times people swiped to stop viewing your story during its lifetime.
Tracking these metrics will help you understand how your audience interacts with your Stories and what content resonates most with them. This information is invaluable for refining your Instagram Stories strategy and creating more engaging content.
Analyzing Instagram Story Performance
Analyzing your Instagram Story performance is essential to optimizing your content strategy and creating content that resonates with your audience. To analyze your Instagram Story performance, you can use Instagram Insights to track key metrics such as reach, impressions, and engagement rates. You can also use third-party tools like Sprout Social to access more detailed analytics and track your performance over time. By analyzing your Instagram Story performance, you can identify top-performing content, including most viewed, most engaged, and most clicked stories. You can also use data to inform future content creation and marketing strategies, and refine your content strategy to better resonate with your target audience. This continuous analysis and adjustment will help you stay ahead in the ever-evolving social media landscape.
Read More:
Author
Michał Wieczorek
Content Marketing Specialist
Baltic linguist, marketer, and music journalist in his free time. A big fan of good food and even better music.


