
Getting likes and followers on social media feels great. But real business success happens when user engagement drives sales, leads, or boosts customer lifetime value (LTV).
In this guide, we’re breaking down what social media engagement really means, why it matters for your business, and how to link it directly to your key performance indicators. 👇
What is social media engagement, and how does it tie into business KPIs?
Social media engagement is a window into how audiences truly interact with your brand.
Engagement reflects your audience’s interest, connection, intent, and overall customer engagement with your brand. When you measure and analyze correctly, it helps you understand what content works and why it influences downstream business metrics such as leads, conversions, and LTV.
In practical terms, engagement data (likes, shares, comments, video views, saves) are key engagement metrics and social media metrics that reveal what resonates with your target demographics.
Your job as a marketer or strategist is to translate these signals into measurable business outcomes.
- 7 days for free
- No credit card required
- Access to all premium features during trial
Why engagement data matters for growth
Think of social media engagement as one of the key ways to measure brand awareness and audience intent.
When you correlate engagement with revenue‑based KPIs, you uncover exactly which campaigns or social media posts drive meaningful results.
You’ll be able to:
- Increase customer lifetime value (LTV). Engaged users can become loyal customers or advocates through repeat purchases and referrals.
- Refine audience targeting to segment high‑intent users or repeat engagers for remarketing.
- Identify what content converts so you can optimize future social media campaigns and ad spend.
For many brands, this correlation shows which posts perform well and which strategies deliver sustained ROI, from Meta Business Suite ads to influencer collaborations on Instagram Live or Live Shopping sessions.
For example, niche perfume brands rely on storytelling, exclusivity, and community discovery to engage audiences on platforms like Instagram and TikTok. Connecting social media engagement to KPIs such as sales, qualified leads, and LTV helps these brands see which interactions really matter.
Now let’s get into the HOW. 👇
Measure meaningful engagement (beyond likes)
Uncover what reflects authentic interest or potential for conversion.
Not all engagement is created equal. Social media analytics must go deeper than vanity metrics like page likes or followers. Though these metrics still matter and can signal traction, high‑value interactions give you more meaningful information.
For example:
- DMs, mentions, or user‑generated content (UGC) reveal community involvement or brand advocacy.
- Comments and discussions show emotional or intellectual connection.
- Shares and reposts help expand reach and demonstrate trust.
- Saves or link clicks indicate buying or research intent.
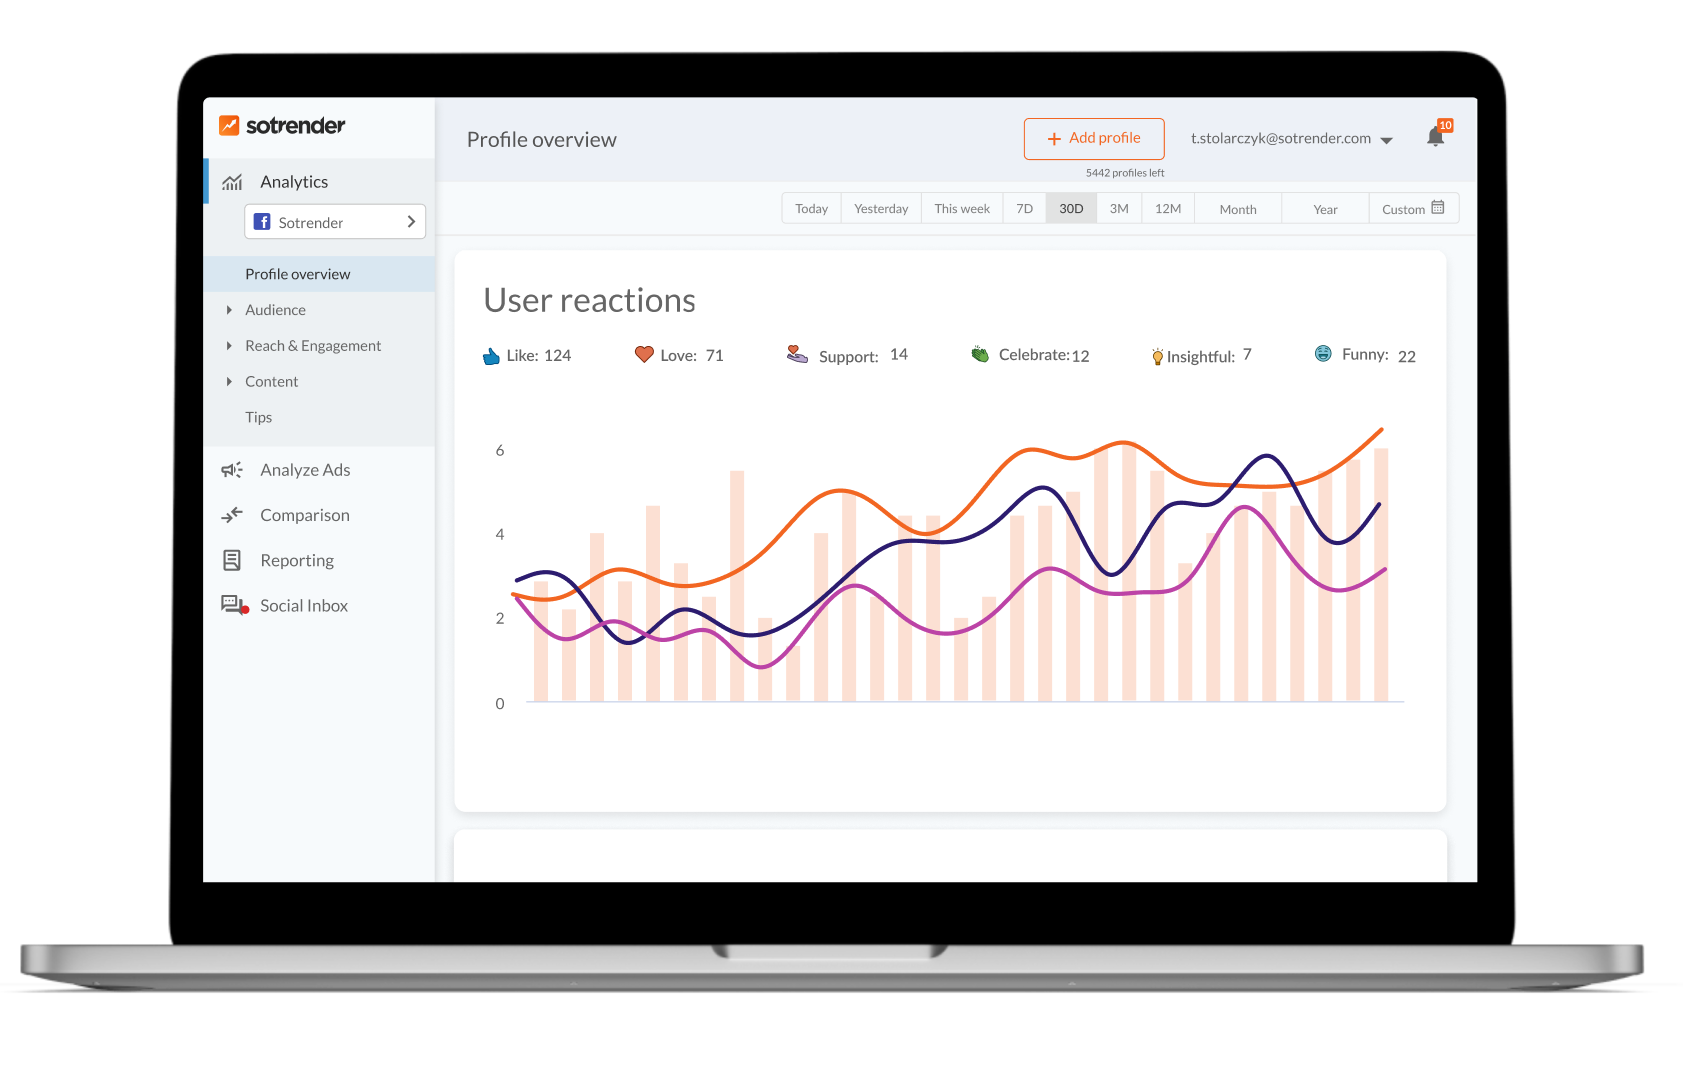
Use a social media analytics tool (like Sotrender) to filter raw engagement data and identify deeper signals. Use its social listening tool to capture tone, intent, and context in user feedback.
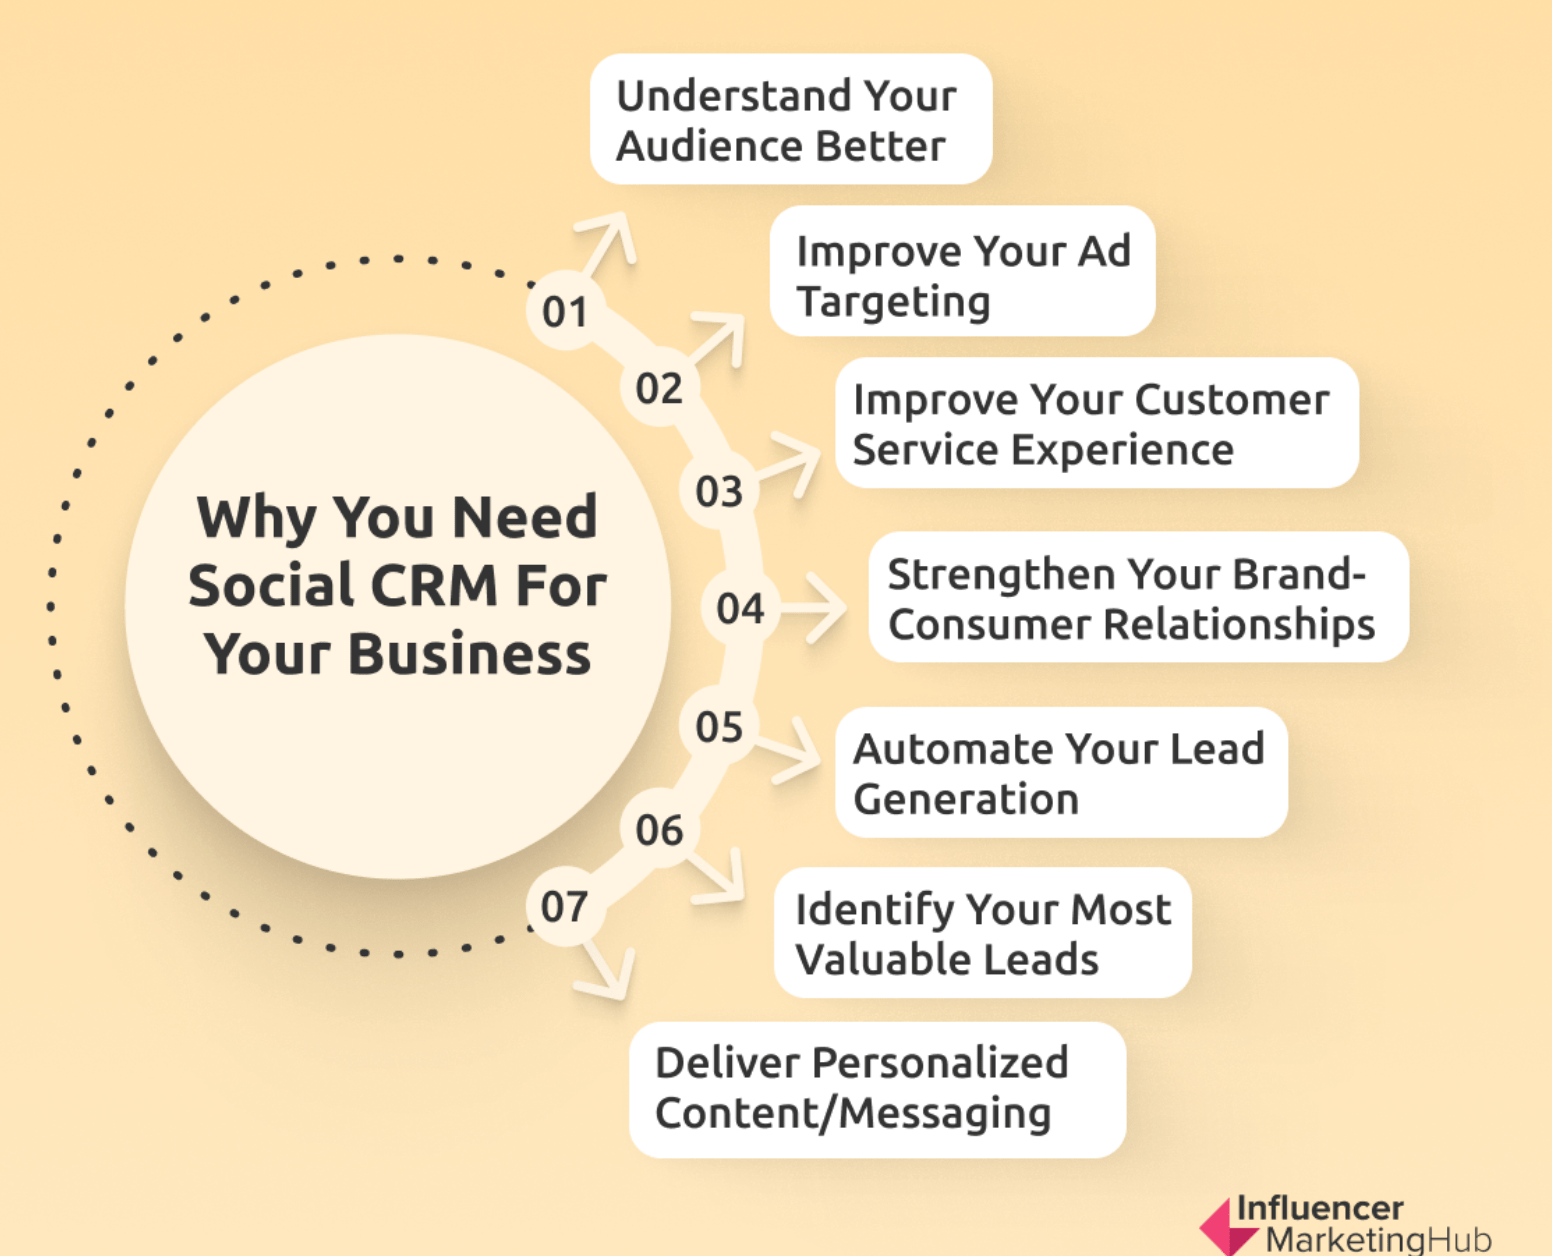
A social CRM is also immensely helpful.
Instead of celebrating a viral post that delivered 10K likes, analyze whether it drove profile clicks, sign‑ups, or product page traffic in Google Analytics. That’s what defines true performance.
Connect engagement data to hard KPIs
Once you’re clear on what constitutes valuable engagement, the next challenge is to tie it back to business outcomes such as sales, leads, and LTV.
Financial services companies actually deal with this problem a lot, partly because their customers don’t just make a one-time purchase and disappear. Take Abacus, for example — they work with life insurance policies, wealth management, and asset management, and they maintain relationships with around 30,000 financial advisors.
For a business like that, a spike in social media engagement has limited meaning on its own. What actually matters is whether that engagement connects to something measurable. For example, a new advisor partnership, a policy inquiry, or a client that generates sustained value.
That’s the same logic that applies to almost any business trying to make sense of its social media numbers.
Engagement is only worth tracking if there’s a clear line between it and the KPIs that actually move the needle.
Here’s a solid framework you can follow to connect data to KPIs:
- Integrate platforms. Connect your social analytics tools (like Sotrender) with your CRM (e.g., HubSpot, Salesforce) and web analytics (Google Analytics 4). This unified view lets you trace engagement all the way through to conversions.
- Use multi‑touch attribution. Engagements often happen long before a conversion. Multi‑touch models let you credit each interaction (from a share or video view to a final purchase) so you can understand how each channel contributes.
- Map the entire customer journey. Build a funnel view showing touchpoints. For example, discovery (social), consideration (website or email), and conversion (CRM or ecommerce).
- Tag campaigns consistently. Use UTM codes to link specific posts or influencers to measurable outcomes in analytics dashboards.
For example, a user might watch an Instagram Reel (discovery), then click the profile link to your landing page (consideration), and eventually buy after seeing a retargeting ad via Google Ads (conversion).
Multi‑touch data connects those dots, giving engagement real business weight.
The key metrics worth tracking
To make sense of your engagement in correlation with KPIs, track both quantitative and qualitative metrics.
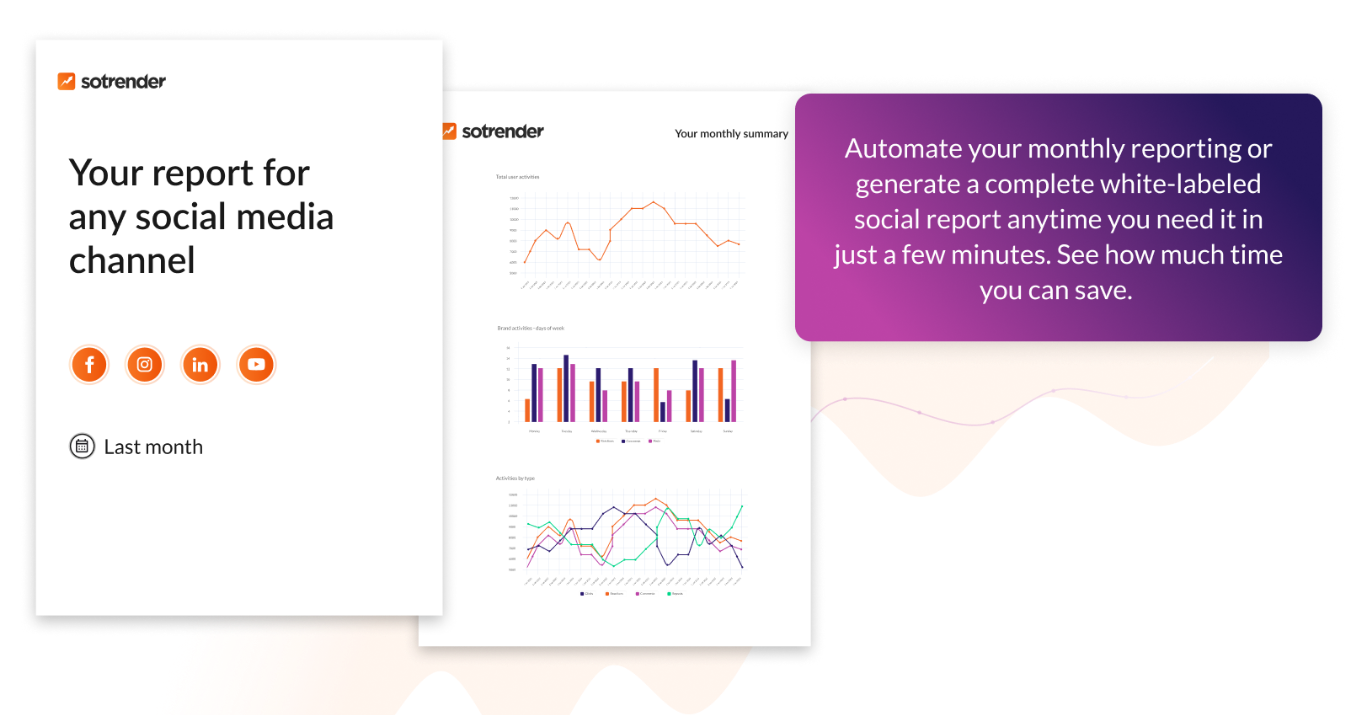
Review these metrics regularly in your social media analytics report or dashboard to track how engagement trends align with sales or other KPIs:
- Engagement rate: The percentage of followers who interact with your content. Tools like an Instagram engagement rate calculator or public engagement rate metrics help normalize this across platforms.
- Conversions and assisted conversions: Reveal how social touches contribute to leads or purchases.
- Click‑through rate (CTR): Connects engagement to real movement towards conversions.
- Audience growth and retention: Show whether engagement translates into sustained interest.
- Saves, shares, and comments: Indicate strong content resonance or conversion intent.
More on qualitative data in a bit.
How often to analyze engagement trends
Choose an analysis frequency that meets your specific goals and reporting structure.
For example, a weekly analysis is great for short‑term tactical insights. It helps you evaluate what resonated, which posts drove traffic, and how engagement rate fluctuated with posting schedules or content types. You can then tweak your content approach week by week.
A monthly or quarterly analysis is better for identifying macro trends.
You’ll discover seasonal engagement patterns, LTV shifts, or ROI from sustained campaigns like influencer marketing or Live Shopping events.) This helps you plan your content further in advance, based on tactics that are working.
For example, a content calendar review every Monday might help fine‑tune daily creative direction. While a quarterly social media audit may evaluate content strategy alignment and goal attainment.
You can also take a look at internal execution. Some organizations use employee monitoring software to understand how social media teams allocate time across campaigns, content formats, and channels. While not a direct measure of performance, this operational data can help explain why certain initiatives produce stronger business outcomes than others.
Consistency is key either way. Regular analysis prevents you from overreacting to one viral week or misreading a temporary dip due to Newsfeed algorithm changes.
Normalize engagement across platforms
Understand engagement across platforms. Keep in mind that each platform measures engagement differently, so a direct comparison can be misleading.
Take a look at Buffer’s research on average engagement rates, for instance:
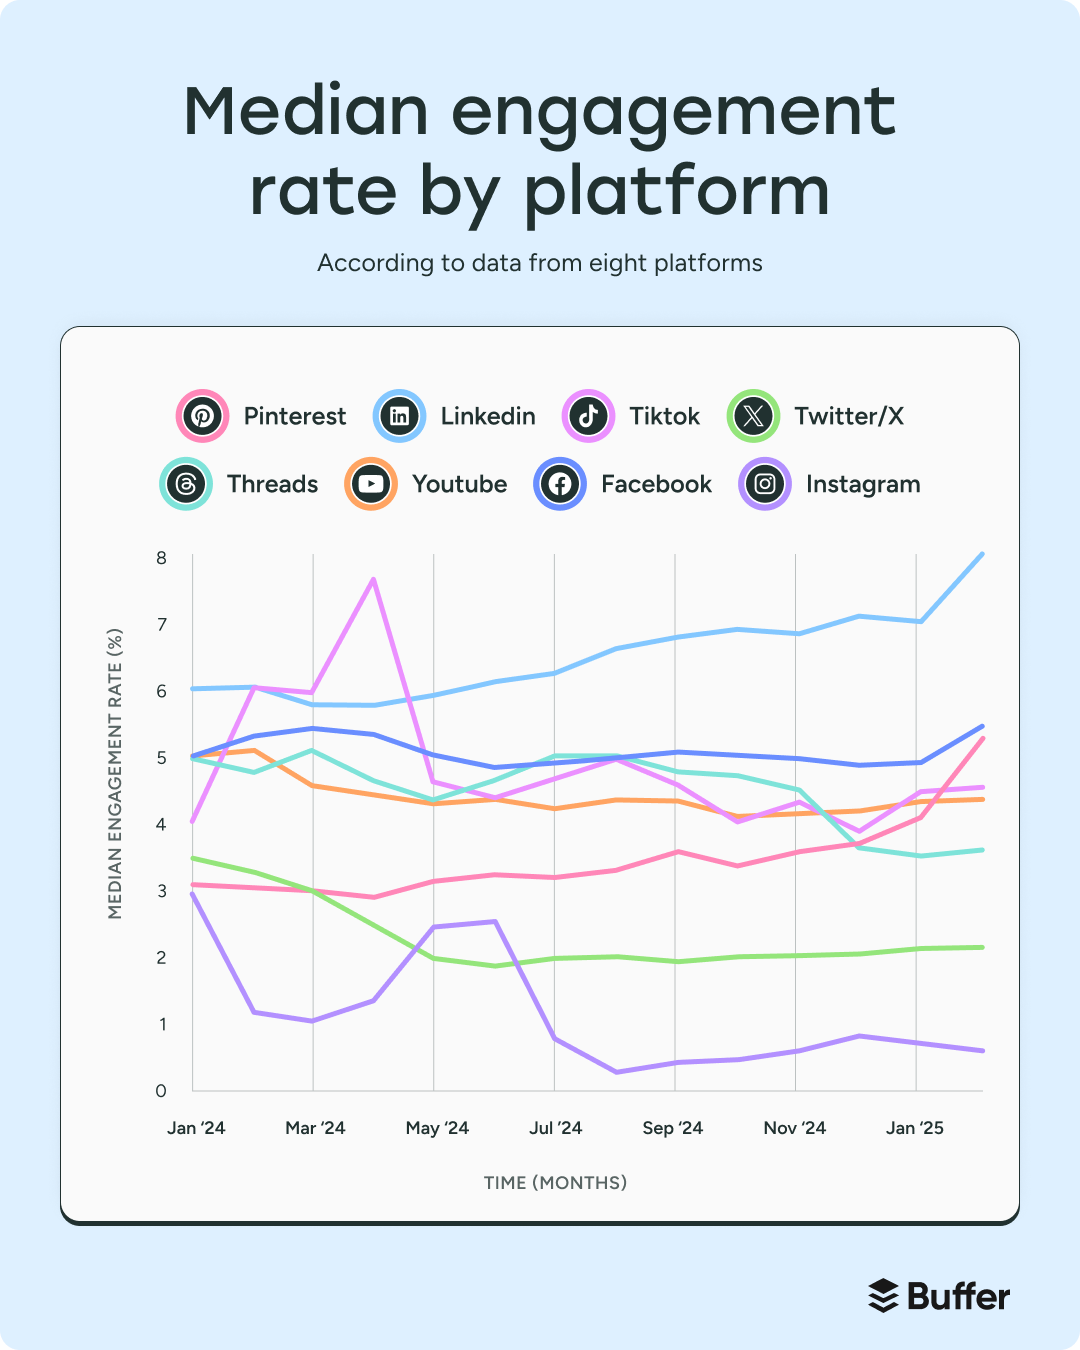
As you can tell, the median engagement rate varies widely by platform.
LinkedIn, for instance, leads all platforms with a 6.50% median engagement rate (which grew two percentage points in just one year).
Instagram, on the other hand, has the lowest average engagement rate. A shocking 1.16%.
To make informed decisions, accept that performance metrics adjust by channel. But still have a baseline to aim for.
Here’s what to do:
- Set a conservative baseline: an engagement rate of 2–3% works well as a universal benchmark. It’s above Instagram’s median of ~1.16% but below LinkedIn’s ~6.5%, giving you a realistic middle ground for cross-platform comparison.
- Adjust for audience size. A small audience with high activity may indicate better quality engagement than a large, passive following. This is why nano- and micro-influencers help brands get more traction.
- Track platform‑specific nuances. For example, “saves” on Instagram indicates intent, while “retweets” on X (Twitter) signal virality.
You can also build your own formula or adopt a tool that standardizes reporting, like Sotrender.
Sotrender is a social media analytics platform that aggregates performance data from major social networking platforms, such as Facebook, Instagram, TikTok, and X. It can also report on additional networks depending on your setup.
It tracks KPIs like reach, engagement, and ad performance, and its historical data makes it easy to calculate typical engagement levels across your profiles and content types. This gives you a clear performance baseline. You can also track your competitors’ engagement rates.
Doing this ensures your performance reports keep comparisons meaningful across social channels.
Add qualitative context to the numbers
Use sentiment analysis and contextual feedback to give depth to your engagement data.
Numbers show what happened. Qualitative data explains why.
Look beyond metrics through social listening and share of voice analysis. Monitor comments, mentions, and discussions to understand customer sentiment around your brand, products, or competitors.
Review emotional tone, feedback trends, recurring customer service requests, and overall social sentiment.
For example, a spike in engagement might seem great. But if sentiment analysis reveals users complaining about shipping delays, the business takeaway changes completely.
Similarly, tracking user‑generated content can reveal how customers perceive your brand experience. It’s also a great input for future brand-related content, since authentic customer voices can outperform polished ads in terms of engagement and trust.
Turn analysis into action
Use insights from your social analytics report to inform strategic decisions.
This is the most important part.
Here are some ways you might do that:
- Enhance customer experience. If comments show dissatisfaction at a particular stage (e.g., customer service requests), coordinate with customer support teams.
- Refine targeting. Use CRM‑linked insights to retarget engaged users or upsell to high‑LTV segments.
- Improve campaign timing. Align future posts with peak engagement windows found in your analytics.
- Optimize key content pillars. Double down on topics that consistently drive conversions.
Let’s say you spot a pattern — posts featuring behind‑the‑scenes videos perform 30% higher in engagement and correlate with new sign‑ups. That data should directly shape your next content creation plan and ad creative choices.
Over time, applying these insights refines your content AND your overall social media strategy. This can lead to stronger funnels and higher ROI across your marketing tools.
Avoid these common mistakes when tracking engagement
Even advanced marketers can fall into traps when correlating engagement with business KPIs.
Here are a few to watch out for:
- Assuming correlation implies causation. Just because engagement went up when sales did doesn’t mean one caused the other. Use controlled tests and attribution models to validate your assumptions.
- Focusing on vanity metrics. Follower count or video views can be misleading if they don’t convert. Always question whether engagement translates into tangible outcomes.
- Ignoring the funnel stage. Engagement at the awareness stage usually looks different from engagement closer to conversion. Tailor your analysis accordingly.
- Poor data integration. Without connecting your social media management tools and CRMs, you’ll never get a full view of engagement’s business impact.
Avoiding these pitfalls ensures your reporting remains credible … which is vital when presenting performance metrics to executives or clients.
Wrap up
Correlating social media engagement with business KPIs takes practice. But with the right tools and methodology, you can start identifying what meaningful engagement looks like for your brand.
Connect the dots between those interactions and the outcomes your business truly values: Leads, sales, and lifetime customer value.
When done right, you’ll move beyond counting likes and into a cycle of continuous optimization — where each campaign produces measurable growth and every post plays a role in your business success story.
Want better insights into your social media engagement? Try Sotrender today.


