
Nobody asked for it, everyone needed it. Without a lengthy introduction, we present a Linkedin metrics guide covering all the LinkedIn metrics that marketers should pay attention to.
There are plenty of LinkedIn metrics, and even though some are clear-cut, there are a few that need a more thorough explanation. Especially given that some LinkedIn metrics are measured in a different way than, for example, the Meta ecosystem (Facebook, Instagram).
Let’s start with audience-related metrics.
Linkedin metrics: Audience
Visitors (page views)
This metric informs you how many people visited your Company Page over a selected period of time without following it.
It shows the total number of views of any and all of your organization’s pages (Home, About, etc.).
PRO TIP
In general, the higher the number of visitors, the better. However, the high number of visitors should have you wondering why many users only visit your Page and what’s holding them back from following it. Maybe they don’t see the value in following?
Unique visitors
This metric tells you how many unique visitors (in total) visited your Company Page over a selected period of time.
Unique visitors are calculated daily and are not de-duplicated over multiple days.
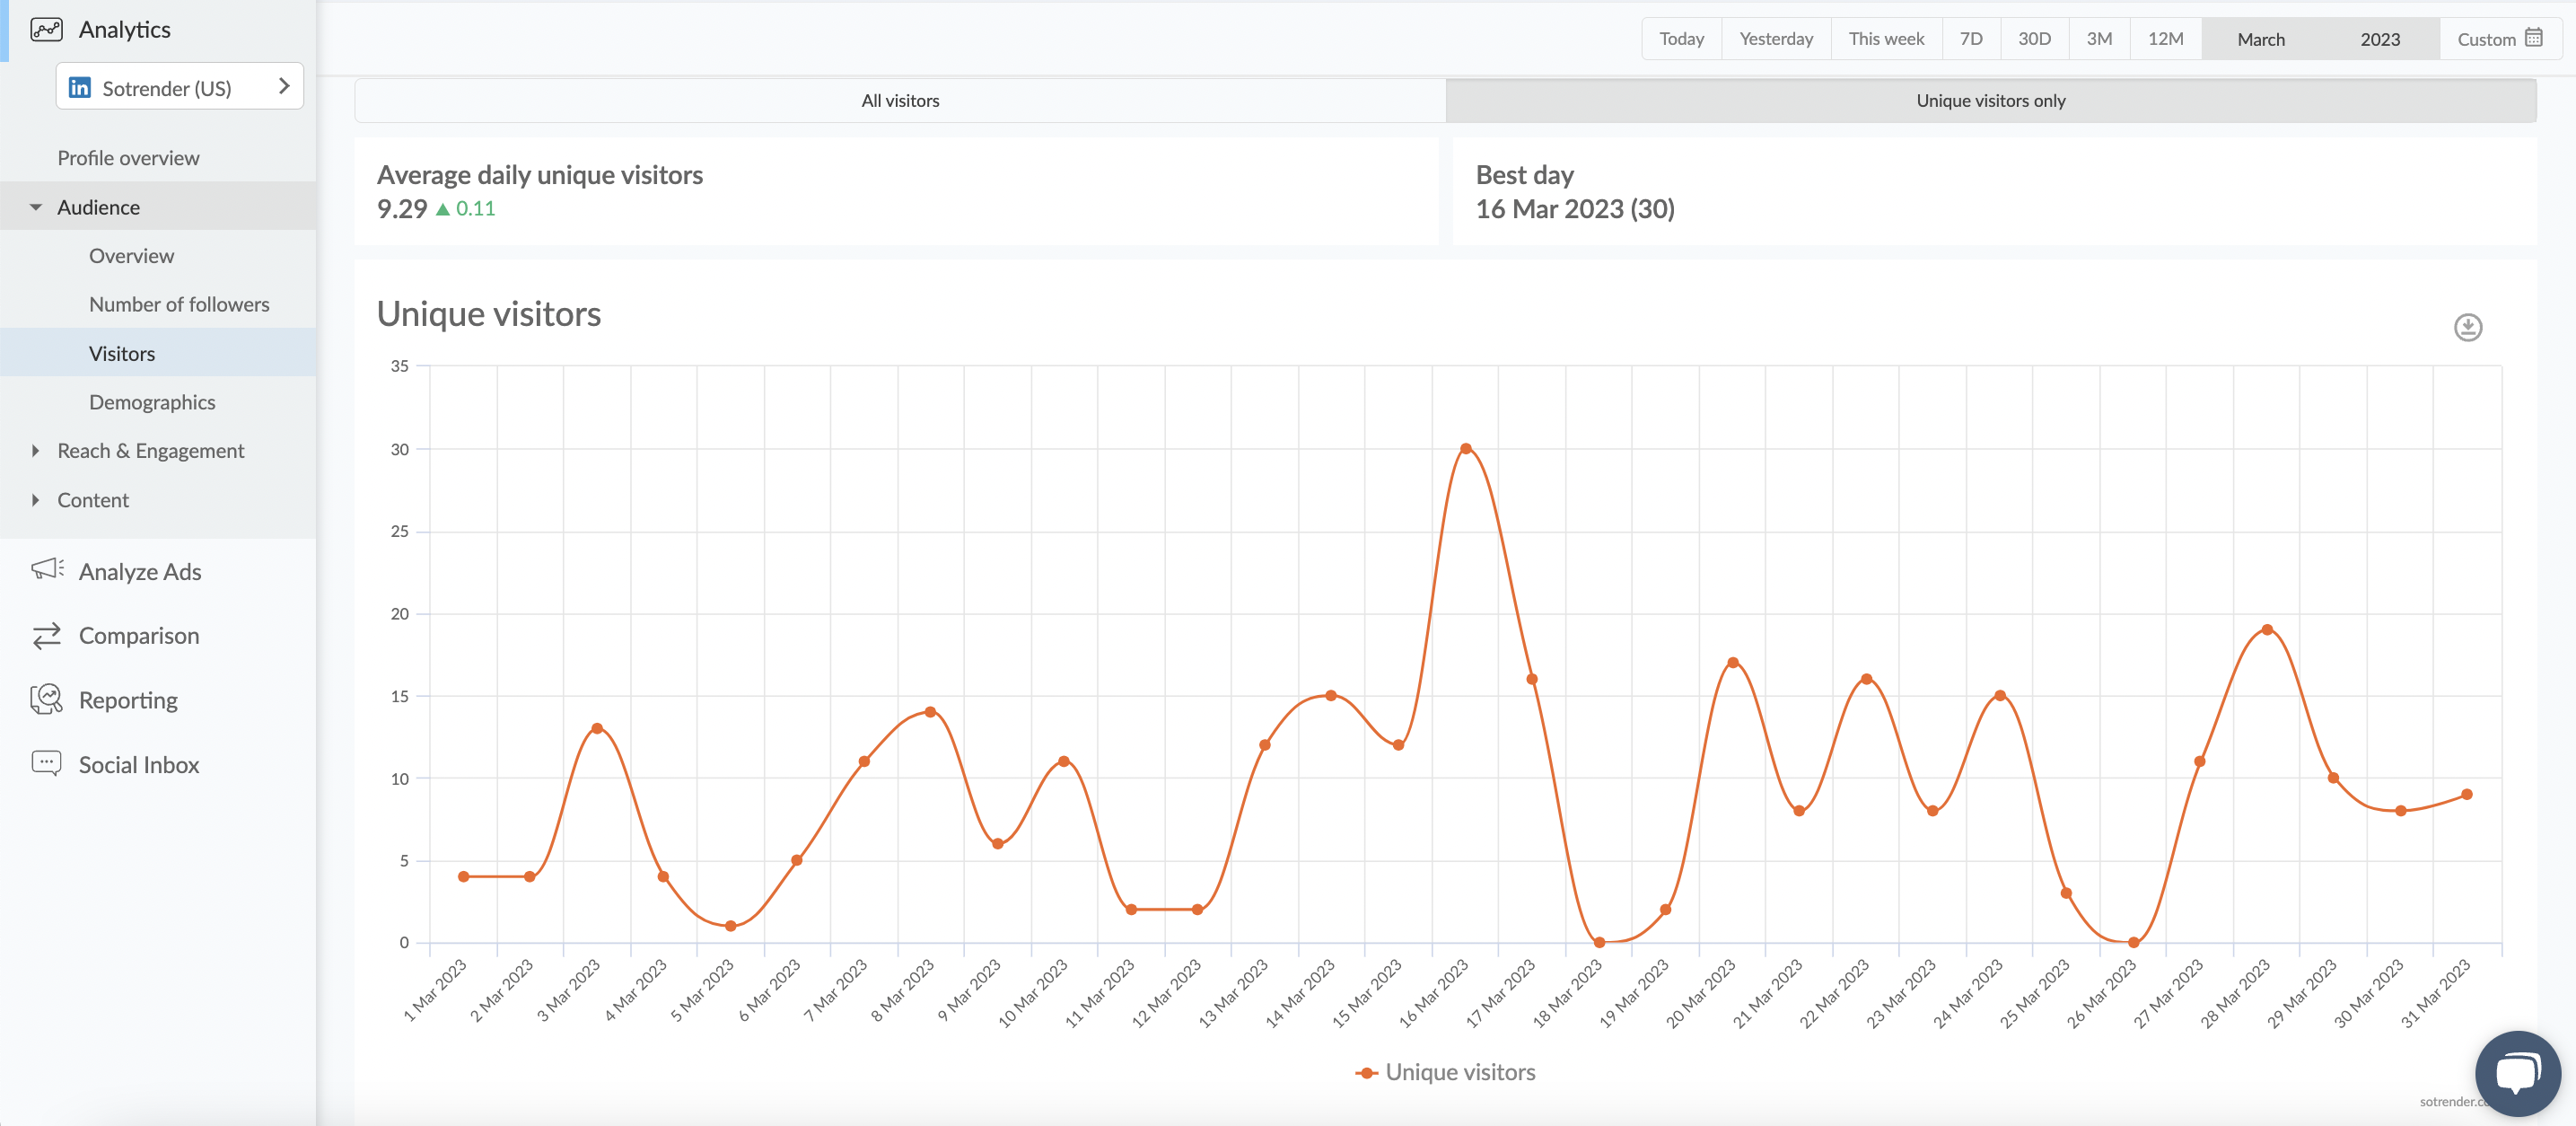
In Sotrender, you can monitor unique visitors with a daily chart.
PRO TIP
Unique visitors is a metric that informs you how many people are interested in your business. It’s especially worth monitoring when you’re running an ad campaign (with a brand awareness objective) or you’re trying to conquer new markets, for example.

Followers
This one is pretty straightforward – the number of followers is the number of people that follow your LinkedIn Company Page.
When it comes to page followers, this metric can be split into:
- Total followers – the total number of people who currently follow your Company Page.
- New followers – total new followers in the selected time period.
- Sponsored followers – total new followers gained through sponsored content or LinkedIn ads.
- Organic followers – total new followers gained only through organic content.
PRO TIP
It’s natural that the number of followers fluctuates over time. What you can do to intentionally grow your follower base is track which content was causing the highest follower growth.
By using Sotrender, you can easily check that. Simply go to the day-by-day followers growth chart and click on the day with the highest peak.
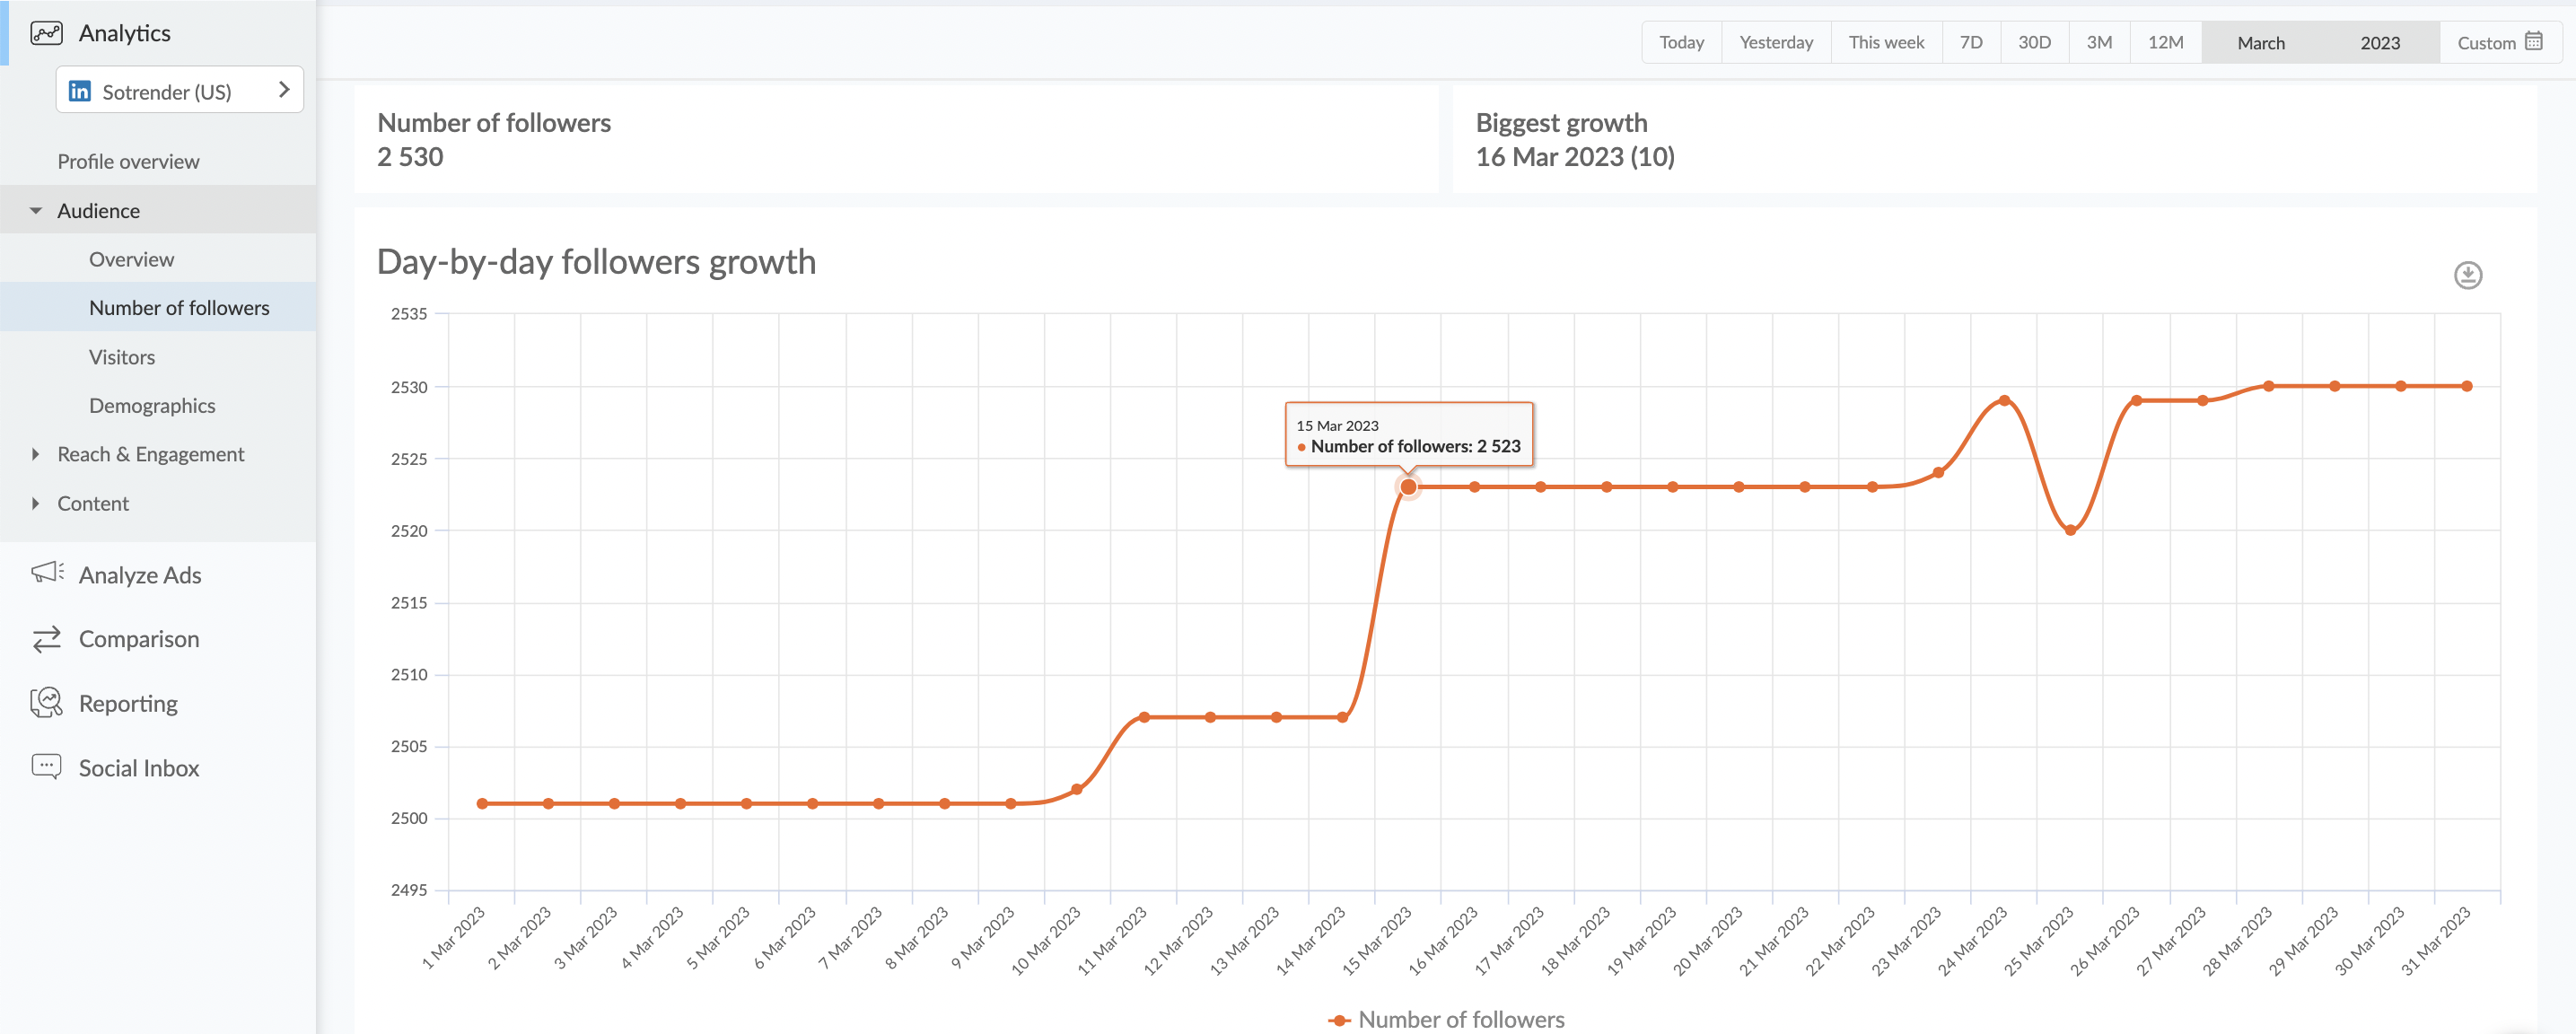
Checking follower growth in Sotrender
As you can see, Sotrender will also automatically tell you on which day was the biggest growth in the number of followers.
Although it’s good to have a large followership, as it ensures your brand credibility and trust, you shouldn’t get too crazy about this metric. It won’t be the only measurement of your success on the platform.
Demographics
On LinkedIn, unlike on Facebook or other social media channels, it’s possible to analyze more demographic user data, including:
- Industries
- Functions
- Seniority
- Company size
- City
- Country
Also, it’s possible to separately track the demographics of:
- Followers (people that follow your Page)
- Visitors (people who visit your Page without following it)
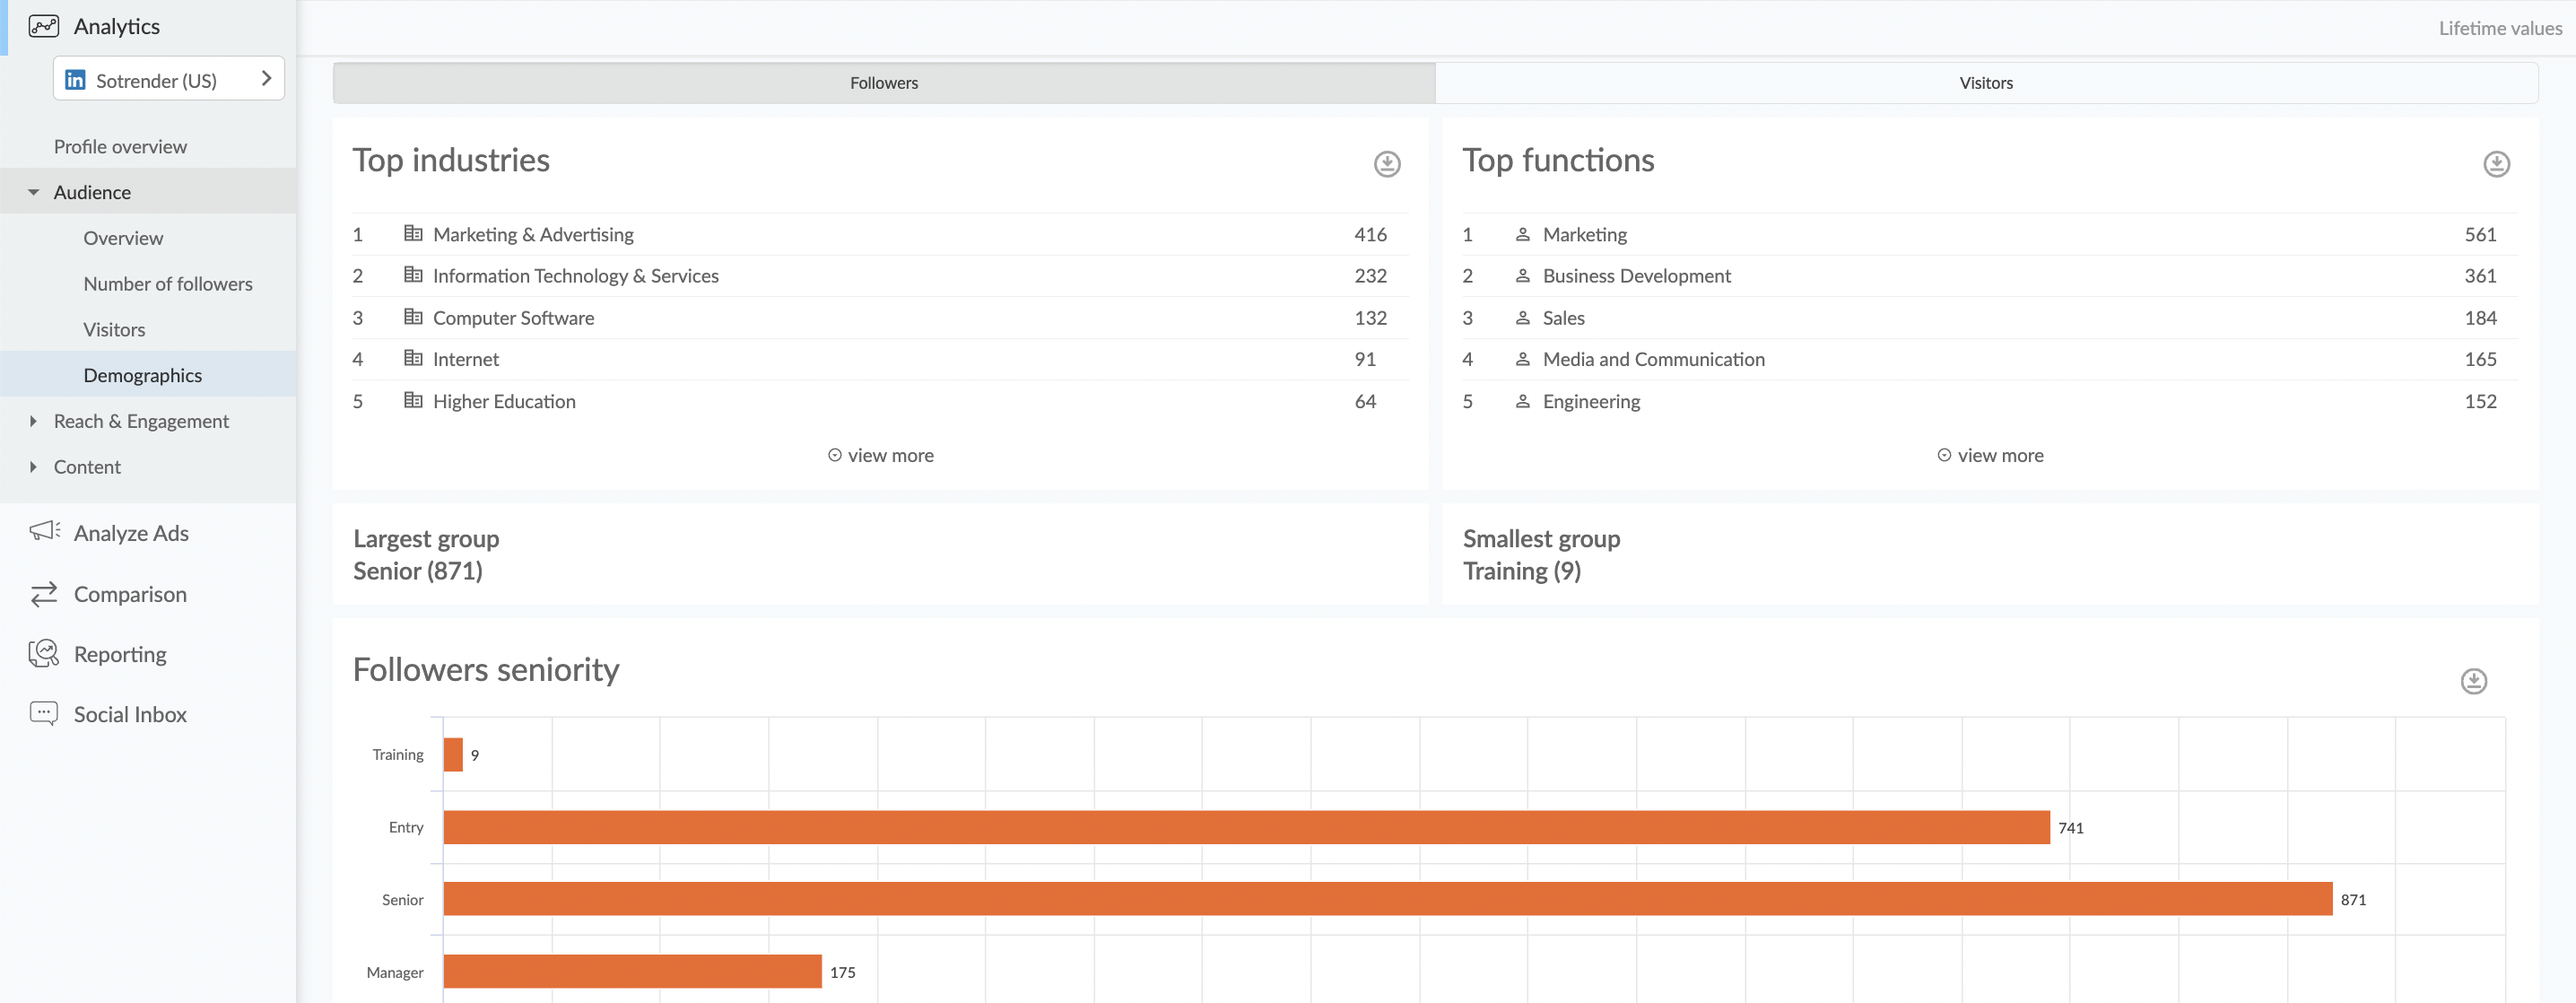
You can analyze your LinkedIn follower demographics in Sotrender
PRO TIP
Having access to so much demographic data can make the targeting of your LinkedIn ads much more effective.
Linkedin metrics: Reach & Engagement
When it comes to reach and engagement metrics, for LinkedIn these slightly differ from those on Instagram or Facebook.
Impressions & unique impressions
Impressions inform you of how many impressions your posts had.
This metric can be split into:
- Unique impressions – unique content views
- Organic impressions – organic content views
- Sponsored impressions – sponsored content views
An impression is counted once your content (post, article, etc.) was visible for at least 300 milliseconds.
Note that every time your content is viewed, even by one user, each time will be counted as one more impression. An exception is the unique impressions metric – in this case, for one post one user can be counted only once.
In Sotrender, there are also a few more impressions-related metrics (that are not available in LinkedIn’s built-in analytics).
- Total impressions – calculated as sponsored impressions + organic impressions
- Average daily impressions – these are daily impressions divided by the number of days which you’ve chosen for your analysis
- Average daily unique impressions – tells you how many unique impressions there were on average each day
- Average daily unique organic impressions – tells you how many unique organic impressions there were on average each day
- Average daily unique sponsored impressions – tells you how many unique sponsored impressions there were on average each day
In Sotrender, it’s also possible to analyze with one line chart all impressions and all unique impressions divided by type (total, sponsored, organic).
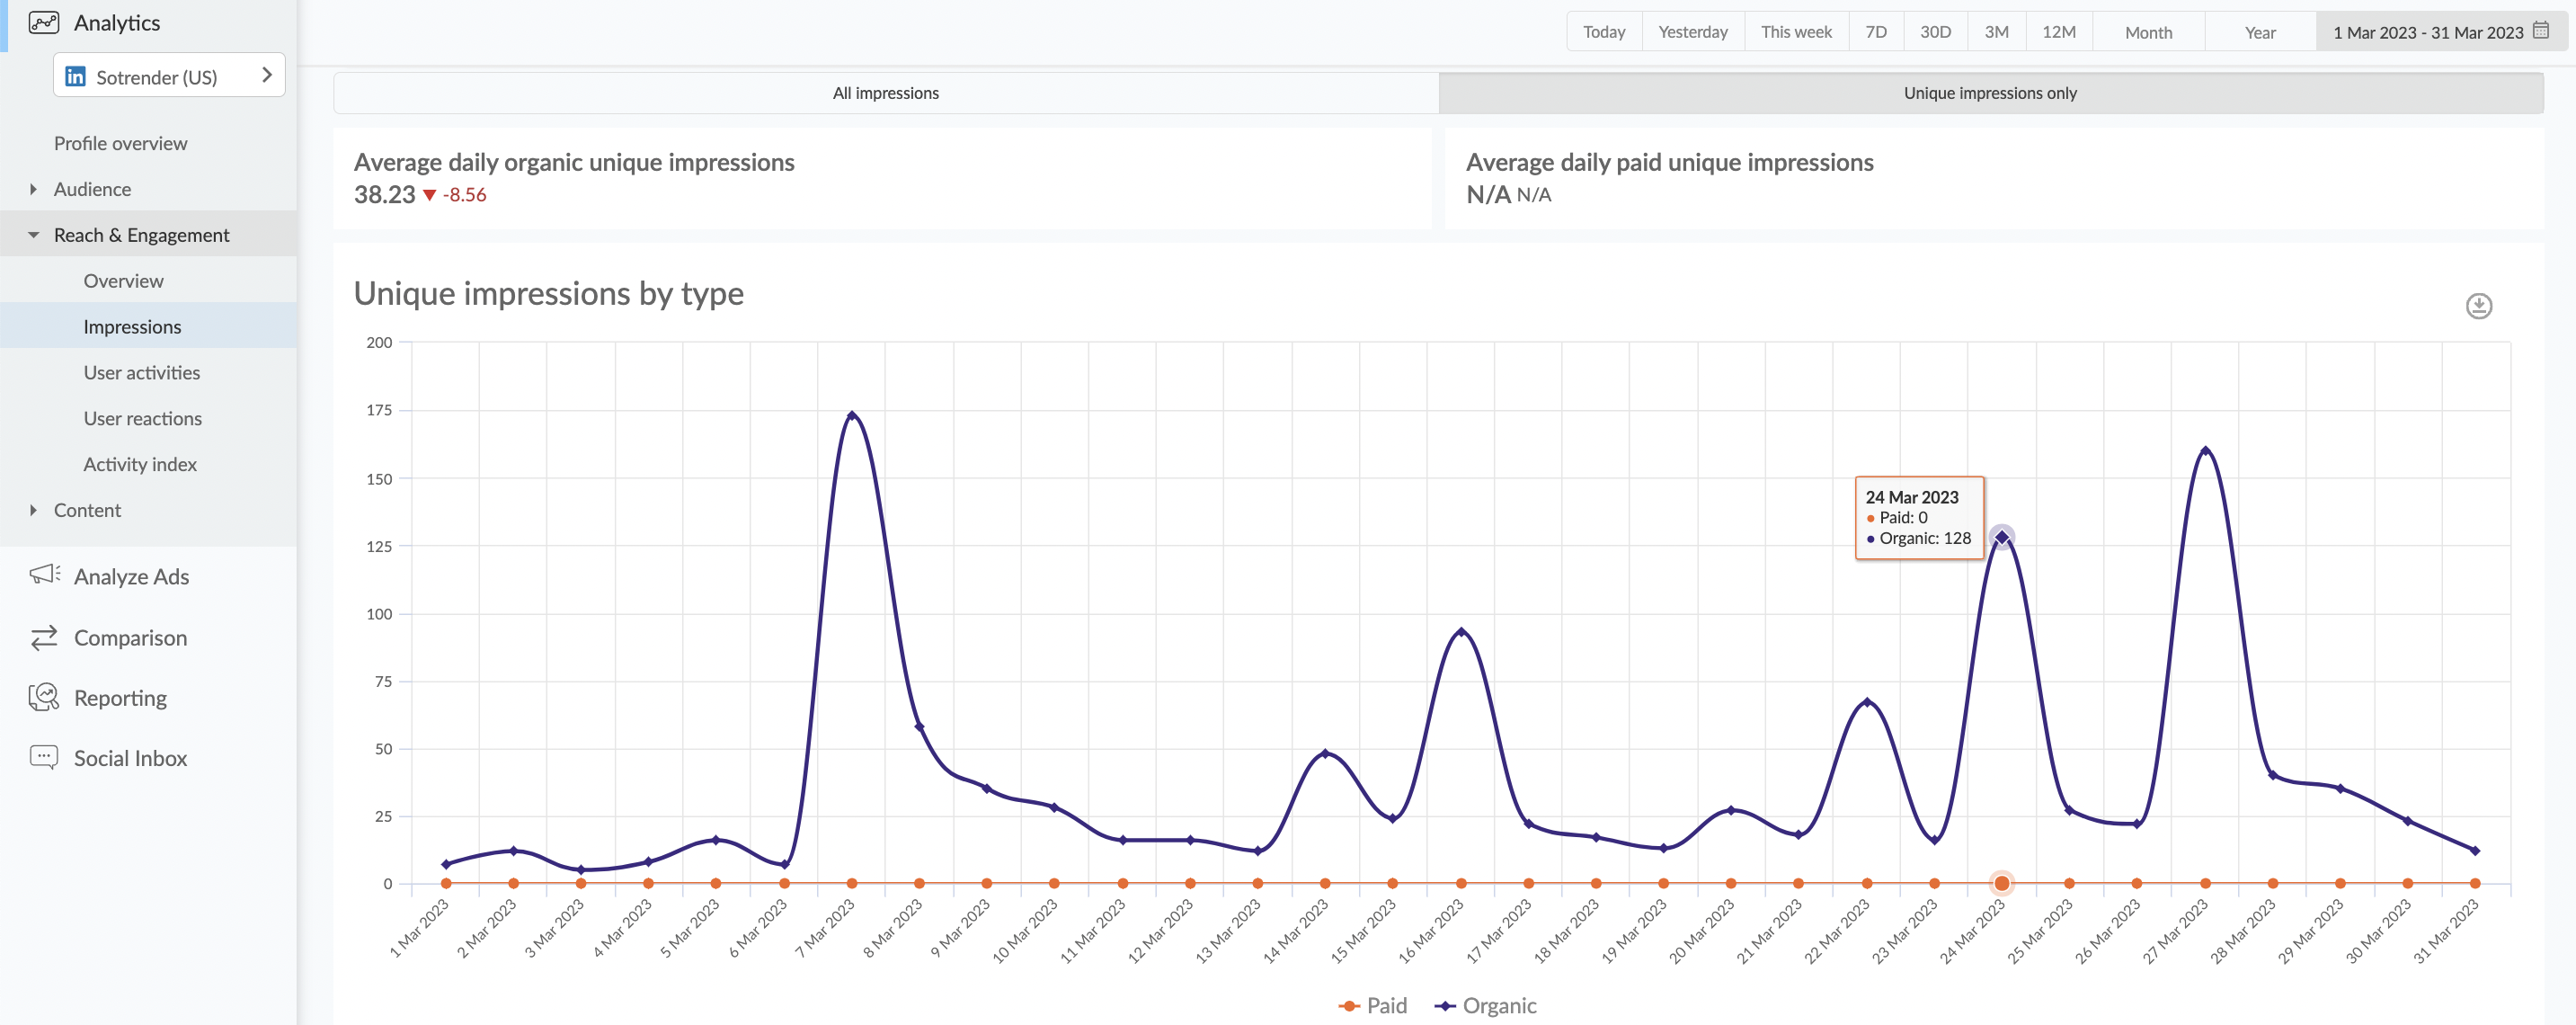
Unique impressions analysis in Sotrender
IMPORTANT
- For LinkedIn, there is no such metric as reach, which we know from Facebook or Instagram. To measure reach, head to unique impressions.
- Impressions is a metric used only to measure post impressions. There is no such thing as page impressions – to measure this, head to all page views in Sotrender (in the audience section).
User activities & Activity Index
User activities inform you of which ways users interact with the content you post on your LinkedIn Page. Users can perform the following activities:
- Clicks
- Reactions (Like, Love, Support, Celebrate, Insightful, Funny)
- Comments
- Reposts (shares)
To help marketers understand LinkedIn’s user interactions and interests even further, in Sotrender, there are various visualizations available for drawing meaningful conclusions.
- Total user activities – all user activities from every post published on LinkedIn
- User activities by type – every type of user activity represented on a daily level
- Activities by type stacked summary – an overall summary of how user activities were distributed for the selected time period
- User reactions – Like, Love, Celebrate, Support, Insightful, Funny reactions summarized over the selected time period
- User reactions by day – a bar chart presenting different reactions for each day
- User reactions by type stacked summary – an overall summary of how user reactions were distributed for the time period you selected (in percentages)
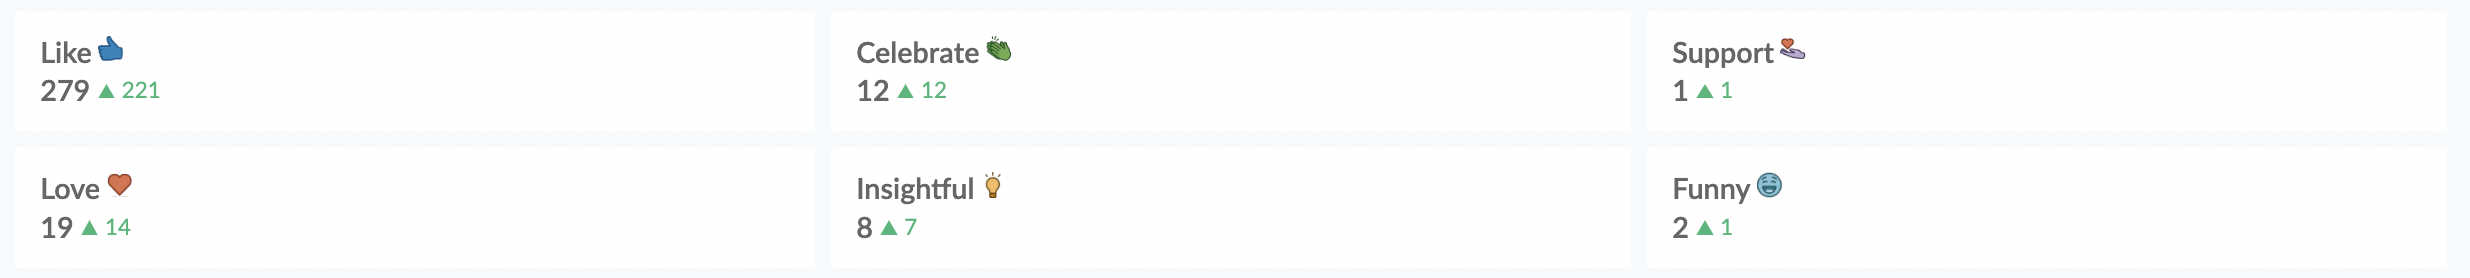
LinkedIn user reaction analysis in Sotrender
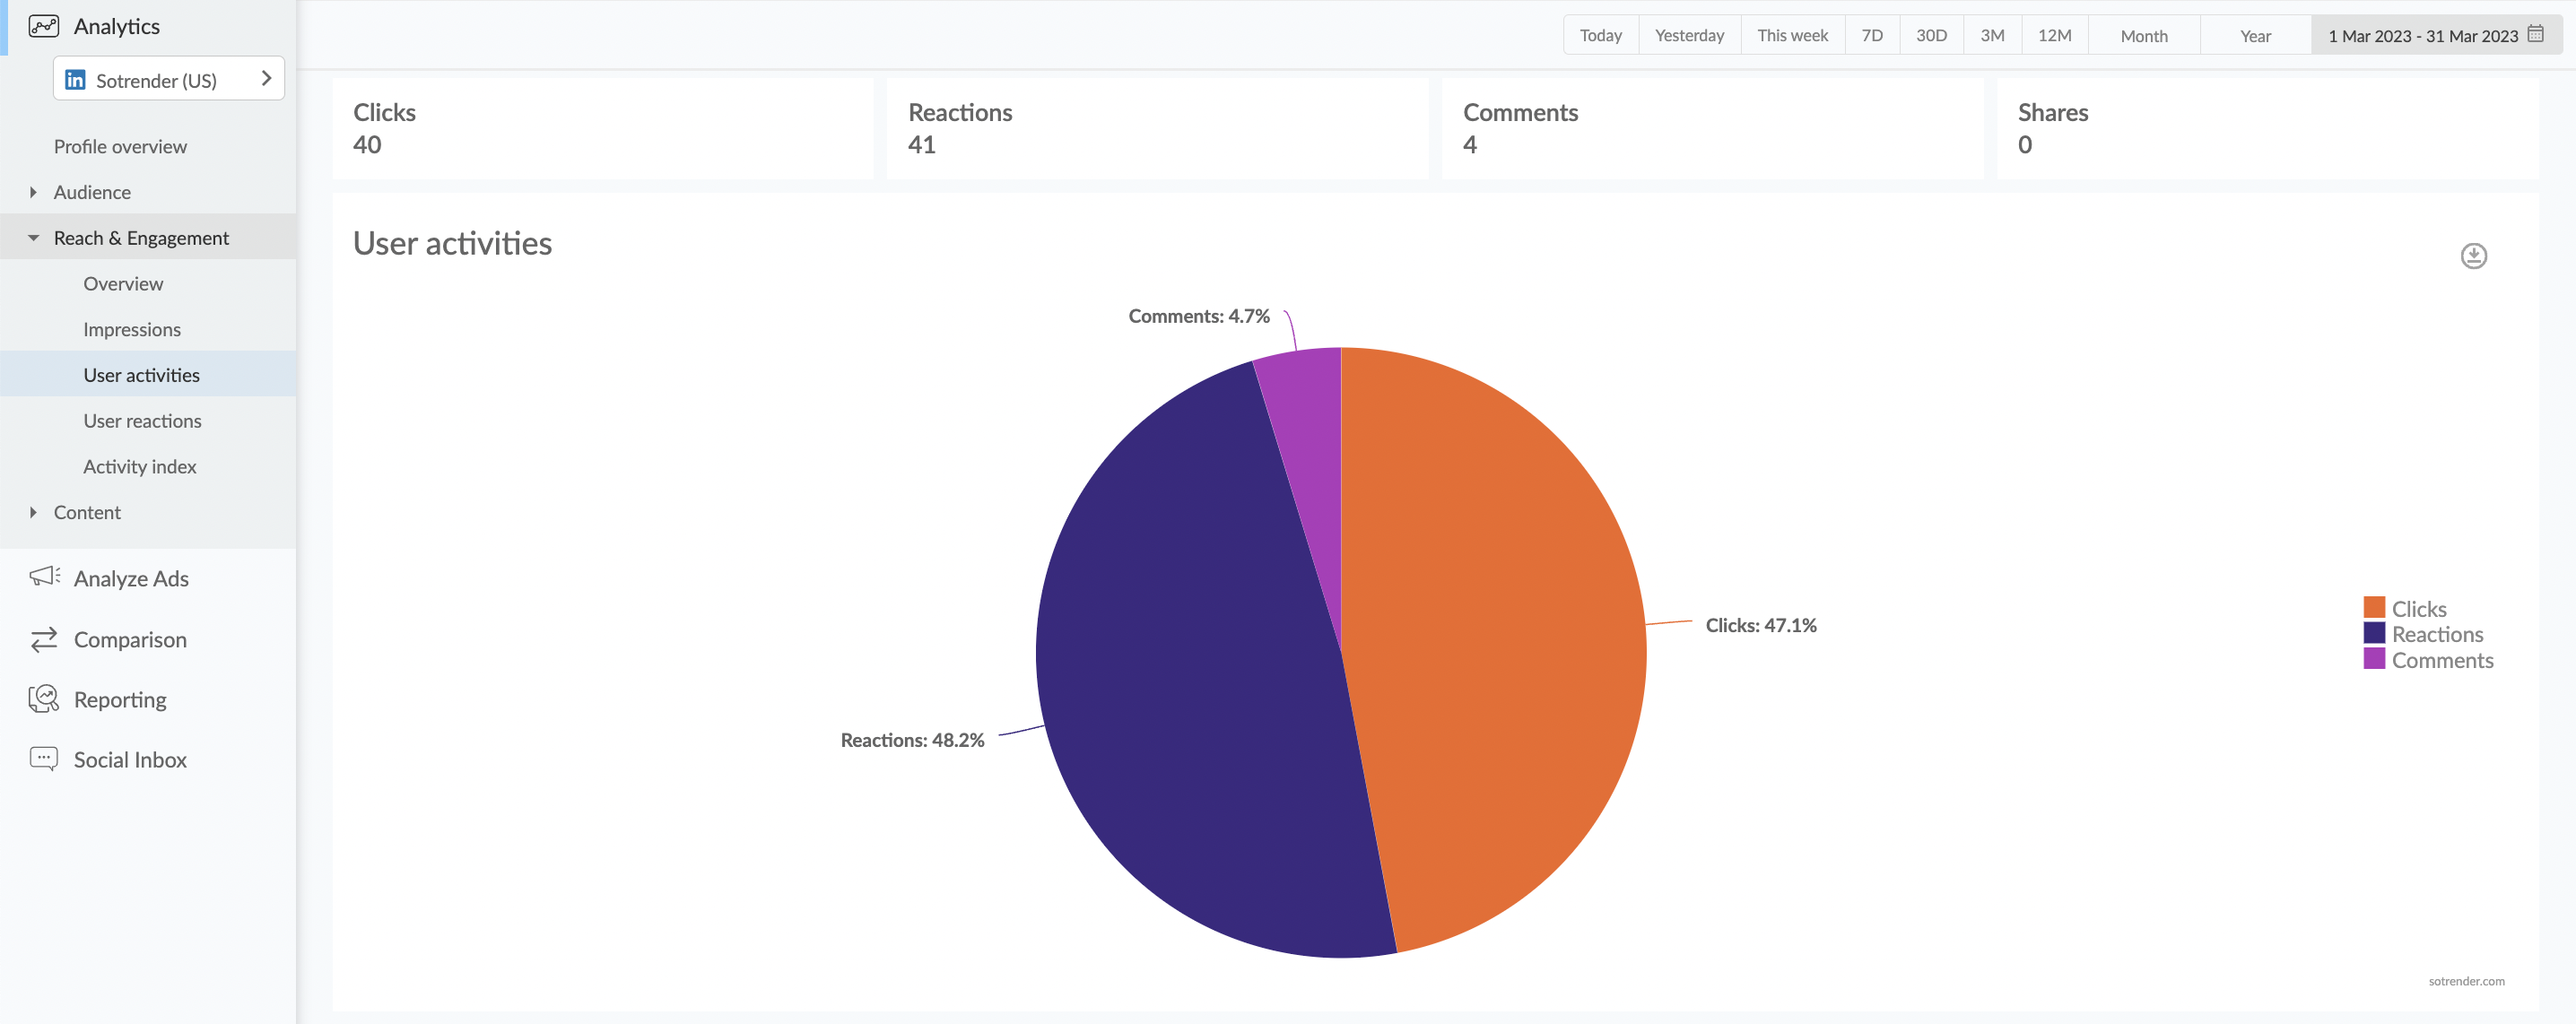
LinkedIn user activities analysis in Sotrender
However, some user activities are more valuable than others. It’s a no-brainer that ten comments and three shares are more valuable than ten likes. It matters for the algorithm, but it also matters for you, a marketer, as it shows how deeply engaged users are with your content.
That’s why in Sotrender we’ve introduced the Activity Index, which is an aggregated engagement metric.
With the Activity Index, we sum all user activities (reactions, comments, and reposts), but what is important is that each of these activities has a different weight.
- Reaction – 1
- Comment – 4
- Share – 16
By having access to the Activity Index metric available for each post, it’ll be super easy for you to determine which types of posts are more effective in terms of engagement. That will help you craft your strategy and increase engagement in the future.
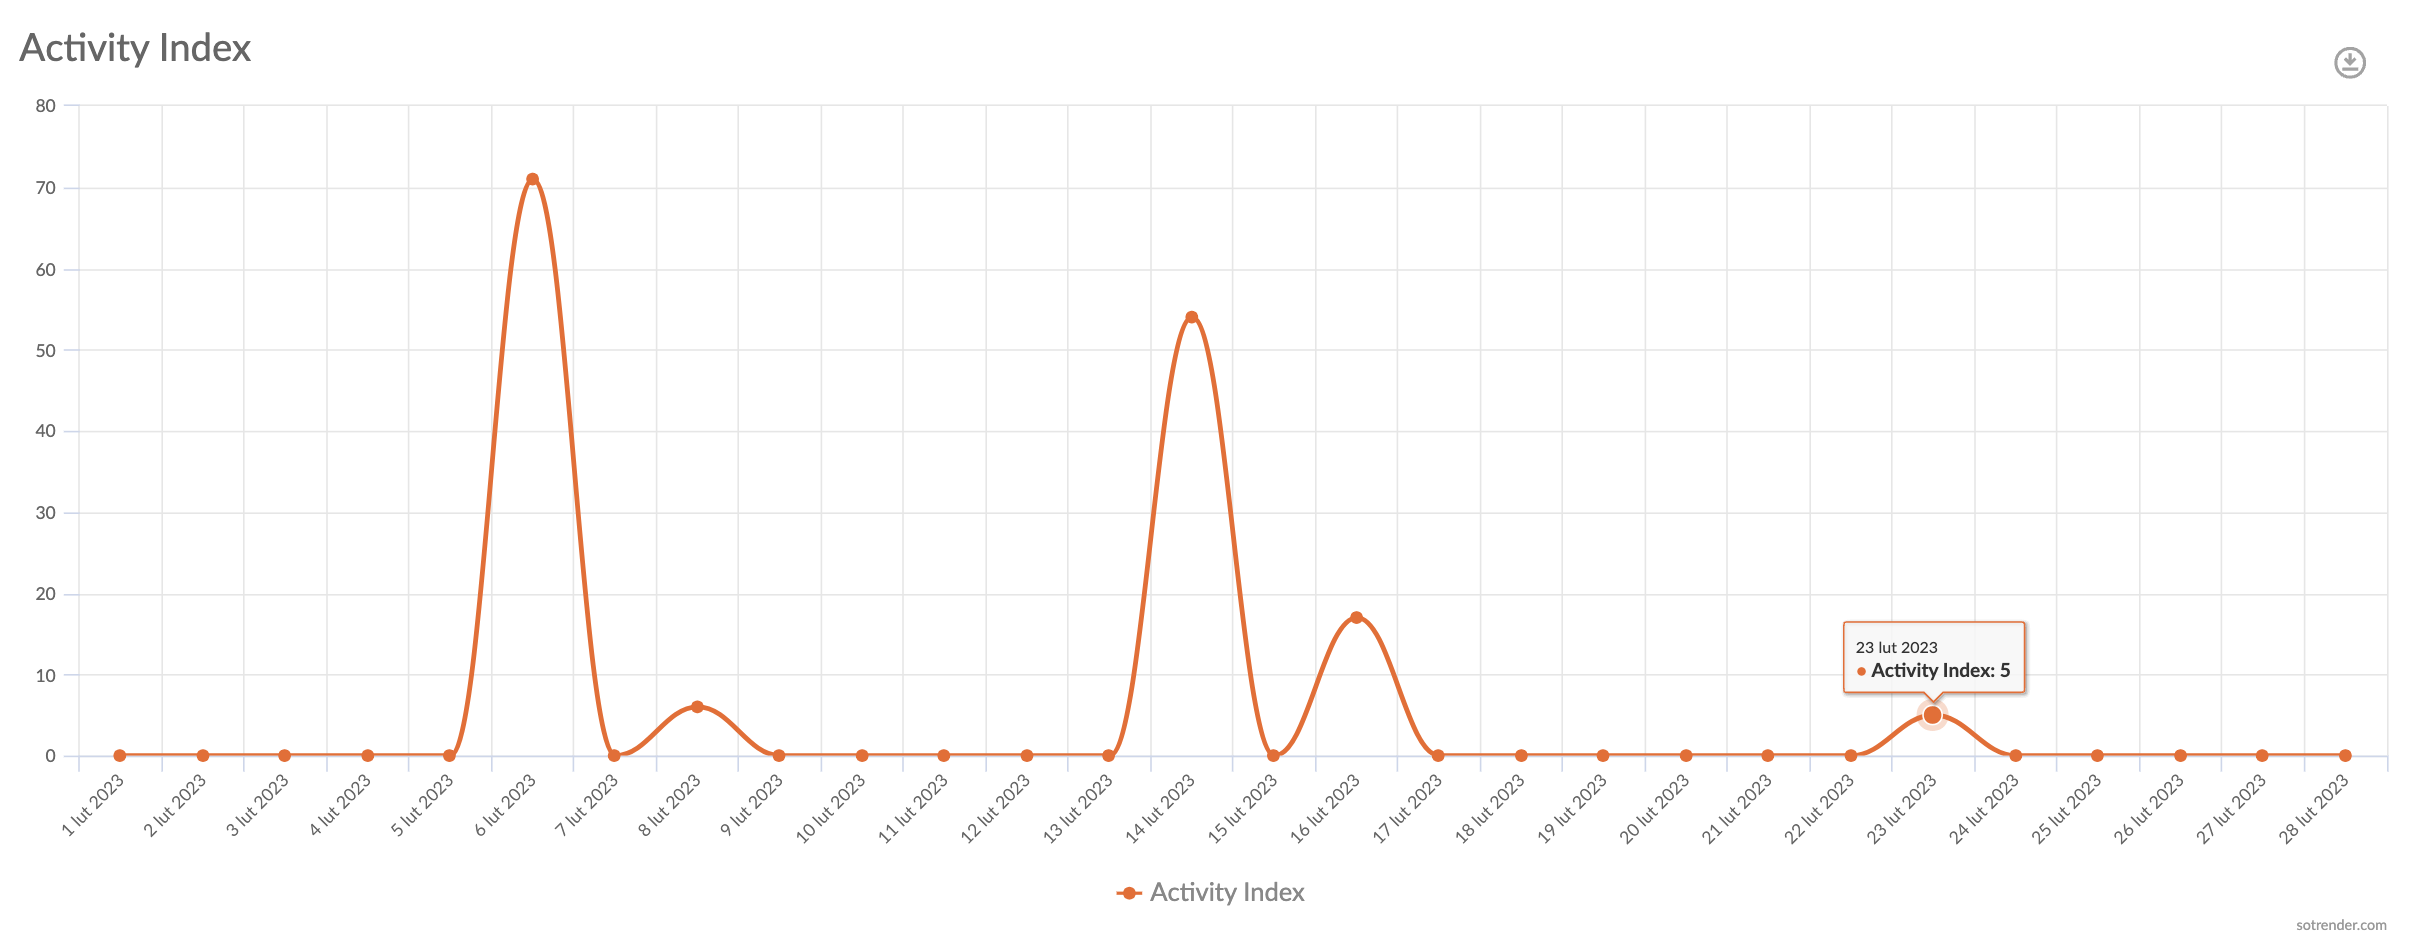
Activity Index metric, Sotrender
Clicks & CTR
Clicks inform you of how many users clicked on your post, company name, or company logo.
CTR, on the other hand, informs you of how many people, out of everyone who has seen your post, were interested in learning more about what you’ve posted and clicked on your content.
The CTR (for a post) is calculated as:
(clicks/impressions) x 100
Here’s how it looks in LinkedIn’s analytics panel:

PRO TIP
In the majority of cases, you’ll be aiming to have as high CTR as possible. If your posts’ call-to-actions usually sound like:
- Visit our website
- Read a blogpost
- Learn more
then a low number of clicks and low CTR will mean that your posts (and probably the entire content strategy) aren’t really successful and you should work on optimizing them.
Learn how to create and post engaging content on Linkedin >>>
Engagement Rate
The Engagement Rate metric is the one that usually needs a little bit more explanation.
On LinkedIn, ER is calculated based on the formula:
(organic clicks + organic likes + organic comments + organic shares) / (impressions).
It’s important to note that no paid data is included in LinkedIn’s Engagement Rate.
Obviously, the higher the engagement rate, the better. The average engagement rate on LinkedIn is around 3%. For some marketers, achieving a 2% engagement rate is already a good result.
Tracking competitors’ LinkedIn metrics
What about tracking competitors’ performance, you may ask.
Well, even though LinkedIn Analytics has the Competitors tab, the data offered there is limited. You’ll only be able to see metrics like:
Follower metrics:
- Total followers
- New followers
Organic content metrics:
- Total engagements
- Total posts
and the three top posts from the last 30 days from all your competitors.
That’s not a lot. The only insights you won’t be able to monitor yourself without using the Competitors tab are new followers and total engagements.
PRO TIP
It’s good to dig deeper into what your competitors are up to. Spy on their strategy and performance at least once a quarter. It’s always good to know what their main focus is and their approach to managing their LinkedIn profile. By doing so, you’ll also learn in which direction your industry is heading.
What is LinkedIn Dwell Time?
You’ve probably heard about one more LinkedIn metric, which is dwell time. Even though it’s not a metric that can be analyzed, it’s important to understand what LinkedIn dwell time is and why it matters for your content to rank high.
Dwell time informs to what extent LinkedIn users are into your content – how much time they spend watching and consuming it. It was introduced because many users tend not to interact with the content they find interesting.
In simple words, users may be reading your posts and articles or watching your videos without leaving a comment or a reaction. At the same time, their interest is important for the algorithm when ranking content. With so many passive LinkedIn users (that are not actively engaging with the content on their feeds), LinkedIn had to update how its AI algorithms assess the quality of posts.
Unfortunately, dwell time on LinkedIn can’t be tracked, as it’s not available anywhere as a separate metric.
If you’d like to read more about how dwell time on LinkedIn actually works, here’s an in-depth article from a LinkedIn engineer.

This is how Dwell Time is calculated
PRO TIP
Don’t give up on creating high-quality content, even though not many users interact with your posts – it doesn’t necessarily mean that those aren’t interesting to them.
Apart from analyzing engagement, also track metrics like video views or unique impressions. Also, produce eye-catching (with emojis, contrasting colors), inspiring, and long-form content.
How to get the most out of your LinkedIn metrics?
It’s easy to get lost with so many platform-specific metrics. In order not to get overwhelmed, don’t try to analyze all the metrics at once. Make it a process and familiarize yourself with LinkedIn metrics step by step.
In order to use LinkedIn metrics to your advantage, do the following:
- When analyzing your content, don’t focus only on your last post. Monitor your content performance for a longer time period to get the bigger picture.
- Try to understand your audience interests and behaviors more thoroughly.
- Don’t underestimate demographic data, as those are invaluable insights about your target audience which you should use when crafting your content.
- Analyze when your audience is most active on the platform to catch their attention.
Given that a Company Page on LinkedIn is quite often run by HR or EB specialists, not necessarily marketers, it’s always good to guide them through those processes and provide useful resources.
Start tracking your LinkedIn metrics like a pro
It’s super important to regularly monitor your LinkedIn marketing efforts. By automating your LinkedIn analytics, you’ll be sure that your data are always up to date, and you can focus on upgrading your strategy rather than just on collecting the data itself.


