
ℹ️ Note: Twitter analysis is no longer available in Sotrender. If you need data from this platform, contact us at support@sotrender.com to order a custom report.
Tracking Twitter marketing analytics is critical to know what’s working and what isn’t. Although Twitter Analytics seems simple, it’s elusive to many social media marketers. Often, marketers get lost tracking vanity metrics that have no bearing on their strategy.
For example, if you prioritize measuring engagement levels to improve brand awareness, it might mean that all other metrics fade into the background.
Any strategy you choose to adopt without taking into account the impact of other metrics such as brand mentions and number of followers won’t be effective. They influence the level of engagement and contribute to the success of the overall marketing objective, which, in this case, improves brand awareness.
In this guide, you will learn how to problem-solve using Twitter Analytics by paying attention to metrics that matter to you. Here’s what we’ll cover:
- What Twitter Analytics is
- Why Twitter Analytics is important
- How to get started with Twitter Analytics.
What is Twitter Analytics?
Twitter Analytics is a service that tracks how your target audience interacts with the content you share on Twitter, analyzes it, and provides you with a report on its performance.
Twitter users have an analytics dashboard that provides a report with different statistics from the last 28 days. Other social media marketing tools also provide you with analytics reports, and we’ll talk about them in a later section.
Why is Twitter Analytics important?
Whether you’re building a personal brand on Twitter or managing a company’s Twitter marketing efforts, you stand to benefit from getting an analytics report.
Twitter Analytics shows you how your target audience interacts with the content you share on Twitter. In addition to providing you with this information, you also answer questions such as:
- Is my Twitter marketing strategy working? If not, why?
- Which campaigns should I optimize? Which should I let go?
- Which topics generate the most engagement?
- What are my competitors doing better?
- How can I build a bigger audience?
When you’re comparing Twitter Analytics reports to see how they contribute to your content marketing metrics, you eliminate guesswork and bias when choosing the strategy to adopt to improve the results you get from your Twitter marketing efforts.
Finally, for social media managers, your social media management fee for a client’s Twitter account depends on the results you can deliver for a client and how well you can back up your claims.
Every social media marketer will find value in different data points that Twitter and other tools provide. Each data point is important, and in this section, we’ll provide an overall approach that helps you decide on what metrics to focus on, depending on your goals. So how to get started with Twitter analytics?
Step 1: Choose your most essential metrics
To avoid getting lost in the numbers and losing sight of important data, identify what metrics matter to you and why.
To do this, we’ll briefly go back to the basics on the four use cases of Twitter (your “why”). Then, we’ll identify metrics you need to pay attention to (your “what”).
Social Selling: When using Twitter for social selling, the goal is to generate leads and sales from the content you share. You may run ads or collaborate with influencers who add links pointing to your landing and sales pages in the content you share.
Metrics to track:
- Conversion rate
- Number of leads generated
- Buyer recency or frequency
Social Listening: When using Twitter for social listening, the goal is to track and identify trending topics in your industry, customer service requests, and competitor conversations.
Metrics to track:
- Customer and brand sentiment
- Content and product gaps
- Retention rate
- Number of refunds issued
Social Networking: When using Twitter for social networking, your goal is to identify and connect with like-minded people in your industry. They could be influencers, thought leaders, or even folks collaborating with brands that complement your product or service.
Metrics to track:
- Earned media mentions
- Number of strategic partnerships developed
Social Influencing: Here, your goal is to establish yourself as an authority by sharing content to drive awareness of a product or service. For example, you might share a link to a review of a productivity tool such as Sunsama on Twitter and watch how your audience responds.
Metrics to track:
- Level of engagement
- Amount of web traffic
- Growth of your retargeting list
Most brands have more than one goal as part of their Twitter marketing efforts. When you look at it from these four lenses — social selling, social listening, social networking, and social influencing — you realize that engagement rates, number of followers, impressions, and profile visits don’t provide enough context when viewed alone.
You need to unify all your data to create better buying experiences. For example, if you notice an increase in the number of profile visits and impressions, it might mean that you’re moving closer to achieving your social influencing goals. However, is there an increase in the number of website visits from the people who visit your Twitter profile?
Other tools besides the Twitter dashboard show you whether your Twitter efforts are working. For example, if you see an uptick in traffic to a specific landing page, your social selling strategy might be working, even though the tweet itself doesn’t have many retweets and replies.
What are your overall goals? How do they connect with your marketing strategy?
Let’s take a look at what metrics tie to these goals from your Twitter Analytics dashboard and analytics tools like Sotrender.
Step 2: Set up your analytics measurement tools
Now that you know what metrics to track that align with your overall marketing objectives, the next step is to set up the tools you need to collect performance reports.
Given that you’re working on Twitter, you need tools that will provide reports and data on your performance on the platform to compare them with data and reports from other tools such as Google Analytics.
There are plenty of social media analytics tools available, which are both free and paid. Here are two tools we recommend you use when getting started:
Twitter Analytics dashboard
Twitter Analytics dashboard provides you with a report on how your account has performed in the last 28 days. With daily updates, Twitter visualizes your performance in the form of graphs, percentages, and highlights of your best-performing tweets. Here are some of the metrics you can track using the dashboard:
Top Tweets: These are your best performing tweets of the month based on the number of impressions and level of engagement your tweets received. However, Twitter shows you only one Tweet which outperformed the other ones.
Impressions: This is an overall stat that reflects the number of times your followers have seen your tweets organically in the last 28 days. It also includes retweets and quote tweets.
New followers: This is the number of followers you have gained (or lost) in the last 28 days.
Engagement rate: This is the stat available only for ‘Top mention’. It shows you the level of engagement per tweet based on impressions and engagement a tweet receives.
Tweets with high engagement rates are a reflection of content that resonates with your audience on Twitter.
Mentions: It shows you a general number of people mentioning you in conversations. Track it when you want to keep track of reputation issues and even join conversations where you can add value.
Profile visits: it shows the number of people who visit your twitter profile. Of course, it might grow or decline.
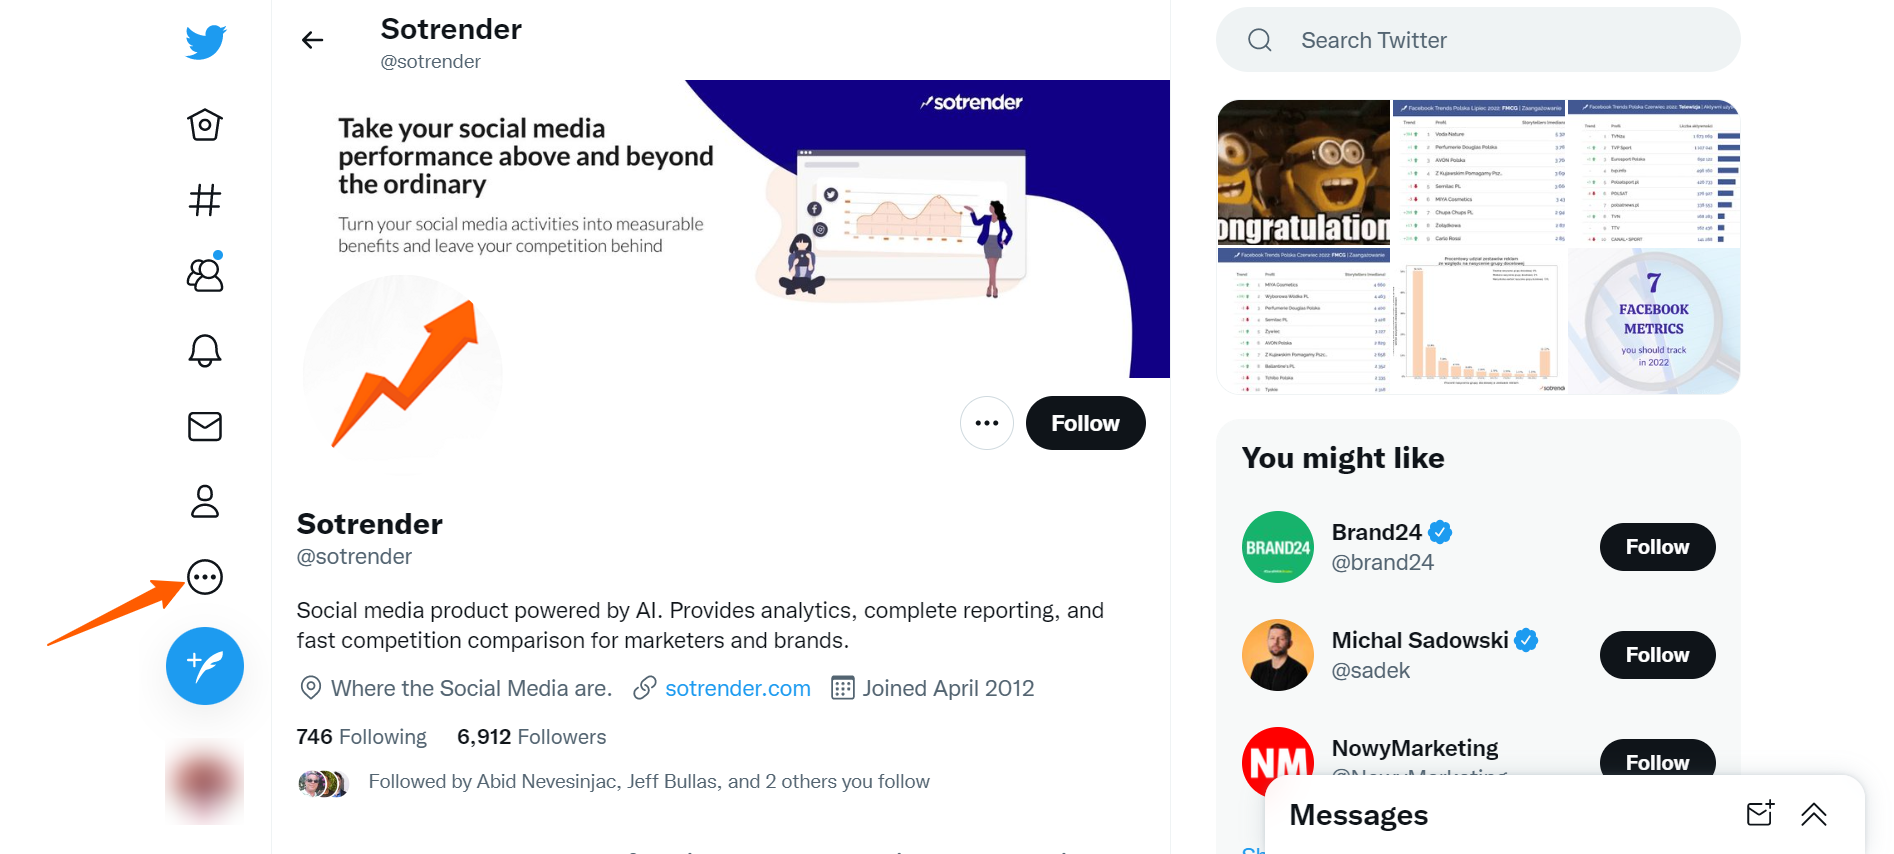
To access your dashboard, open your Twitter account and click on the three encircled dots on your left column.
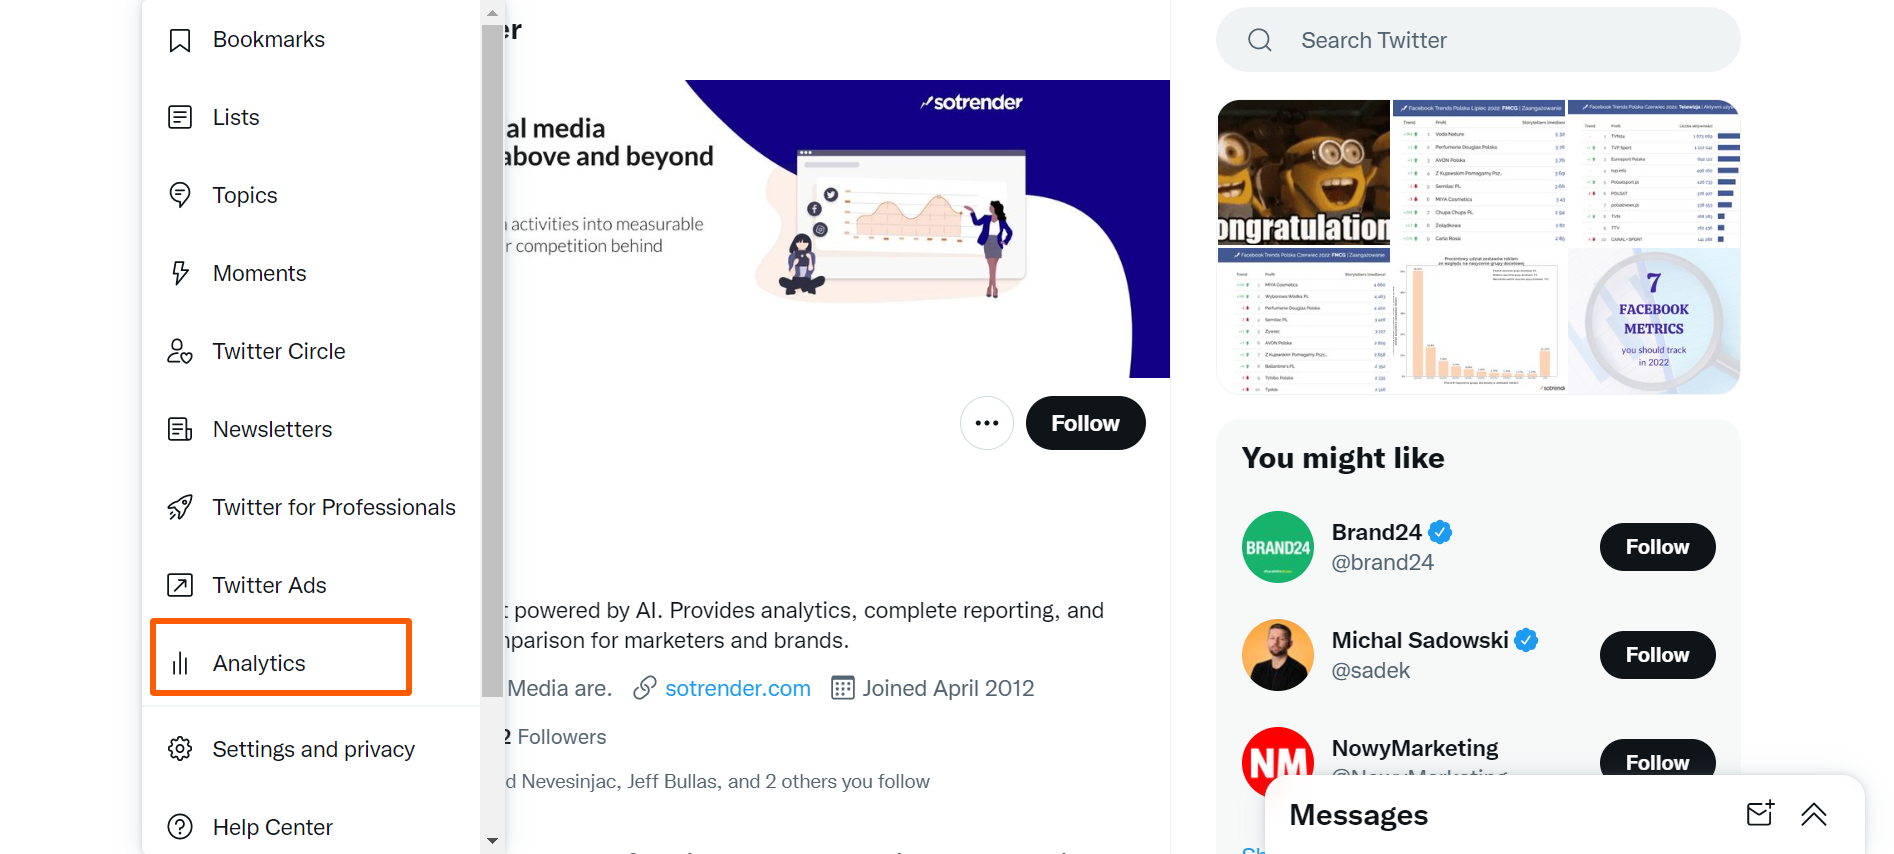
Click on “Analytics” from the list of options provided:
Your dashboard will open, showing you how your account has been performing in the last 28 days.
Sotrender
Twitter’s dashboard provides a report on how your Twitter account is performing.
However, it can’t provide you with all the reports needed to get an accurate picture of what is going on when you need a tool that goes an extra mile — for example, a report on influencer analytics.
In such instances, you’ll need to invest in a tool to help you collect more data. What is more, Twitter Analytics does not provide you with comprehensive reports, like Sotrender does.
To get started, head over to Sotrender and sign up for a free trial. Then, add aTwitter profile whose analytics you want to track.
Step 3: Set up your dashboard
Visualize the information that allows you to derive actionable insights.
Your Twitter Analytics dashboard comes with a pre-made report, so there won’t be anything to set up.
However, when using Sotrender, you need to set up your dashboard that helps you visualize the information you need and generate comprehensive reports that you can act upon.
To set up your dashboard in Sotrender, add your Twitter profile as mentioned earlier. If you have different accounts for different purposes, such as a handle for sharing content and another for customer service, add them.
If you want to see how other accounts perform, add this to finish setting up your dashboard. Once Sotrender collects all the data it needs from the profiles you add, here’s what your Twitter dashboard will look like:
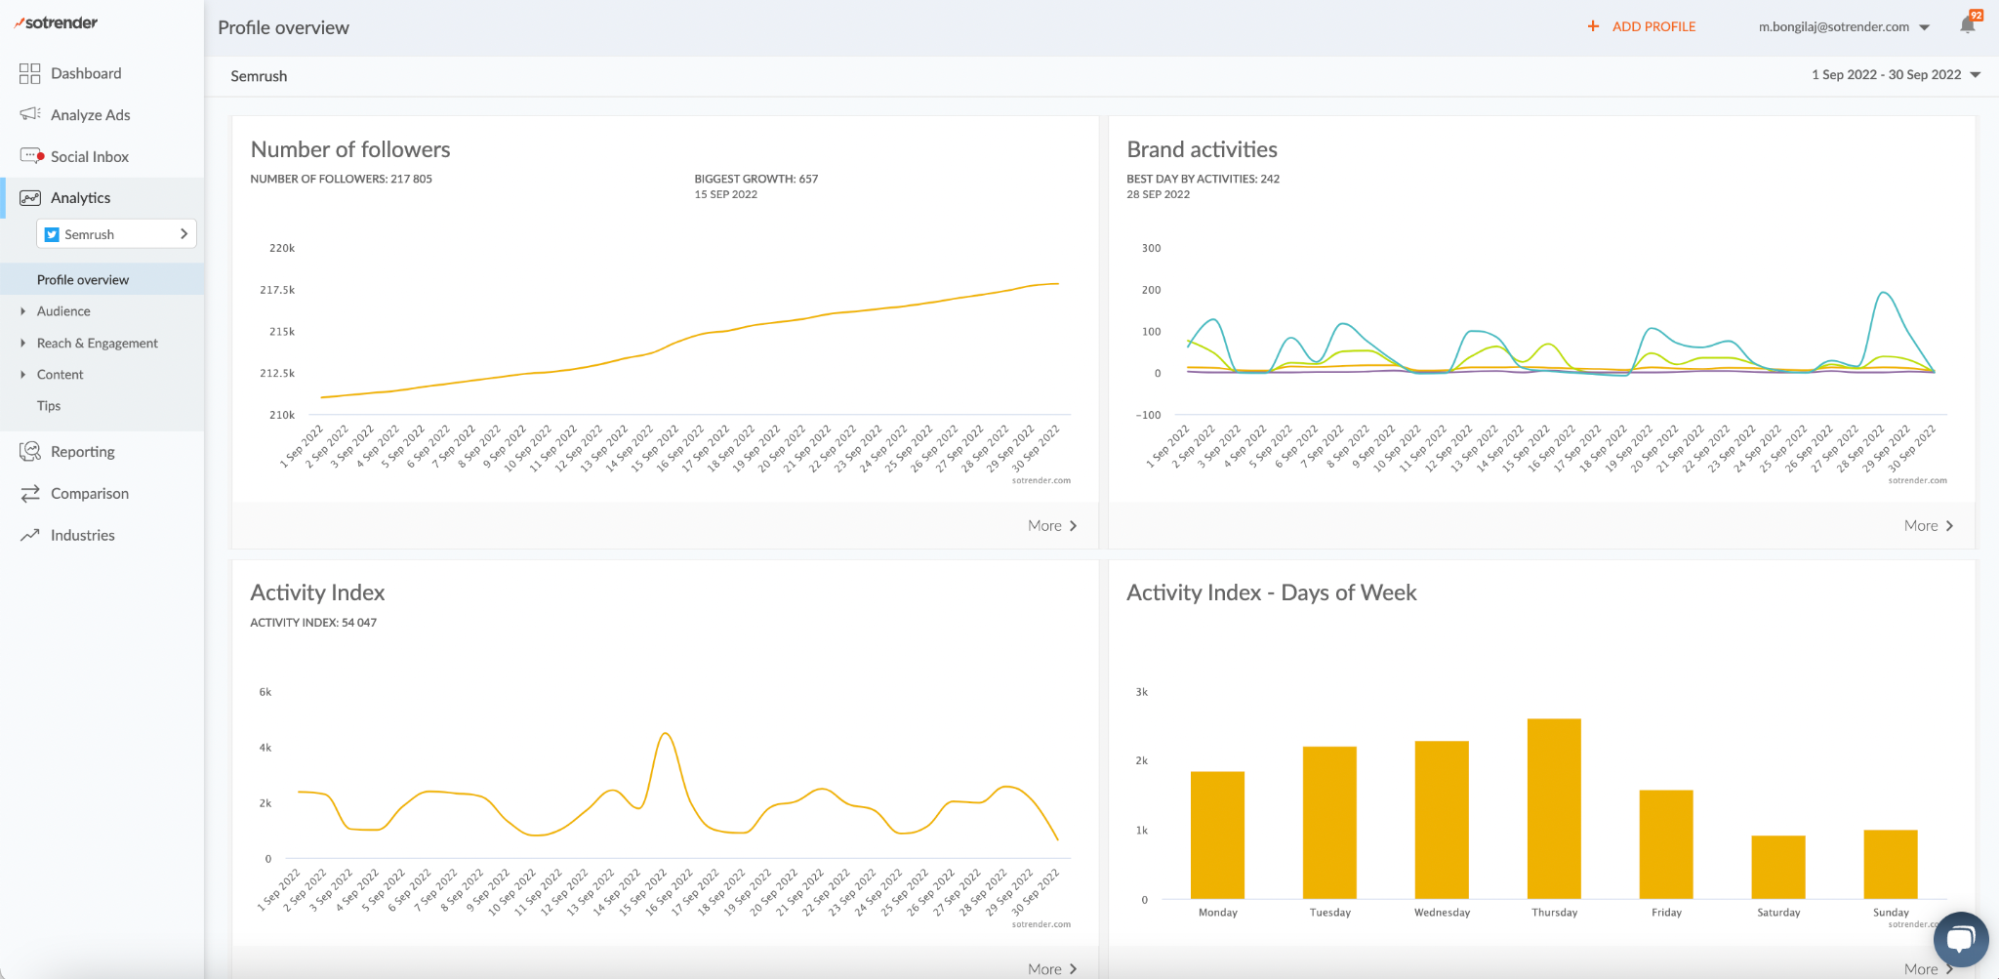
Profile overview with key metrics in Sotrender
As you can see on the right, there’s a date range you can easily adjust according to your needs. While Twitter allows you to analyze only the last 28 days, Sotrender gives you access to historical metrics. Now, which are the key stats that you can follow in Sotrender?
- Number of followers
Number of followers and follower growth lay at the core of every analytics – no matter if it is Facebook, Twitter or Instagram. The follower base reflects your brand awareness while follower growth informs you how many people are engaging with your brand and content. They both are important for your social media goals and business success in the long run.
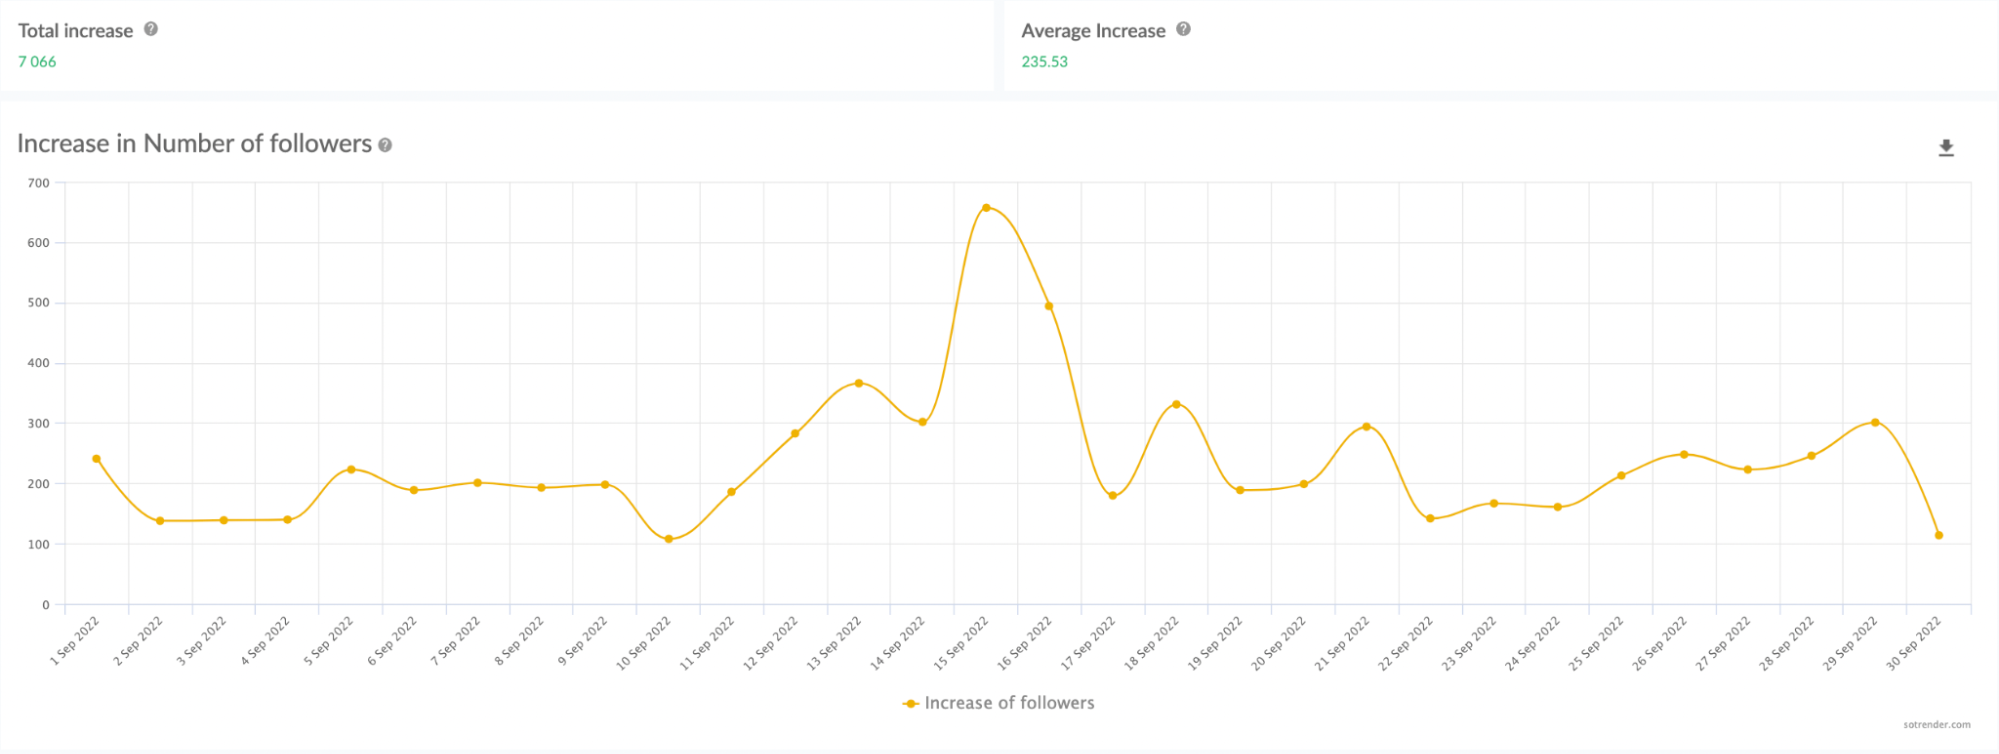
Measuring increase in Number of followers in Sotrender
In Sotrender, you can track the number of followers as well as follower growth for any given time period. You can also see how the numbers changed on particular dates and analyze them thoroughly. This way, you can also easily compare your follower growth between different time gaps and draw conclusions about interest in your brand over time.
- Activity Index
Activity Index is Sotrender’s unique metric. It is the collective weighted rate of user activities on a brand’s profile, informing you how active your followers are on particular days as well as during certain times. What is important, the Activity Index measures not only user engagement but also the character of it – each Twitter activity is weighted accordingly.
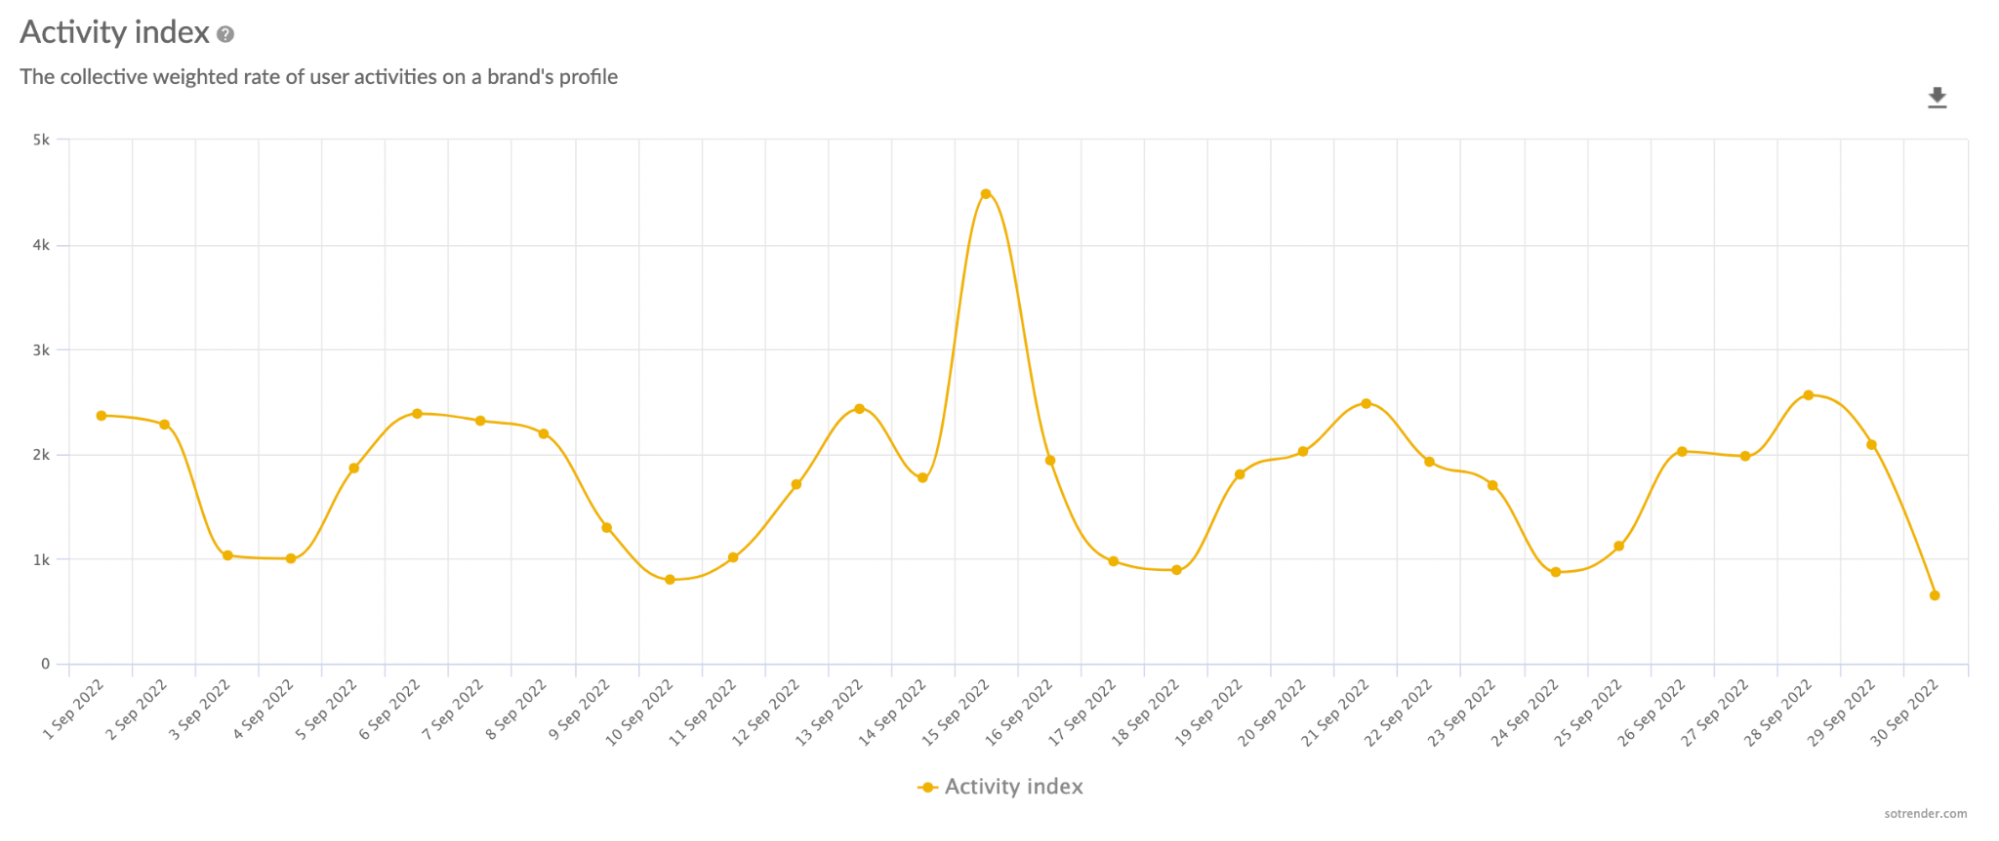
Analyzing Activity Index for a certain profile in Sotrender
Such in-depth analysis allows you to understand your user activity much better. While Twitter provides you with general numbers, Sotrender helps to dig deeper into your performance.
- Engaged users
Another metric which you should keep an eye out for is user engagement. It shows you how many followers engage with your content over time. This way, you can also quickly identify which of your tweets are the most engaging for your audience and polish your Twitter strategy based on such insights.
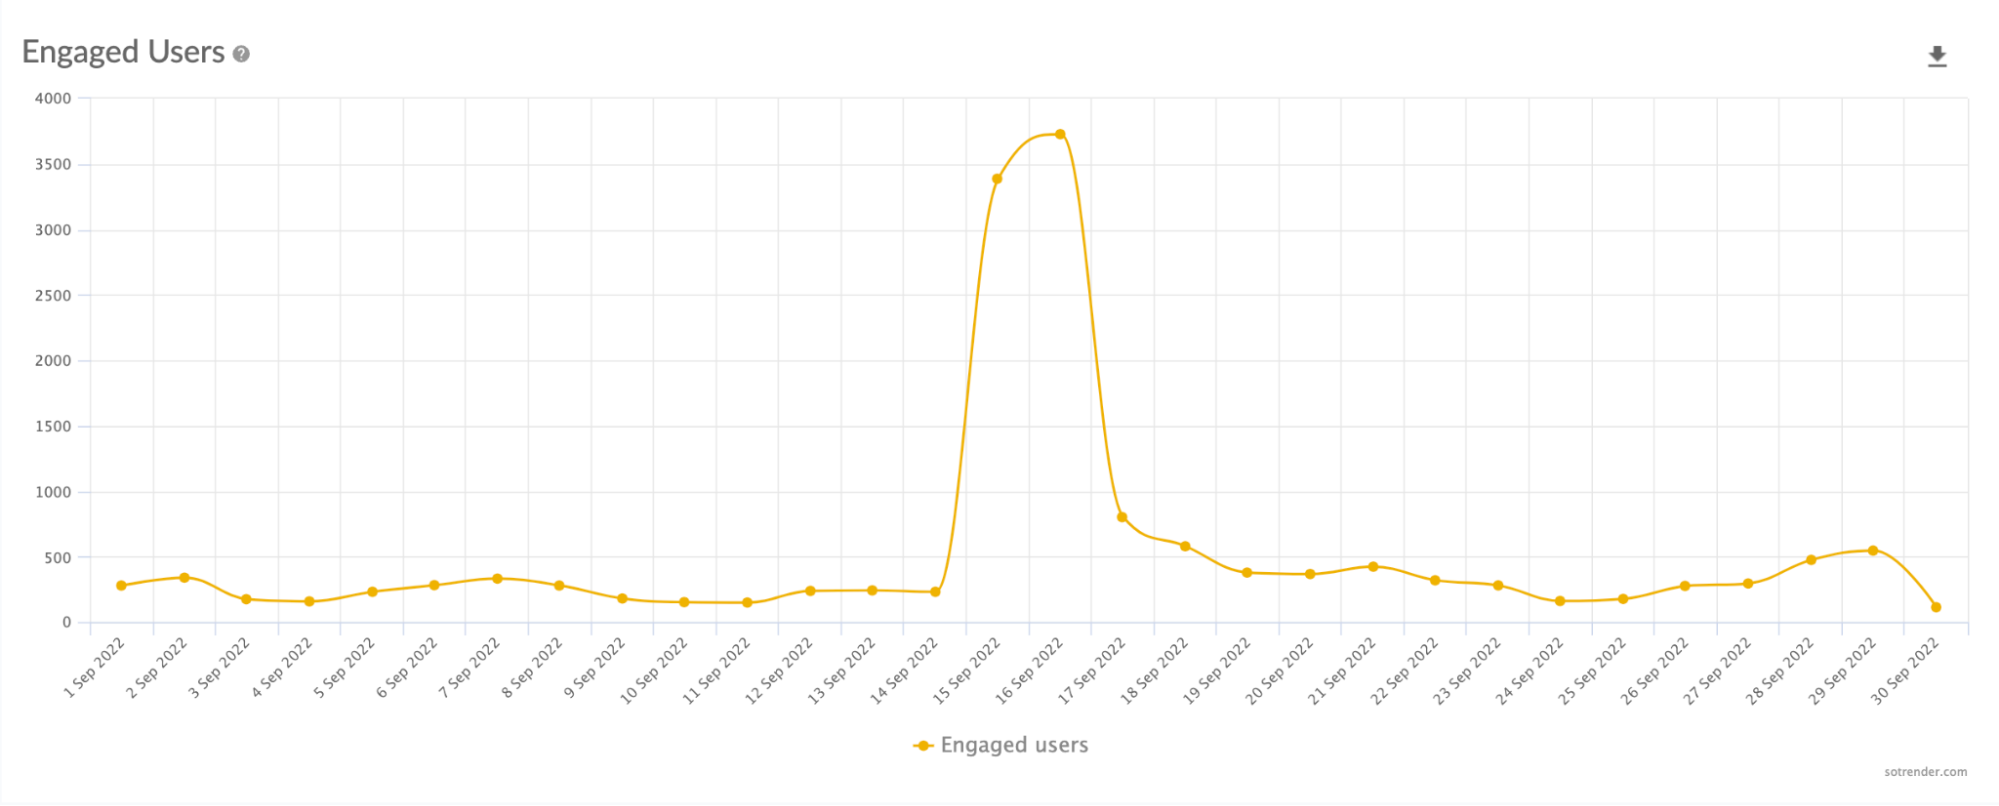
Tracking User engagement in Sotrender
Reminder: Twitter Analytics allows you to check engagement only for ‘Top mentions’.
- Brand activities
Tracking brand activity on Twitter is important especially in the context of other profiles. The metric shows you which brand is more active and how it impacts their results. This metric helps you also to dive deep into the types of engagements each competitor is having on Twitter to help inform your strategy. This metric isn’t available within the Twitter Analytics dashboard.
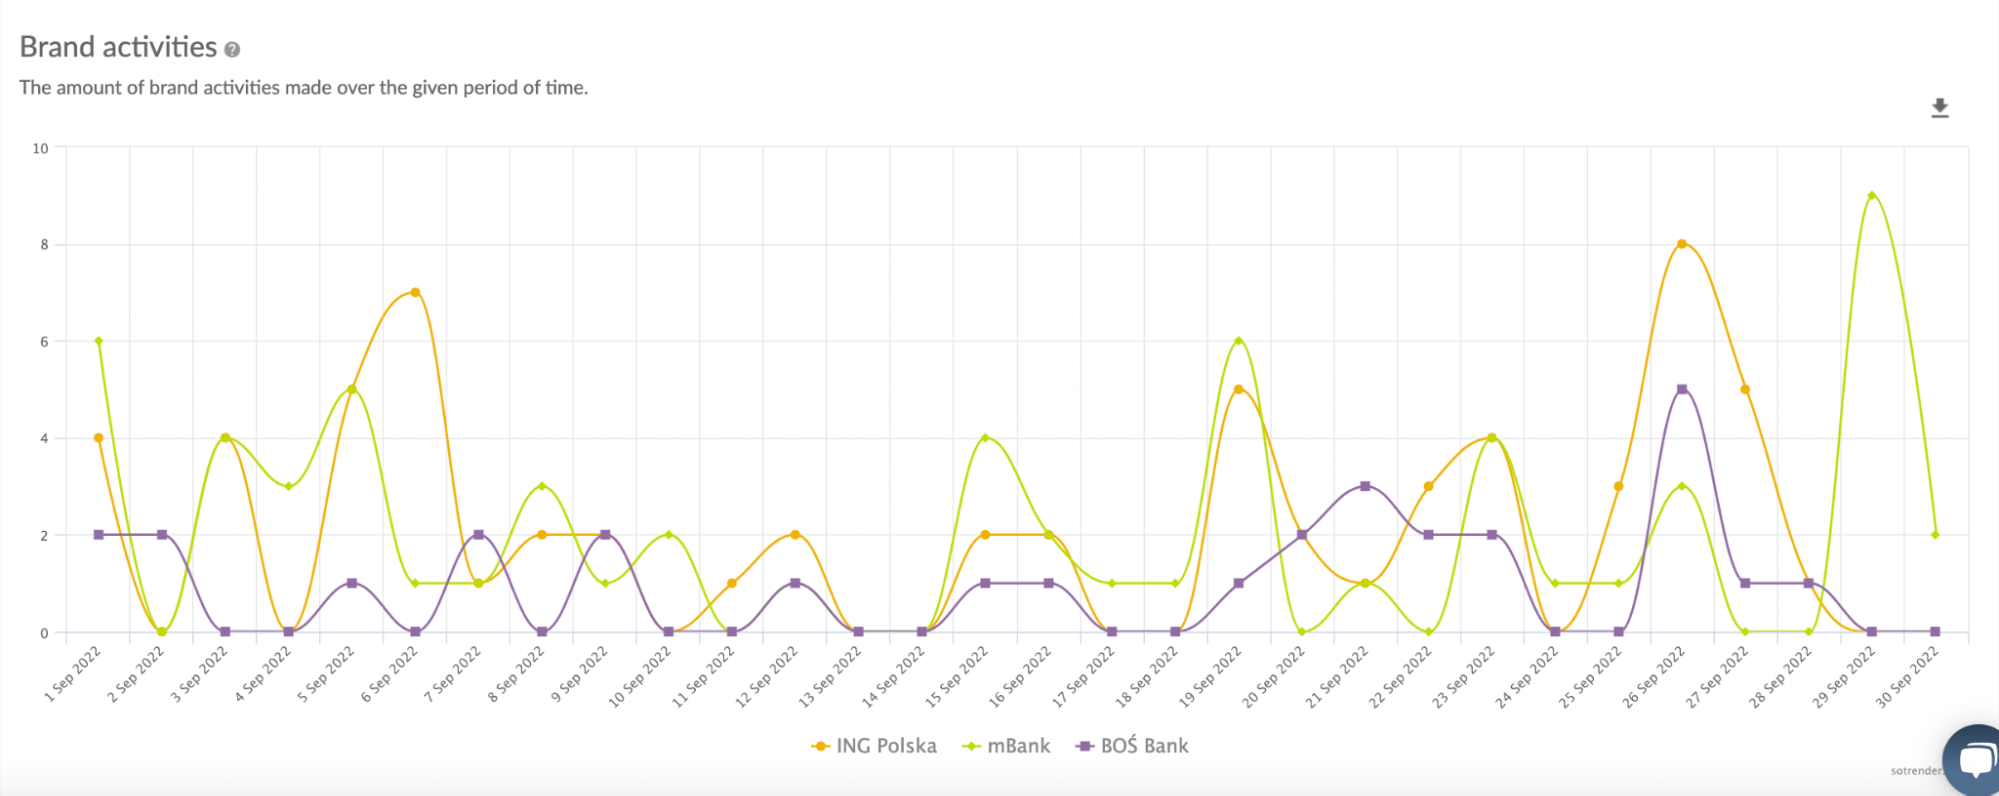
Analyzing Brand activities over time in Sotrender
- Top tweets & hashtags
Identifying your top tweets on Twitter can be extremely helpful in creating a successful content strategy. In Sotrender, you can quickly view all posts published in a selected time period with their stats (like retweets, likes, Activity Index). This way, it is easy to understand what kinds of content that you publish perform well, and which ones do not bring expected results.
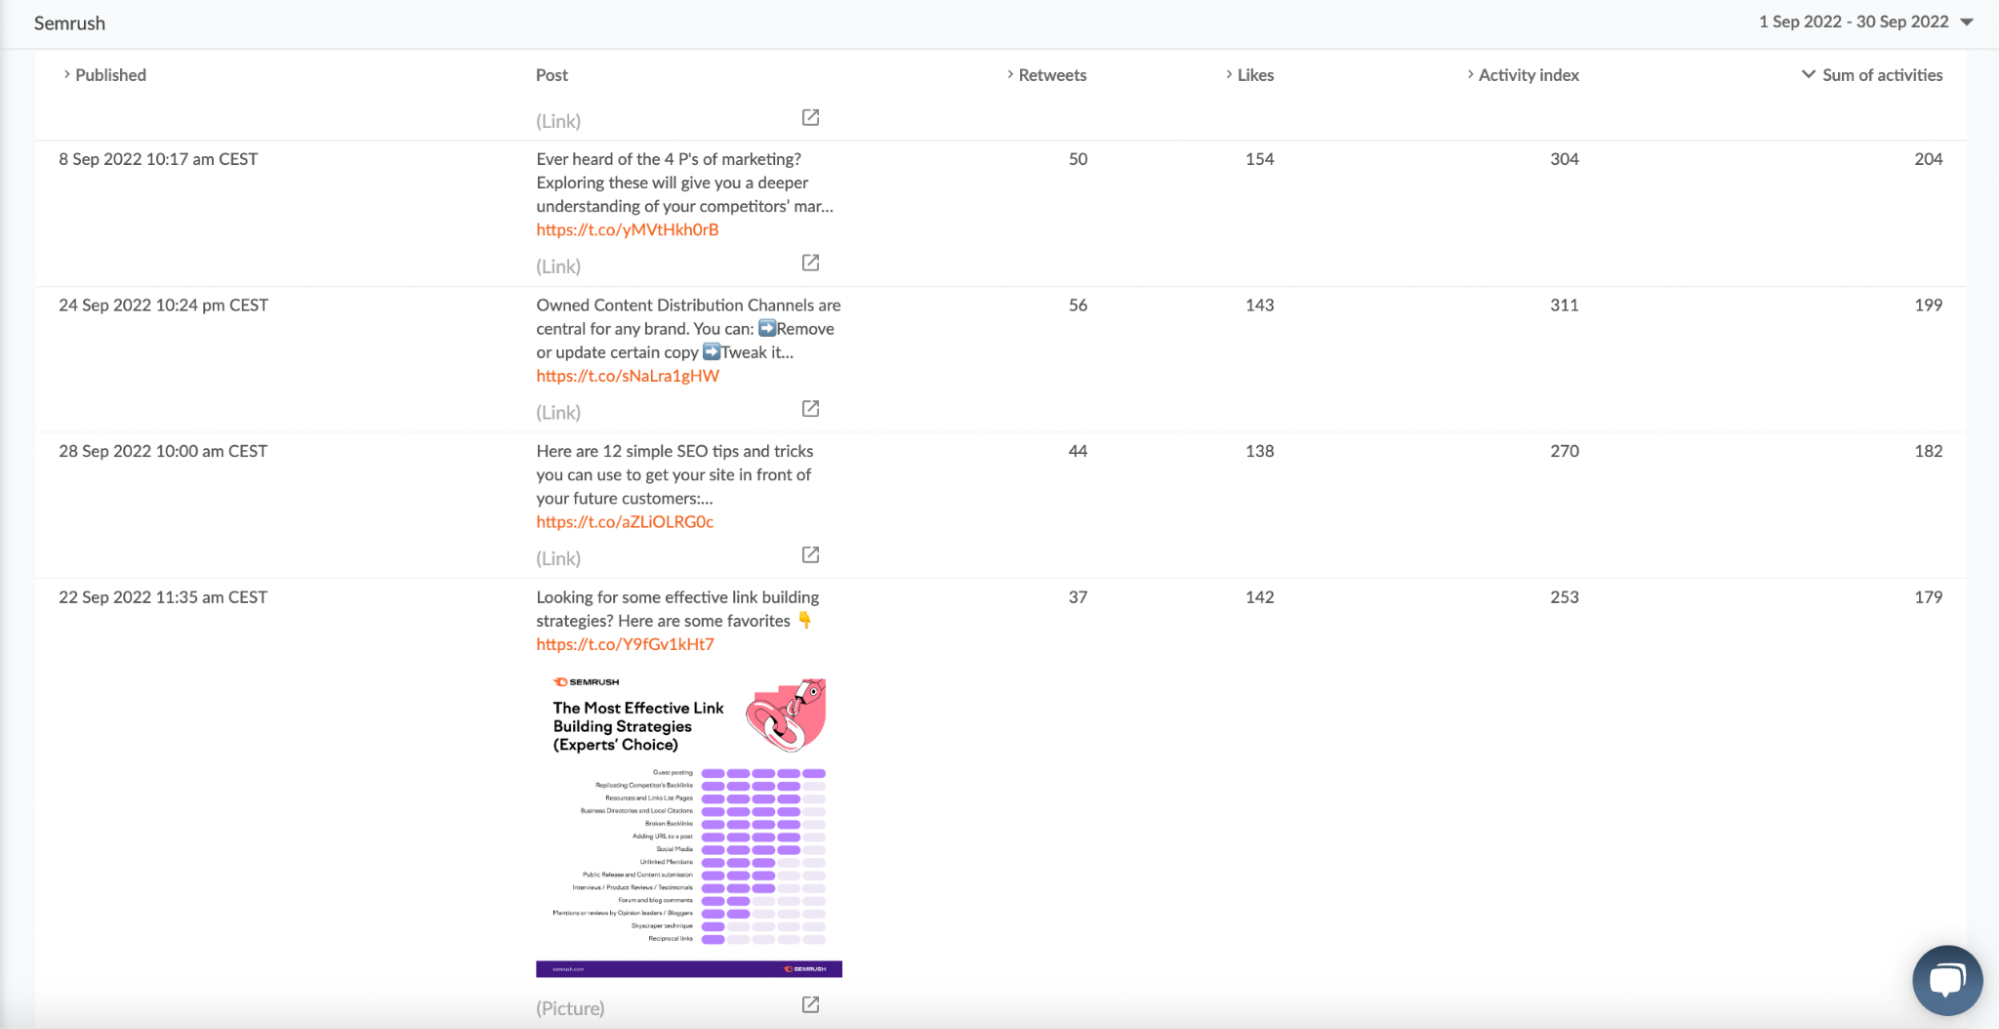
Top posts listing in Sotrender
At the same time, Twitter Analytics enables you to see only one best performing post in a particular month.
Step 4: Compare results with competitors
If you want to grow your Twitter profile, it is important that you spy on your competitors and check their results. In Sotrender, you can easily analyze competitors’ performance and see how you stack up against them. Simply, choose the Comparison section and create a comparison group with profiles that interest you.
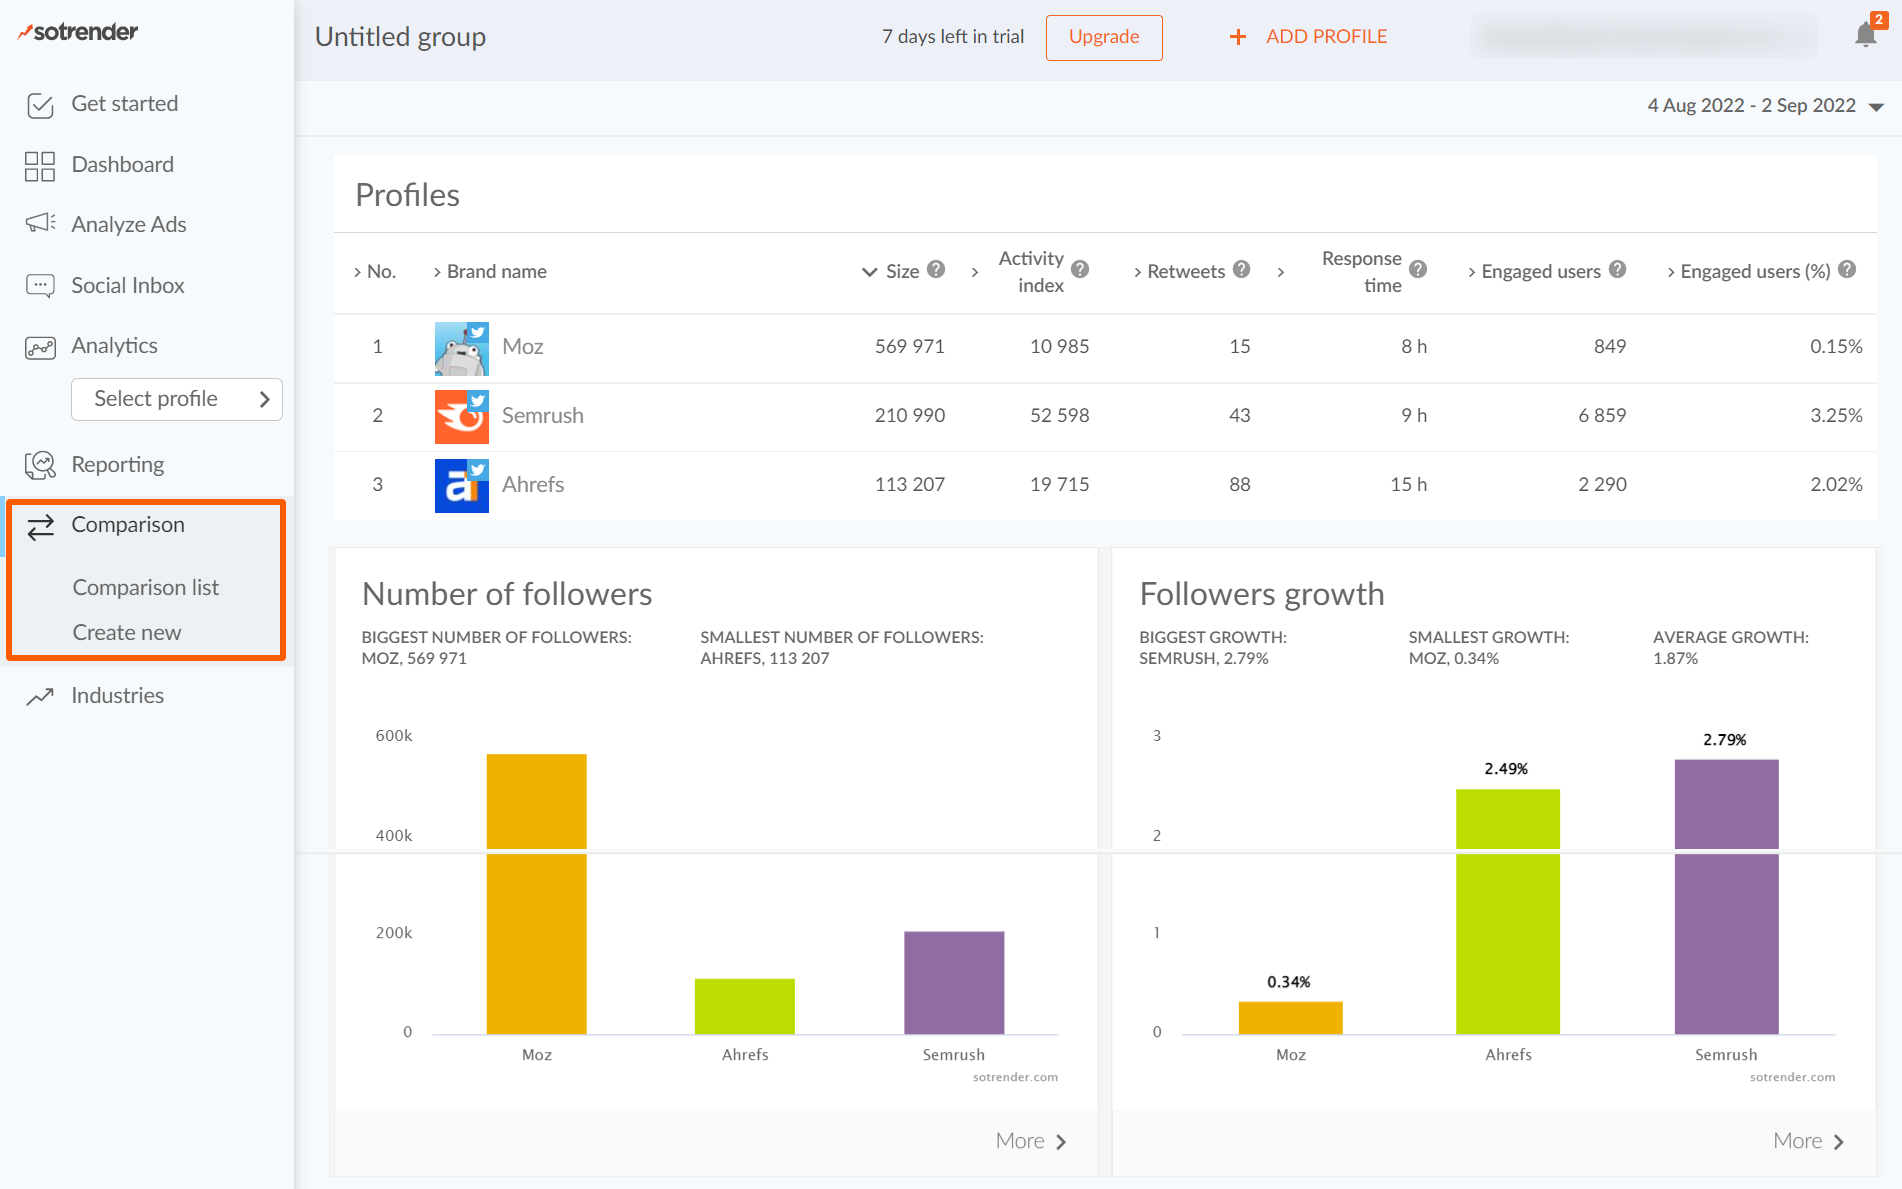
Comparing different Twitter profiles in Sotrender
Similarly to a single profile analytics, within a comparison group, Sotrender enables you to track and compare: number of followers and follower growth, engaged users, Activity Index, brand activities, user activities and top posts of selected profiles.
Last but not least, Sotrender has a comparison report that allows you to see how you stack up against other brands on Twitter. Click on Comparison and add the profiles you want to view side by side.
Such reports provide a leg up from the reports you get from Twitter. They dig deeper, compare other brands, and generate and share reports with your team.
With all the metrics you collect, remember to focus on those that guide and inform the development of your Twitter marketing strategy.
Step 5: Review and act on your reports
Your report will provide you with information about your target audience, type of content, level of engagement, to help you identify areas of improvement. Use this information to identify your next steps to help you achieve your marketing objectives.
For example, a top-level marketing objective would be to increase brand awareness.
That means you may have two approaches as your next steps:
- Identify content topics that resonate with your followers and consistently share them on Twitter to improve engagement
- Work with influencers to share your content with their followers to expand your reach.
See how it all ties back to your marketing objectives?
Sotrender also provides you with tips to inform your next steps (as seen earlier) and you can reinforce your next steps by talking to your team to get more ideas on what to do to improve your performance on Twitter.
Conclusion
Whether you are building your personal brand or working with a company on Twitter, the insights you get from analytics reports should inform your approach towards how you choose to improve your performance.
Sign up for a 7-day trial with Sotrender to get in-depth Twitter analytics reports and craft a strategy that moves you closer to your marketing objectives.


