If you don’t want to spend an arm and a leg on your marketing budget, you should track your Facebook Ad performance. Our analytics team can provide you with a Facebook Ads report which gives you clear and concise explanations about your ads’ performance and recommendations for your future strategy.
Why Facebook Ads?
Although it sounds counterintuitive, Facebook Ads simultaneously allows you to reach a wider yet more specific audience. According to Facebook in March of 2019, 1.56 billion people were using the platform on a daily basis and users spent 20 minutes per visit on average. That’s a lot of screen time for an audience to be exposed to your content and ads if you plan right.
We keep emphasizing that planning ahead, setting goals, and tracking progress are crucial for creating a solid social media strategy. You need to assess how your paid campaigns are doing and whether their ROI is worth it. Ads are a good way to increase reach and sales, but since there’s no one-size-fits-all ad campaign, you have to figure out if your campaign appeals to your audience.
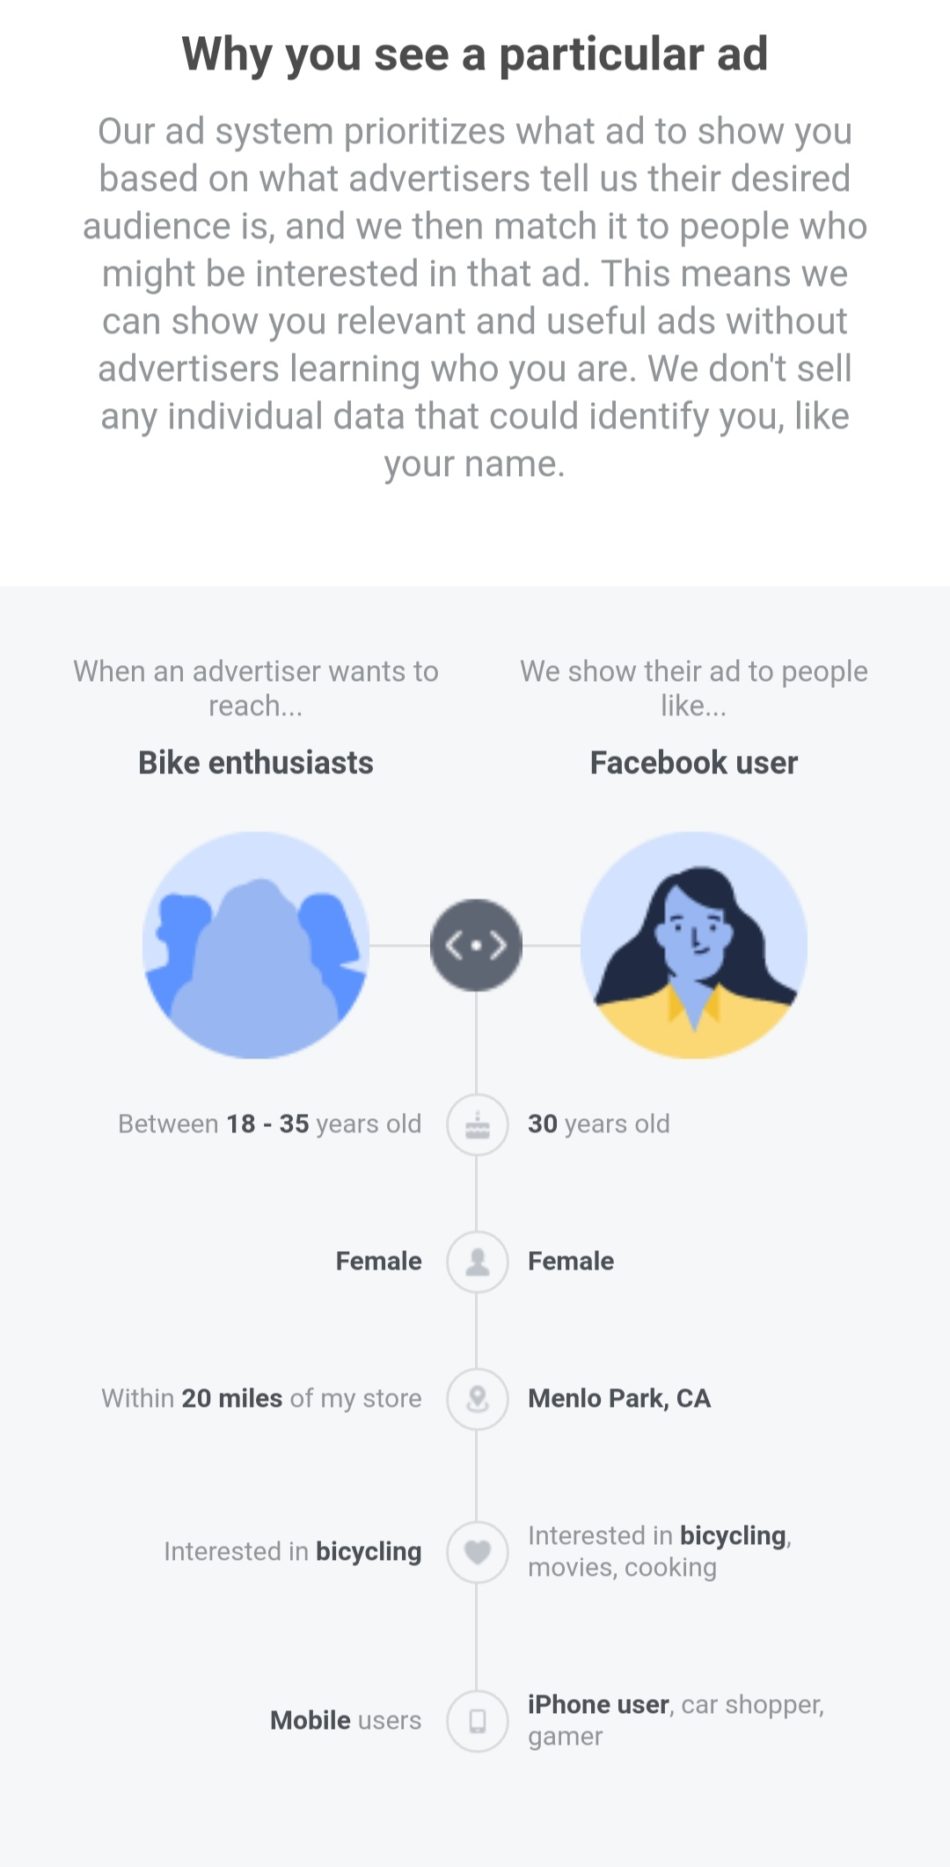
At Sotrender, we believe that a crucial step in this process is finding out who your audience is and what they’re about. You can learn more about your audience by conducting an Audience Scan or just checking your fans’ demographic data in the Sotrender app. Ads on Facebook are targeted based on interests, online behavior, and location, therefore they are more effective. You have to hone in on your audience so that the message of the ad is relevant and useful to them, otherwise, they won’t go through with the purchase.
So how do you make sure you’re not wasting time and money on your ads? The same thing you do with every part of your content strategy: you analyze it, and the best way of doing so is in a ready-made report.
Getting started
You might have started off by using Facebook Ads Manager to see whether your campaign is a success or not. The tool displays the usual social media metrics such as engagement, reach, impressions and more. The problem is, Ads Manager doesn’t make time-frame selection easy. You view the results over a 28 day period or over one day. Clearly, this isn’t how all ad campaigns work.
This is where Sotrender comes in, and our analytics department is ready to perform analyses and generate reports specifically for you. You can specify a date range so you can see whether the ads themselves made an impact, or if your content was more engaging. You just have to specify the parameters to our analytics team and they’ll get on it.
Keep in mind that since this is Insights data, we can only provide you with information about the accounts you have access to. If you have access to more than one brand, then we can help you compare both. That makes things a bit easier, doesn’t it?
The big idea behind the Facebook Ads report
We take data from Facebook’s API and Insights to answer budgeting questions more precisely. By analyzing every campaign and ad individually, you will have a visualization of data that enables you to quickly identify the best ads. The Facebook Ads report will help you see which ads perform best within the given period of time, which were the most and least cost-effective.
This type of report and analysis can answer the following specific questions you might have:
- Which campaigns were the most cost-effective?
- For what purposes can I achieve the lowest promotion cost?
- What type of ads are most effective?
- Which ads cost the least amount?
- Is the daily or total budget better?
Part of the reason why our reports are so informative is because of how the data is presented graphically and verbally. It also saves a great deal of time by cutting right to the chase and selecting only the relevant metrics and numbers.
Report components
Here are some parameters our report analyzes, so you need to know what they are before we move on:
- CPC (Cost per Click): conversions, page likes, participation in the events, link clicks
- CPM (Cost per Mile): brand recognition and coverage
- CPP (Cost per Point): reach and brand recognition
- CTR brand recognition, coverage, and video views
These are all parameters that we report on our findings. They are presented in tables and graphs so that you can make comparisons.
Advertising equivalent
Let’s start with an analysis of advertising effectiveness. Firstly, the advertising equivalent of both profiles on Facebook is calculated using the annual number of hits and the average CPM. 
Through this analysis, we know:
What every zloty spent translates into returns (ROI)
Advertising equivalent of free views
 Advertising equivalent of all views
Types of campaigns
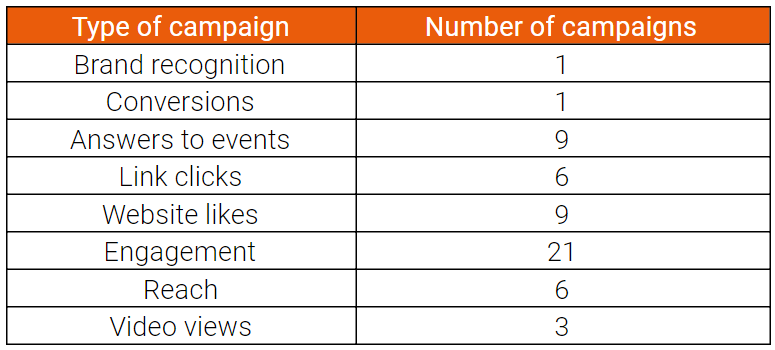
There are different types of campaigns that you can focus on. If your goal is to increase the number of RSVPs to events on Facebook, then we take a look at the frequency of ad campaigns intended for this purpose. By checking the frequencies, we get a rough understanding of what your brand prioritizes in your advertising campaigns.
Note that the ad aim of your choice (reach or brand awareness, conversion) returns better numbers in regards to the type of indicator you’re looking at in the output, including CPC, CPM, or CTR.
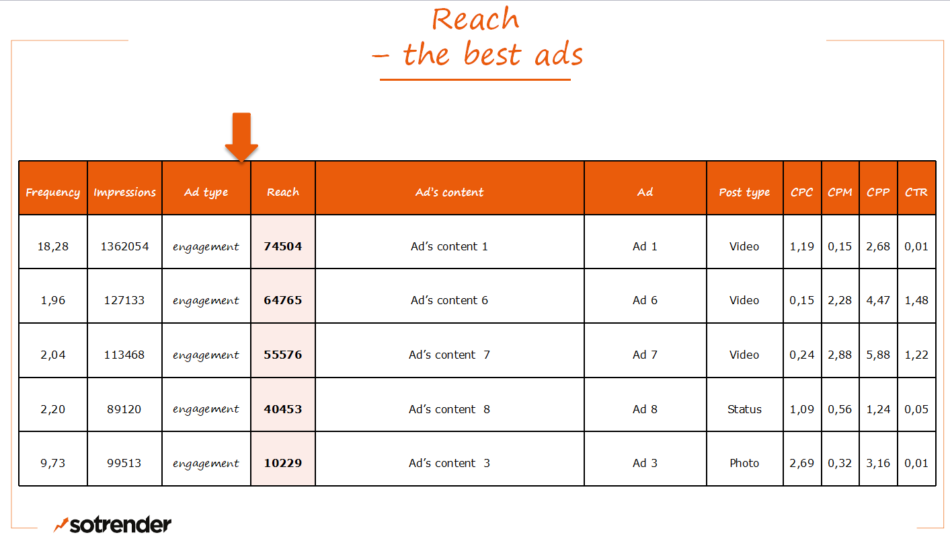
In the case that you want to compare ads across all many variables, the data can also be presented in a table, wherein you can filter the results by metric. In this example, the ads are organized by descending reach. The table presents all of the parameters in one place, along with the type of post, and purpose of the ad.
Estimated expenses
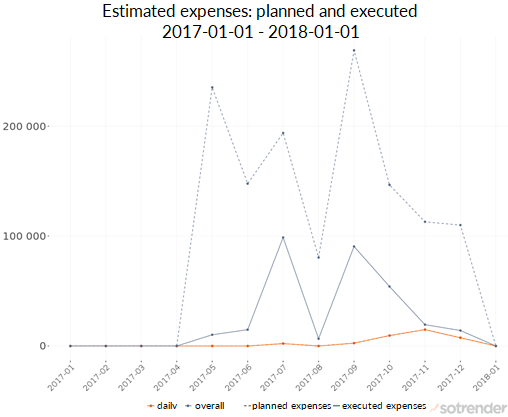
By looking at the daily budget graph below, we can see that there is an incongruence between the planned and executed expenses. This applies to both the overall and daily level. The planned expenses for the campaign were generally higher than the amount of money actually spent on the campaign. Being aware of this can help you anticipate your future marketing budget because you will know how much you could save or should invest. You would also know whether a specific campaign was being wasteful or not.
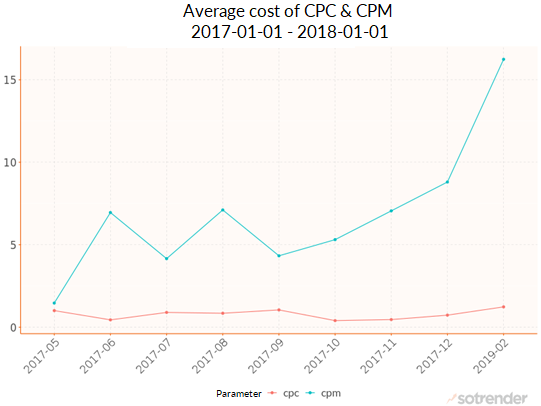
We can also examine the CPM and CPC comparison throughout a span of time. We can see that the CPM was significantly higher than the CPC, wherein CPM grew dramatically until February, whereas CPC plateaued. This graph could indicate how your expenses/parameters are changing and that it is necessary to adjust your budget accordingly.
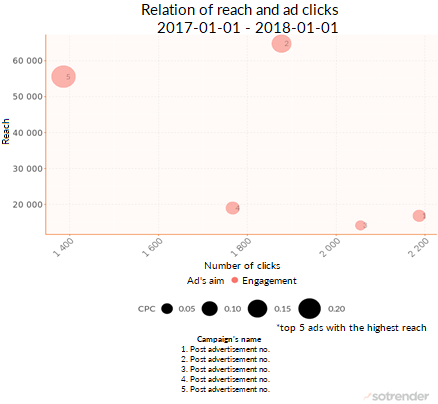
Comparing the campaigns across two metrics allows you to make more specific judgments. Here we can see that although campaign 2 had the highest level of reach, as well as a greater number of clicks. In comparison, campaign 5 had a greater reach, but it performed worse than the rest of the number of clicks. Another performance indicator is the diameter of the points, representing the campaigns CPC.
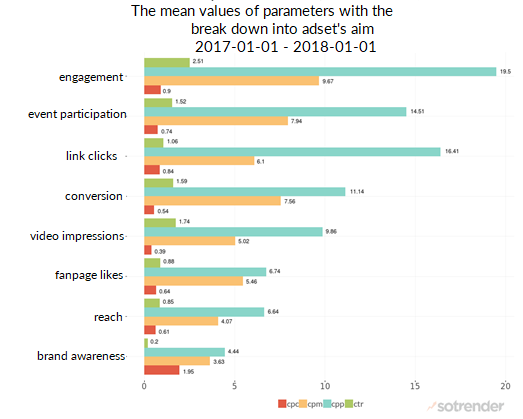
The bar graph below displays each type of campaign’s aim and its parameters. The greatest expenses spent on the CPP followed by CPM were on campaigns aimed at engagement. In the case of engagement, link clicks and conversion amounted to more than 10 PLN. CTR and CPC indicators received the lowest values, particularly with the aim of brand recognition.
Practical examples
If you wanted even more convenience, this is it. We give you suggestions and tips for problems based on the data that we’ve found in our analyses. Here are two examples of potential problems with ad campaigns.
A company wants to check if their budget was spent appropriately to reach its aims since they had a low link click rate and low reach. They could explore how specific aims of ads were covered, the extent to which they were achieved, and which ad and post formats helped achieve them. They can thoroughly check how their ads and content produced an output of CPC, CPM, and CTR in reference to their initial aims.
Don’t break the bank
Not every business decision can be a worthwhile investment, but part of the process is finding out which campaign was a success. When you find that out, you’ll know what your audience responds to, what type of ads you should be investing in, and how each ad ranks in terms of financial gains. All of this will help you plan your budget and strategy better, so both your marketing and accounting departments will be satisfied. 😉
Want to know more about our Facebook Ads report? Feel free to give us a ring at +442033224602, email our sales team sales@sotrender.com, or leave your contact information below.

