
We hope that you’ve already checked and tested the Sotrender design upgrades! Today we’re introducing the next phase of those changes. This part is focused on Facebook metrics which are affected by the new version of their API – but on top of that, we’re very excited to introduce new features and metrics that we’ve implemented so keep on reading!
Update: some of the designs in the app were updated in 2020. Take a look at our newest blog posts about product updates to learn more.
What’s with all the changes?
We’ve been publishing a lot of information about changes in our offer. So it’s for sure that some of you are wondering why this is happening. The main reason for these changes is the release of a different version of the Facebook API which will be introduced on 6th of February, 2018. Facebook will limit access to some data and this is probably caused by the famous General Data Protection Regulation (GDPR) and we’ve had to adjust our tool and product offerings accordingly.
The Facebook API changes will not influence our whole range of offers but only those related to Facebook and the data we’re able to access as a result of the release. In the upcoming months, we will modify our app, custom reports, Trends reports, and partially the Sotrender API. Similarly, the consequences mentioned will apply to all analytics tools that collect and process Facebook data.
In the Sotrender app, users that analyse their own Pages (where you have at least Analyst level permissions) will get new metrics, data, and charts. Don’t worry! Our signature Competitors’ analysis is still possible, but with some slight modifications.
Our offers for other supported platforms will not change at this moment.
So here’s what we’ll be covering in our most recent product update:
- Changes that will affect all Sotrender users,
- Changes that will affect competitors’ profiles,
- Changes that will affect your own Pages (those which have access to Facebook Insights).
What will every Sotrender user see after logging into the platform?
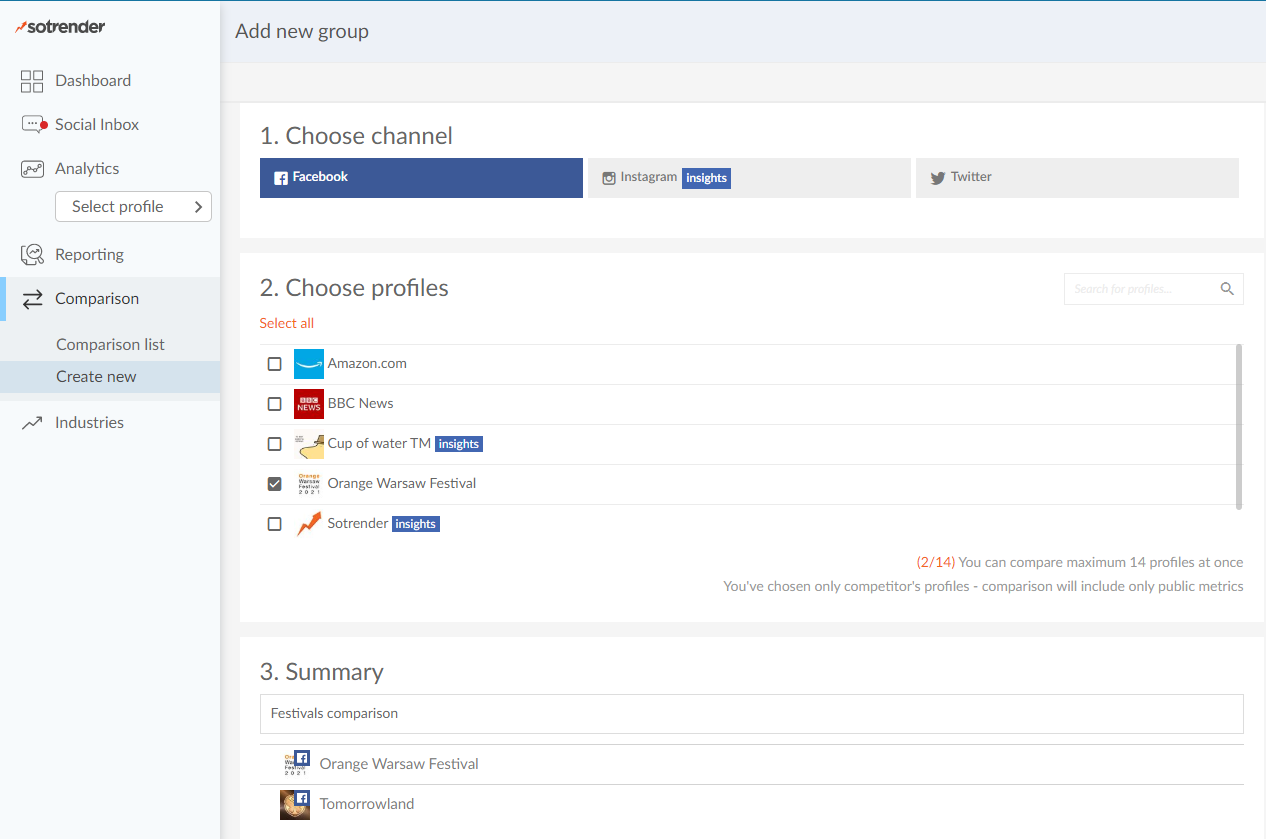
Competitors’ comparison – now faster than ever
The ‘Comparison’ tab received a totally fresh look and feel to it. Now it’s very similar to the workflow that you already know from our ‘Reports’ section. We will take you step-by-step through the process of creating your comparison groups.
Users’ interests
The chart that presented data about the user interests of a certain Page will no longer be visible in the tool anymore – no matter how high your permissions within a specific Page are.
Reporting
This section changed only slightly. Many of our clients still wanted access to the previous versions of reports (with old data). So, this option is available only but for data running up to the end of January 2018.
Choosing any date range beyond January 2018 will not work for the old version of the reports. Visit our blog or subscribe to the newsletter to get a notification about it!

Even more knowledge, thanks to new metrics!
We’re working hard to develop Sotrender and give you more and more features to work with. With the above changes, we’re introducing some of these new cool features.
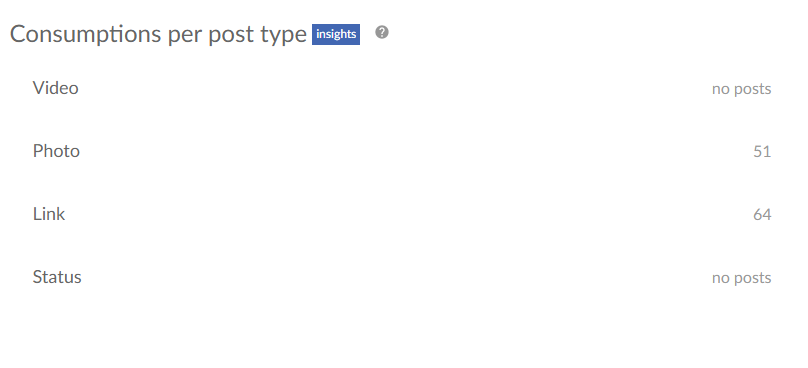
Consumptions – new metric in the Reach & Engagement section
The total number of consumptions indicates the number of clicks anywhere within your post. This metric is very valuable as it helps you identify the types of posts that engage your users the most.
In the Consumption tab you can find the following charts:
- The number of consumptions broken down into post type – photo, video, link, or status.
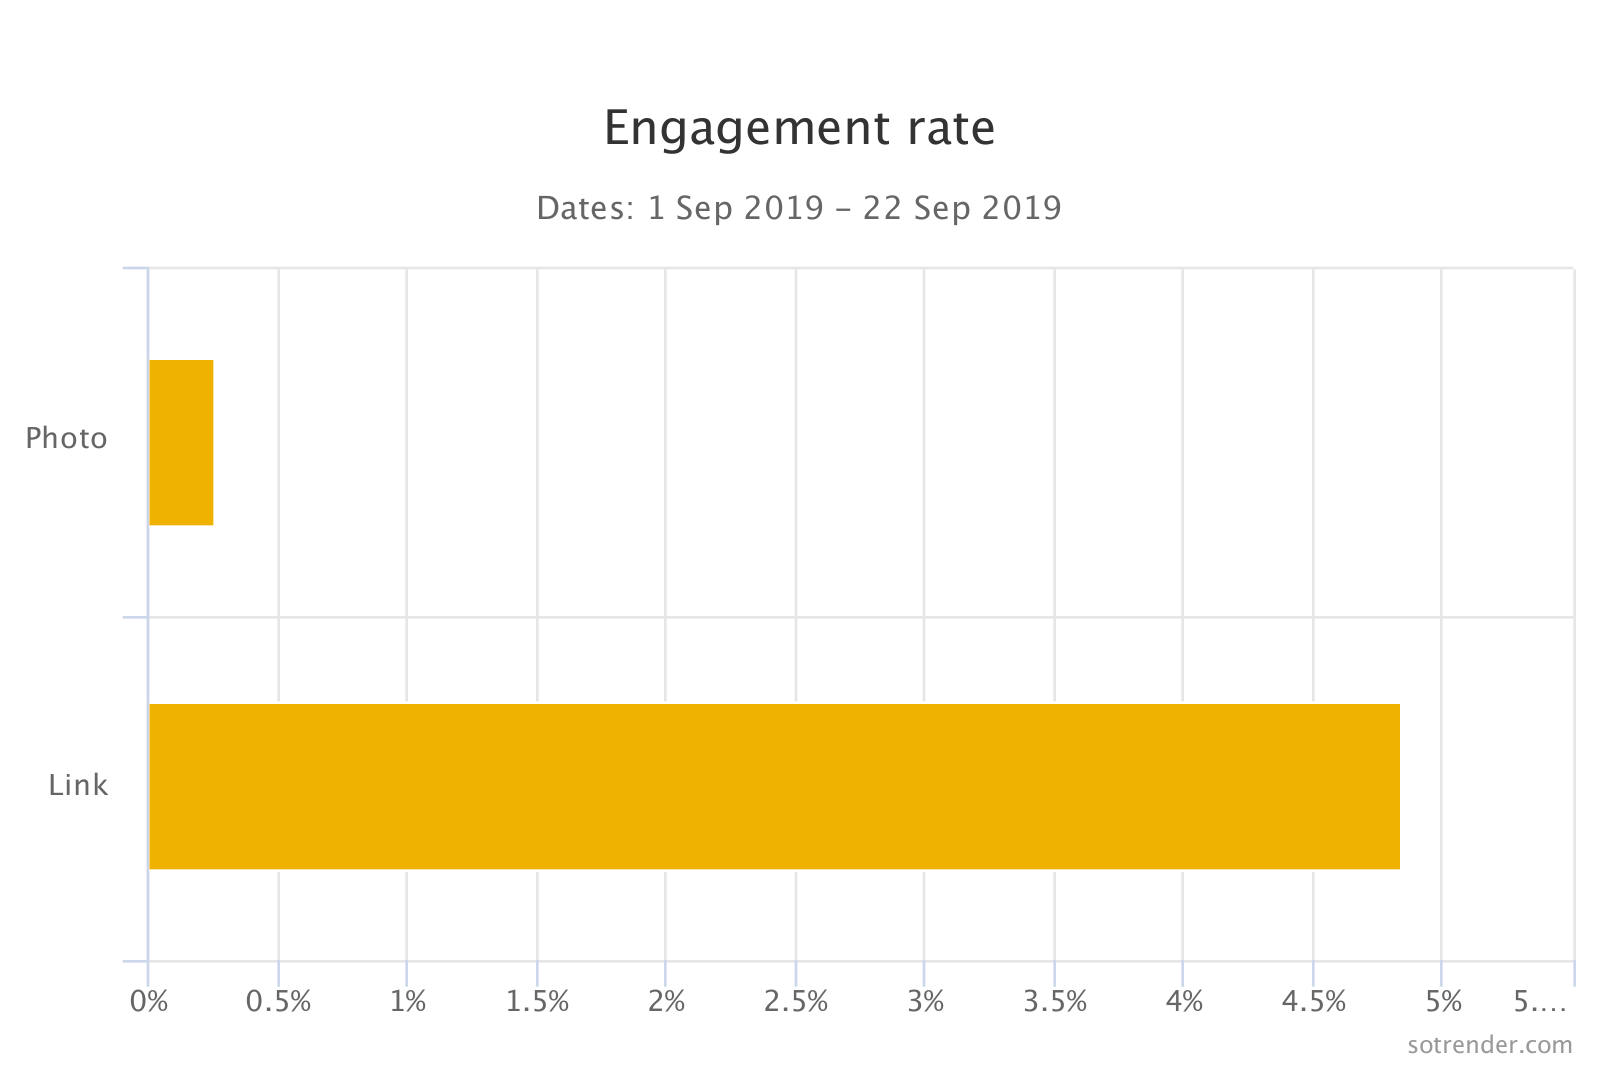
- Engagement Rate represents consumption levels based on the post type – this metric is measured by dividing the number of consumptions by the number of views.

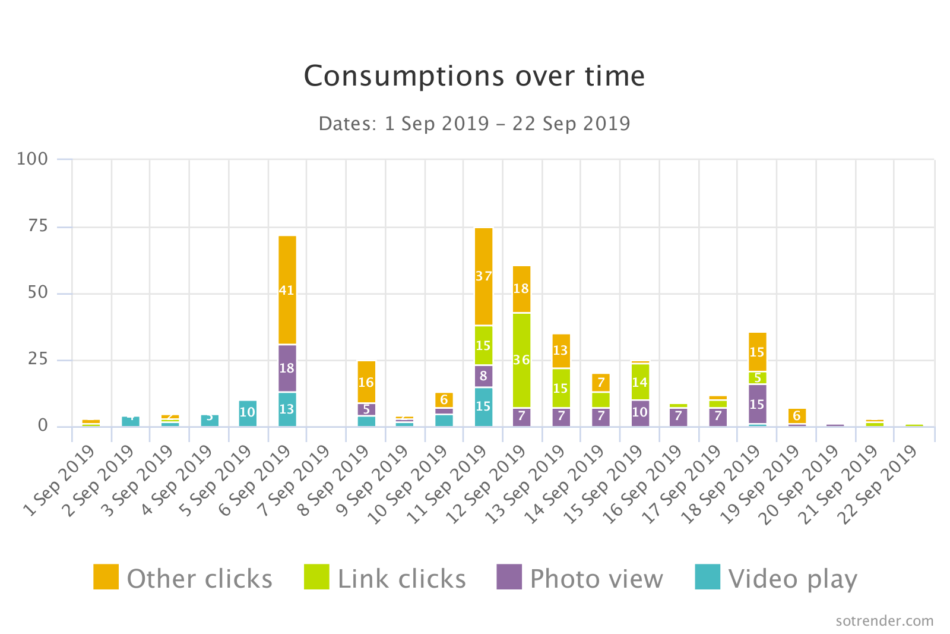
- Consumption over a period of time – where the data we’re presenting broken down into days.
- Consumption share – the share of consumption of a given post type in the total number of consumptions of an analysed Page.


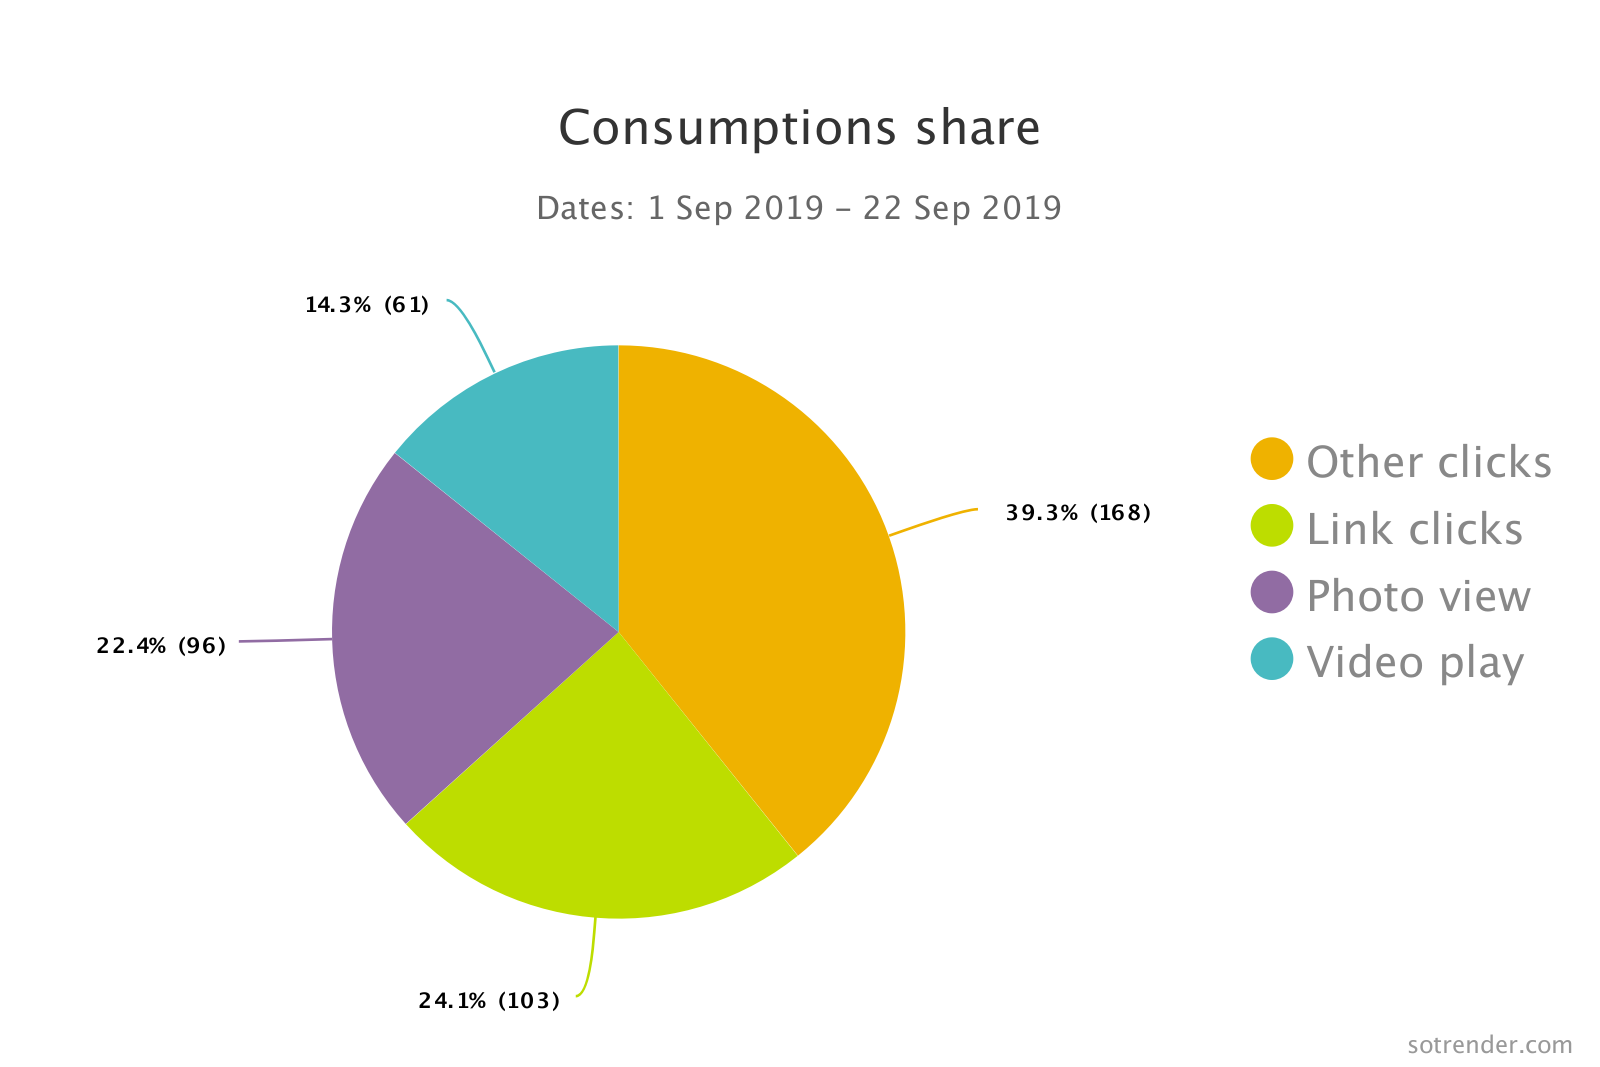
The Consumption metric is available only for own Pages (ones which you have Insights access to).
Interactivity Index Heatmap
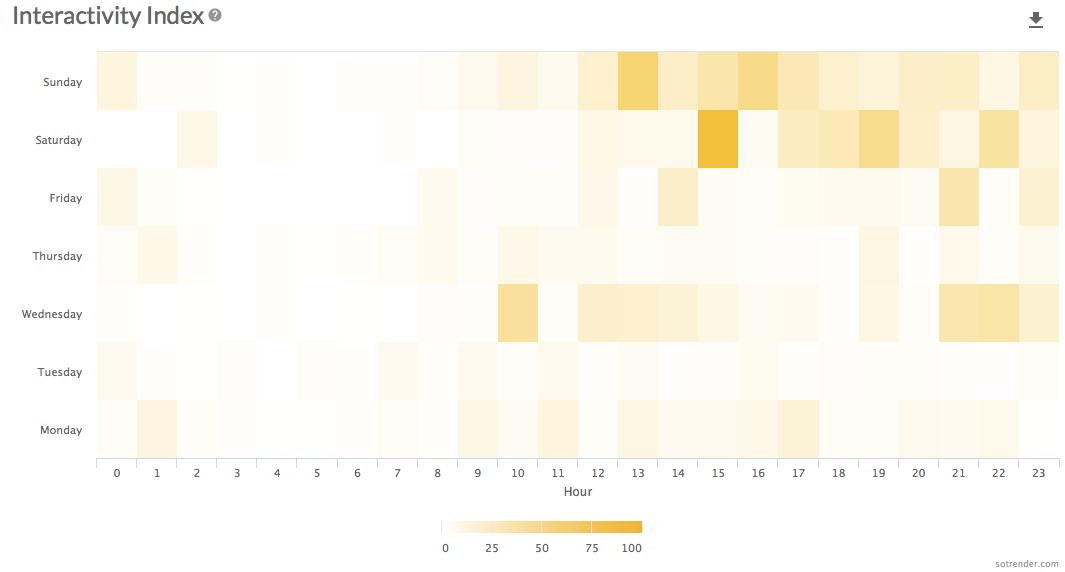
The Interactivity Index heatmap is another type of chart in Sotrender. It shows how intense users’ reactions towards Page communication were and when during the week they were happening.
The heatmap is purely based on the Interactivity Index. As a reminder, this is a composite, weighted indicator of all activities on the profile. It includes various activities such as likes, comments, posts, or shares. These activities have greater weights based on how they increase post visibility to others and how rarely they occur.
The cool thing about this chart is that it combines data from a few other places and shows you exactly when the level of engagement is the strongest.
Interactivity Index Heatmap
The heatmap is now available for all profiles – no matter what kind of access you have for them. You will find it under the ‘Reach & Engagement’ tab, after clicking on the ‘Interactivity Index’ chart.
Love, Haha, Wow – all your users’ reactions in Sotrender
Do you know how users are reacting to your content? You can analyse it and find out in Sotrender! The following new chart will display when and how reactions happened over time. To see the new reactions chart, go to ‘Audience’ and then click on the ‘User activities’ box.
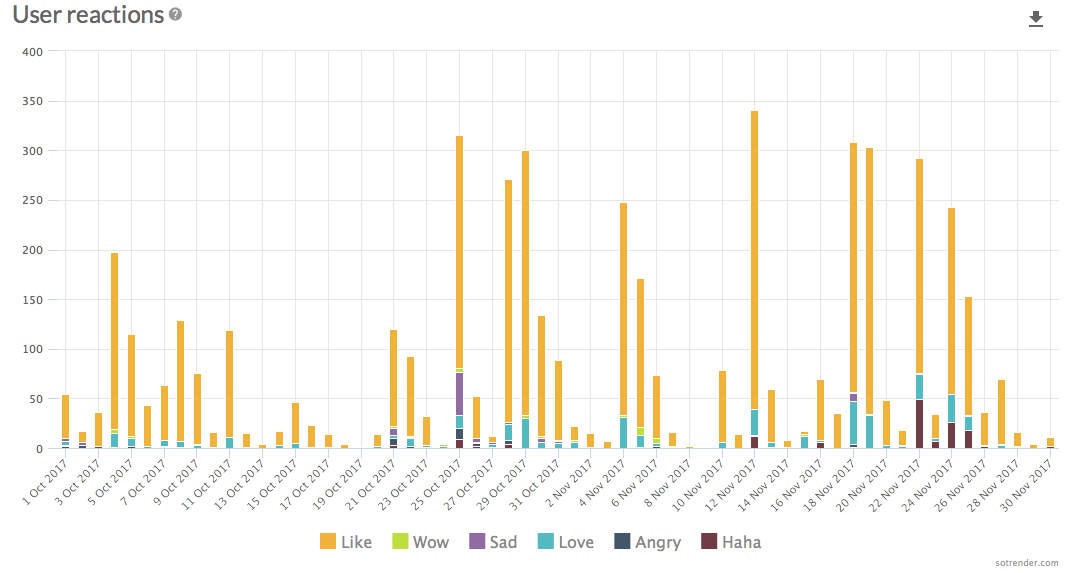
User reactions over time
Below you will also find a pie chart that will present proportions of an individual type of reaction in relation to all of them.
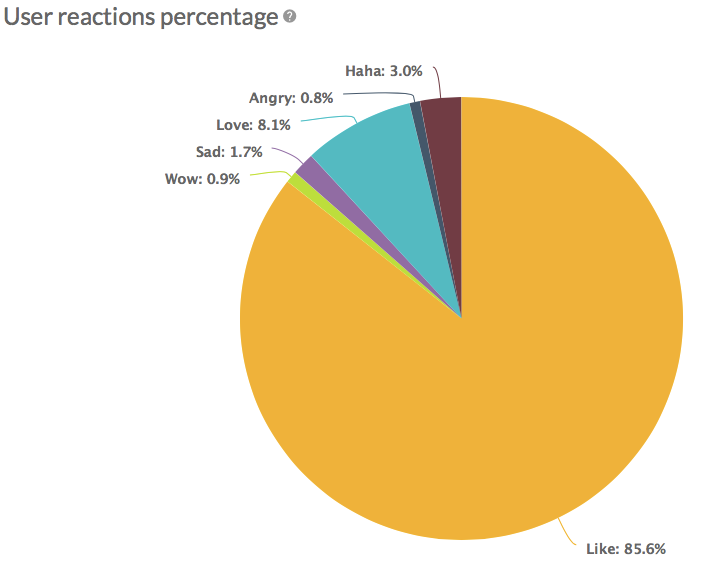
Percentage of users reactions
Video posts
Within the past few years, video has come to play a vital role in social media strategy. That’s why we’ve decided to move video posts stats to a separate view. It will look similar to how posts were displayed. However, video posts will show relevant metrics. This part is available only for your own Pages.
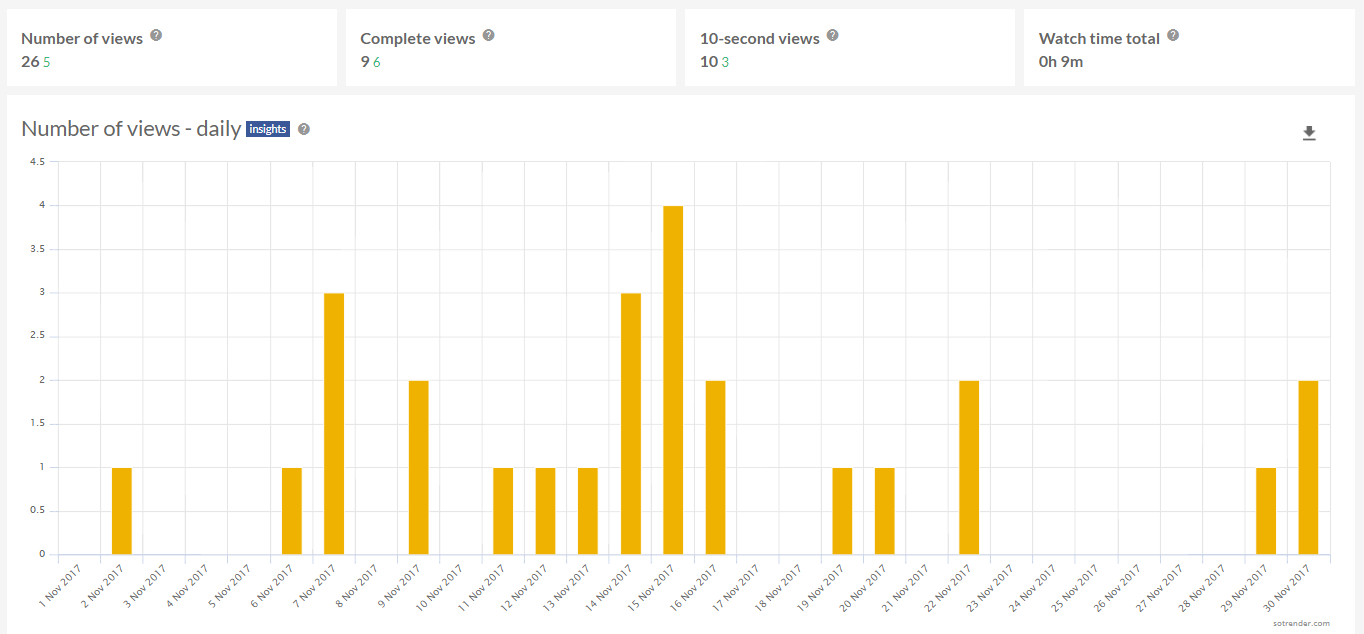
Number of video views
Remember that we’re showing only data for video files uploaded directly to Facebook – so posts that only contain URL to for example YouTube or Vimeo, wouldn’t have any results as they wouldn’t be counted as native video posts.
Relative PTAT
You’re probably already familiar with the PTAT metric (Storytellers, People Talking About This). Another new chart that was introduced today is Relative PTAT.
This indicator informs you about the number of people who interact with the Page and the content published by it in relation to the number of fans of the Page. Relative PTAT takes into account the different user actions regarding the organic and paid content of the Page. This metric is available for all Pages – your own and the competitions’s.
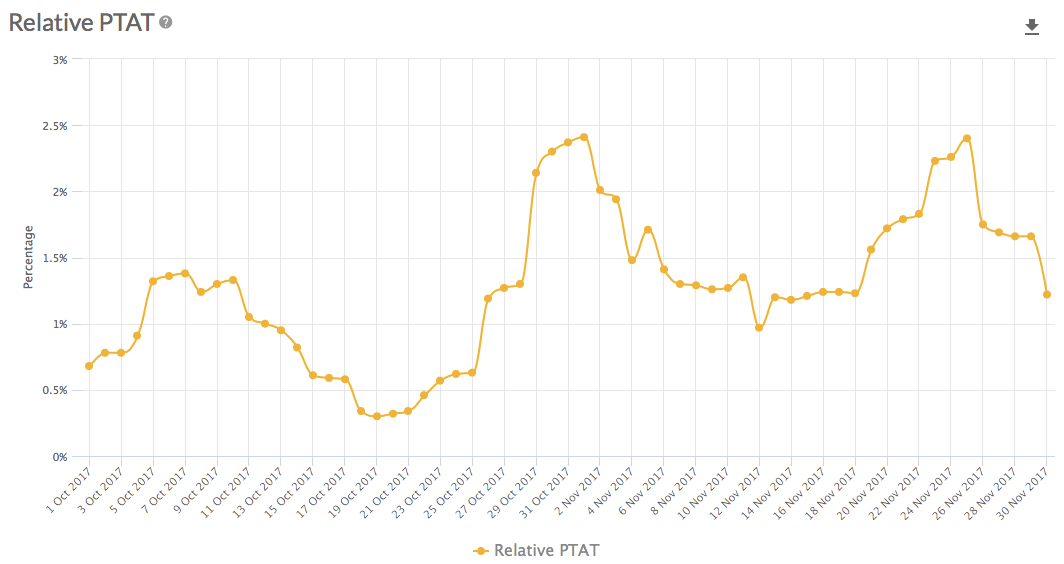
Relative PTAT
Competitors profiles – will I see less now?
Unfortunately, yes. The new version of the Facebook API is limiting access to some information that we can pull and access; especially for Pages that we don’t have any permissions for (Insights data):
- Content tab: Communication strategy,
- Audience tab: Active users, Segmentation, Community ranking, Number of fans in specific countries.
Will anything else change for my own Pages?
The good news is that for your own Pages, you will still see all data and charts (remember about all news mentioned above 😉 ).

Should I expect any more changes from Sotrender?
Yes, but we’re happy to say that most of them will include new features and options. As always, you will be the first to know!
In case of any questions, doubts, or needs, don’t hesitate to contact our awesome Support Team: support@sotrender.com.


