
As we mentioned in our previous update, the beginning of 2018 is an intensive time for Sotrender. This thorough focus has already resulted in a few changes and new features. These updates stem from a few things: feedback from our clients, internal tests and analyses, and changes from supported platforms. Let’s first take a look at the new navigations and dashboards.
Navigation – Find what you need
Sotrender’s main menu has gone through an important transition. Our tabs are now divided into two main sections:
- Your profiles and adding new ones.
- General tools.
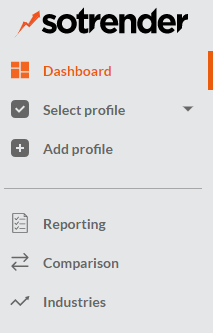
New navigation and dashboard
The first section contains the following:
- Dashboard – Default landing page after login.
- Select profile – Choose one of your added profiles and see detailed options.
- Add new profile – This is exactly what it sounds like.
Finding and choosing a profile in your account is now more convenient than ever, all thanks to the search engine and new filters. You can now sort by the type of profile (yours and competitors) or channel (Facebook, Instagram, Twitter, YouTube). On top of that, you can combine filters for more precision. You can also see the number of profiles of a given type on each button.
New navigation
The second part of the menu is for general functions. That means Reporting, Comparison, and Industries. The content in these tabs is currently unchanged.
Changing the navigation is not yet associated with changes in the graphs themselves.
The new navigation has been designed with logic in mind. That’s so you can quickly find the data you need for any selected profile. Your own profiles have been separated from your competition’s profiles, which is especially important for users who have a lot of profiles on their account.
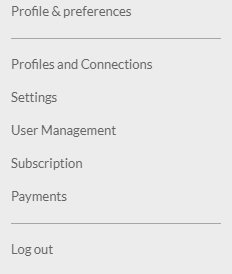
Settings – now in the upper right corner
We have also moved the account settings to the upper right corner. As of now, you will find things like the language settings, payment, logout, and more.

Dashboard – The most important indicators, all in one place
Another change we implemented is the Dashboard, which clearly displays basic data for your profiles. This is the first screen you’ll see when logging into Sotrender.
New dashboard
This panel is being introduced mainly to make your work more comfortable. Without having to go through any tabs, you’ll quickly see the most important changes that have taken place on your profiles.
The panel is activated automatically if you have at least two profiles for a given medium. In the case of Facebook, they must be your own Pages (Pages which you have Analyst level permissions). In the case of other platforms – any two profiles. The panel displays data according to four predefined periods:
- This week (data displayed from last Monday to the present day).
- This month (data displayed from the first day of the current month to the present day).
- Previous week (data for the last full week, always counted from Monday to Sunday).
- Previous month (data for the last full month).

New dashboard – predefined periods
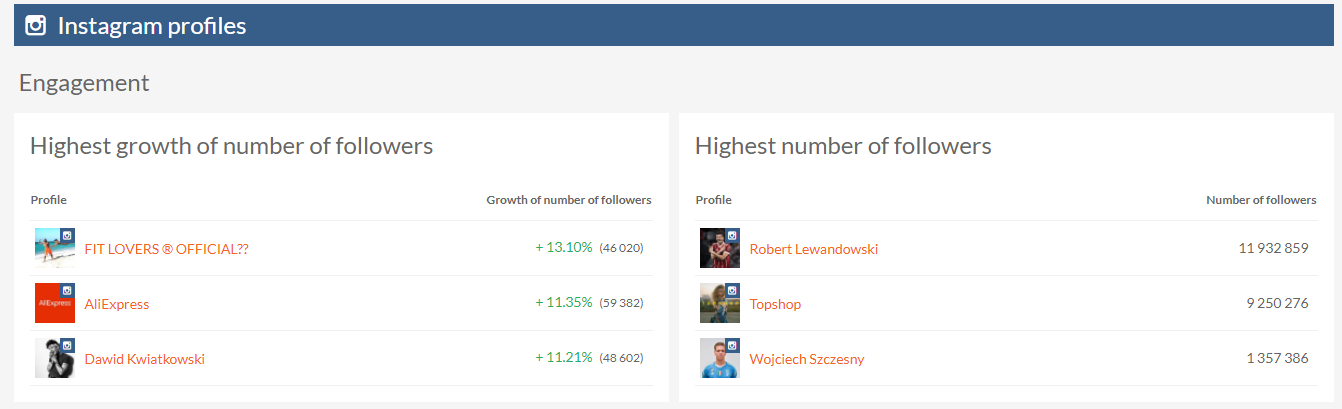
What information is visible on the Dashboard? The most important indicators for most users, including: change in the number of observers, reach, best posts, and the Interactivity and Activity Indices. At the moment, it’s not possible to personalize the dashboard.
For all users, especially those managing multiple profiles, this will be a huge improvement. That’s because you’ll be able to check the most effective profiles from all 4 platforms (Facebook, Twitter, Instagram, YouTube), all in one place.
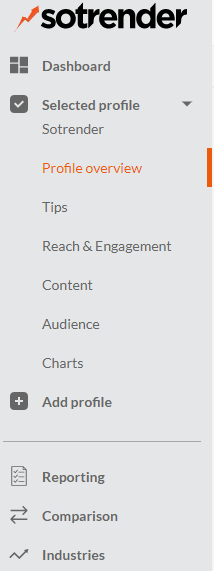
Profile overview – Quick access to key profile data
Profile overview is another new addition to the tool. This is where you’ll find key charts and indicators for a given profile. Similar to the Dashboard, a similar set of data is available in the Profile overview, but with greater detail.
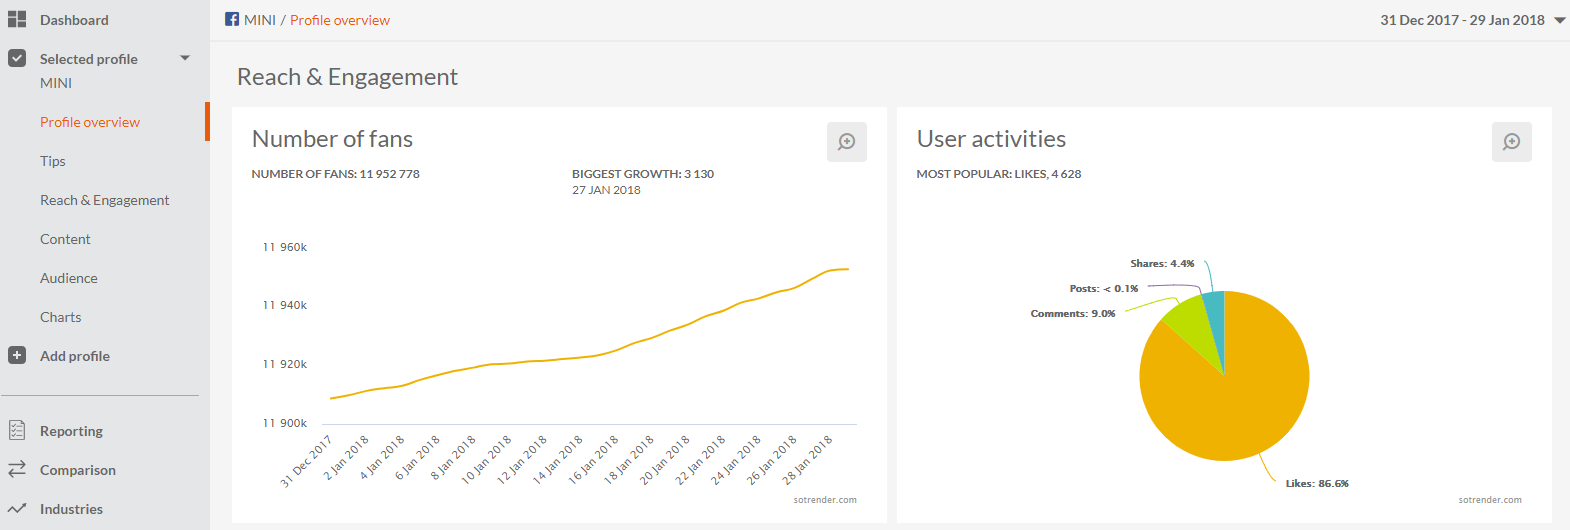
Profile overview
After expanding the side menu, you’ll see some familiar tabs: Tips, Reach & Engagement, Content, Audiences, and Charts. Each contains more detailed data about your profiles.
In the Charts tab, all Sotrender charts will still be available. As in the previous version, you can personalize and set charts to suit your needs.
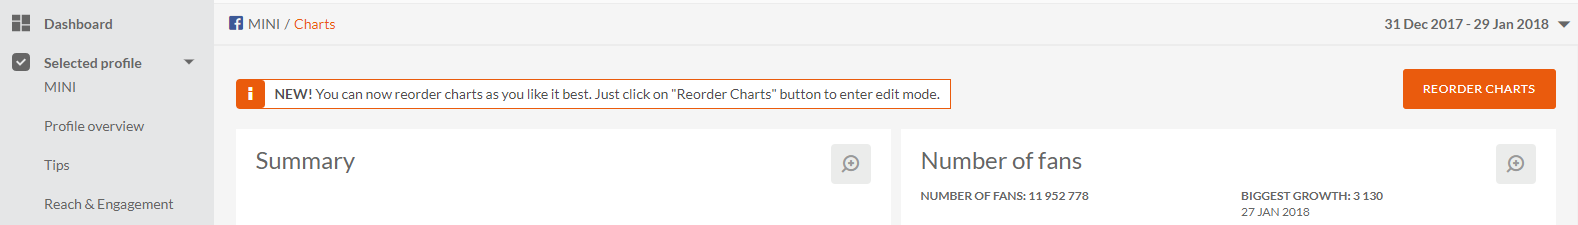
Reordering charts
The analysis of data and efficiency regarding individual profiles has therefore been systematized. Step by step, you can now go from general to detailed views and get deeper into the data that interests you.
GDPR and Facebook API change – What will happen?
Facebook announced a few significant changes for the beginning of February, mainly related to the Facebook API. It is certainly also related to the EU Regulation of the GDPR, which many entities soon have to adapt to. All this will affect the functionalities and data available in Sotrender, as well as all analytical tools of this type. In the case of Sotrender, not only will our tool change, but also our paid reports and Trends reports. But don’t worry, we’ll keep you informed of any and all changes.


