Major sport events are reflected in social media too. Games, clubs and players trigger emotions, which are expressed on Facebook or Twitter before, during and after the game, usually using so-called second screen – a smartphone, tablet or laptop. So who leads on social pitch of UEFA Champions League?
A few hours before today’s final on Wembley we present an analysis of what was hapenning in social media during and after semifinals. Although Barcelona and Real Madrid are social media giants, there were the semis winners – Bayern Munchen and Borussia Dortmund – to triumph on Facebook and Twitter.
You don’t need to be a sports fan to know about great triumph of German football teams, Bayern München and Borussia Dortmund over Spanish FC Barcelona and Real Madrid in Champions League semifinals on 23rd and 24th of April. We would like to demonstrate how real-life events influence the activity of fanpages’ fans. If you’re a fan of any of these teams – keep reading to find out how your team gets along in social media competition.
Basic numbers
The table below shows what’s current situation on most popular social networking sites, analyzed by Sotrender:
| FB fanpages | YouTube channels | Twitter profiles | |
| Barcelona |
42 582 918 |
847 922 |
9 005 920 |
| Bayern |
7 145 726 |
65 085 |
355 797 |
| Real |
38 270 303 |
716 292 |
7 790 472 |
| Borussia |
2 577 314 |
43 851 |
321 730 |
As you can see Spanish teams have way more fans, subsribers and followers than the German ones. FC Barcelona’s fanpage has most fans from Indonesia, Mexico, USA and Brazil – Span is only fifth. Real Madrid is in a pretty similar situation, but a great group of its fans comes also from Colombia and Turkey. Bayern Munchen has fans from Germany (most of them), Indonesia, Egypt, Mexico and Brazil. Borussia’s fans come from Germany, Poland and Turkey.
Let’s move on to comparing the change in performance of these clubs on Facebook.
Fans growth Champions
What first comes into mind is to check how fan base of these football clubs’ fanpages have changed. Since these pages have millions of fans (from 2.3M fans of Borussia to 42M fans of Barcelona), you wouldn’t see a thing on a chart comparing number of fans. Way more usefll is comparing the actual number of new fans. If you have ever used Sotrender you would say it’s pretty easy – in section “Reach” click on tab “Growth” and this is what you will get:
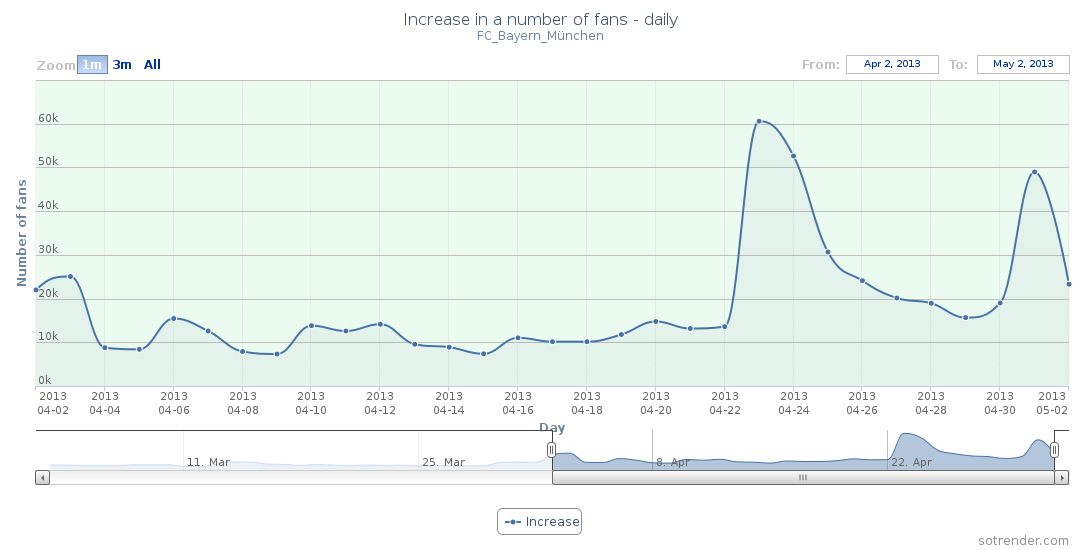
The figure above shows that on the match day and the day after Bayern gained way more fans than on average day. An average number of Bayern fans increases by about 12k while on match day the increase was 5 times bigger. Same figure for Borussia shows similar relationship, but their fans growth was 10 times bigger than the average (40k vs 4k new fans). If you think it is normal when teams compete in semis of Champions League, you would be wrong – the same figures for Barcelona and Real Madrid show no exceptional growth.
Little against the giants
As you have just read, h it is useful to compare increases instead of total number and outcomes with the average values rather than with each other. It is actually a way of making relative comparisons, which is crucial when we want to compare fanpages with different number of fans. This is our case since Barcelona has 42M fans, Real Madrid almost 38M while Bayern 6.6M and Borussia only 2.3M fans. Sotrender is a tool designed to give you a holistic insight into data, so it is equipped with relative indicators. One of them is Relative Interactivity, which is a collective rate of all fans’ activities within a fanpage that considers also number of fans. The value of this indicator is shown on a figure below:
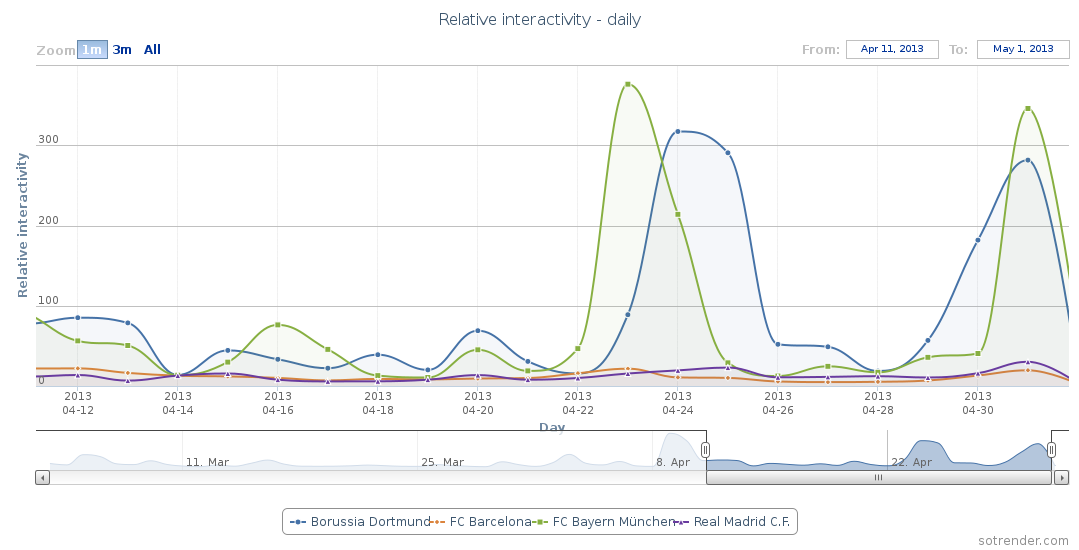
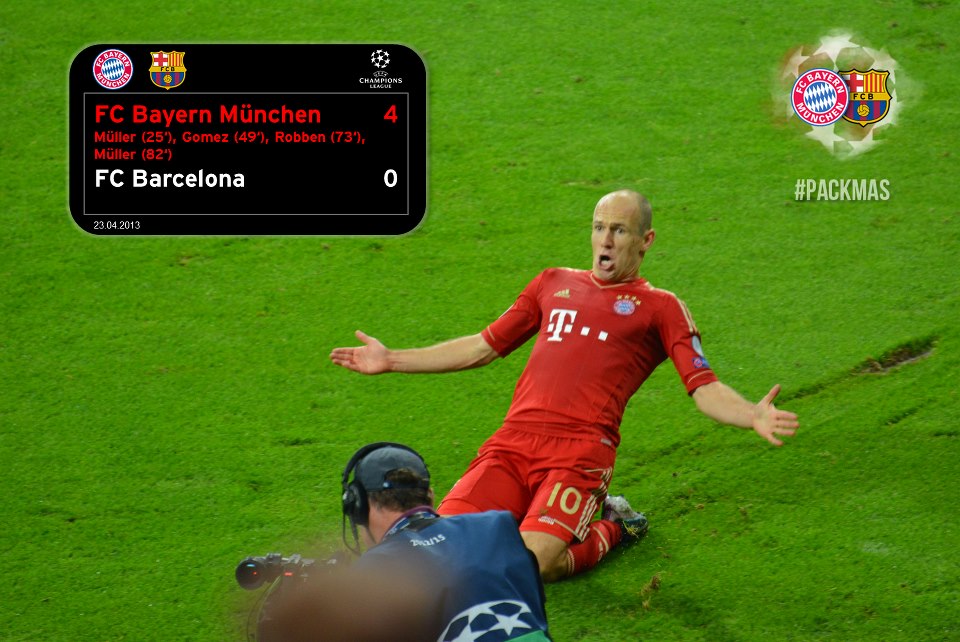
The peaks on this figure are Bayern (the peak on 23rd of April – the day of the game against Barcelona and the peak on the 1st May – the second game) and Borussia (the peak on 24th – the day they won against Real and on 1st May – the day after second game). As you can see Barcelona’s and Real’s values are shown by a low, flat lines. There were no changes around the time of the matches. Both winners have also won the competition on Facebook and the symbol of their social triumph is fact that the most popular post on global Facebook after the first game was the post on Bayern’s fanpage, that collected over 200 000 likes, 8 900 comments and 50 000 shares with this photo of Arjen Robben celebrating his goal:
Sotrender not only gives you Facebook statistics, but also provides insights regarding YouTube and Twitter profiles. It takes a few seconds to take a look on how number of comments under YT videos has changed in past month on official profiles of talked-about football clubs. The fact that Real Madrid with 661 667 subscribers got 435 comments, while Borussia with 33 141 (20 times less) got 343 comments – speaks for itself. We chose to include the figure for Real Madrid:
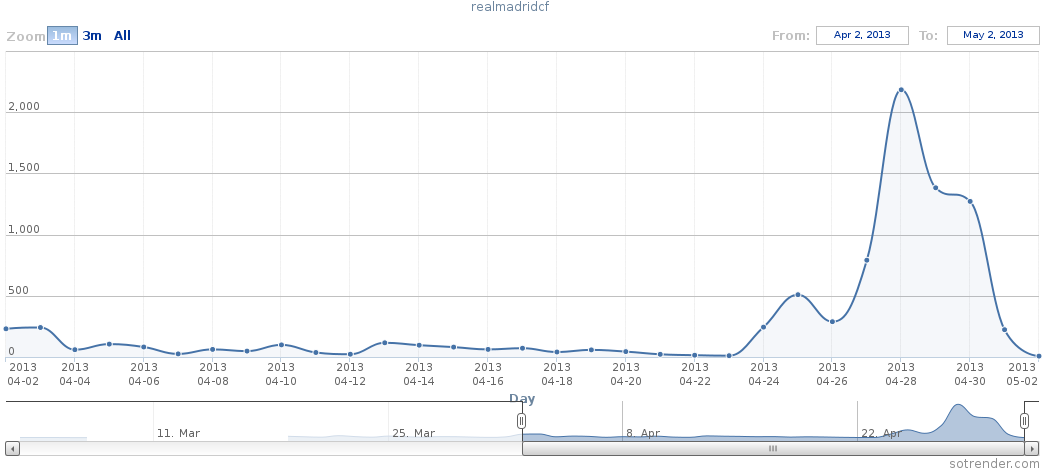
What is interesting, while Borussia got most comments on the days of the game, Real got most comments after first loss and before second game. Maybe it was the effect of post-losing moaning or hope raising.
All figures shown above are downloaded directly from Sotrender, so you can easily check if it’s true. But if you don’t yet possess an account you should try a 14-day trial – you’ll be instantly able to conduct a similar analysis for your pages.
Games spent on Facebook
Let’s now take a look on the time of activity of Facebook users. Below you can see a figure for Bayern’s fanpage. It shows the number of comments added per minute before, during and after the game. The time of the game is marked with grey area, the minutes when Bayern scored goals are marked with red dashed lines and posts added by page administrator are marked by red dots:
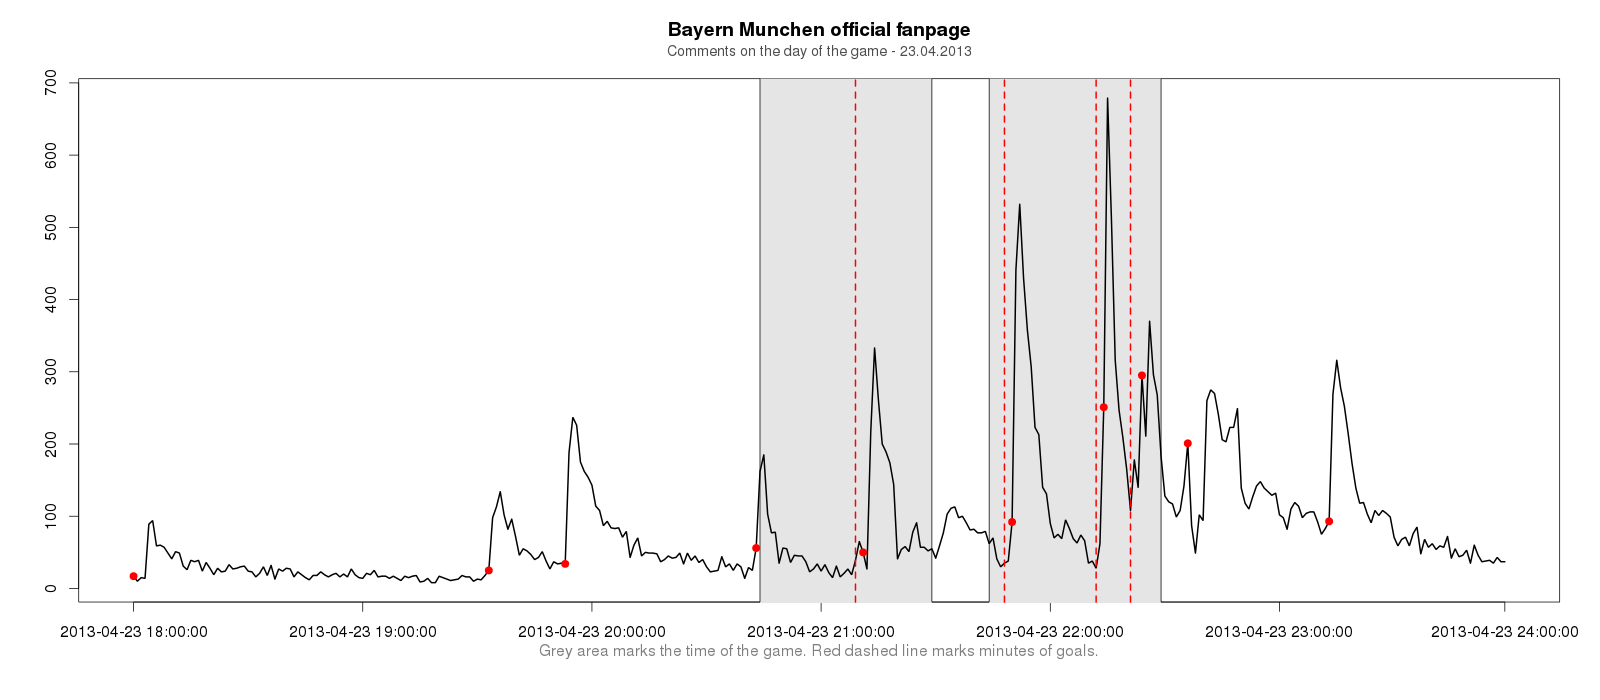
Most comments were added during the time of the game and vast majority of them was written shortly after scoring goals by Bayern. At the age of social TV that clearly indicates second-screen experience. Users watch the game, but after seeing the replay of scored goal they open Facebook and express their joy there. Most importantly the peaks of number of comments depend on page administrator, who adds post in crucial moments of the game.
As we have shown social media activity is stricly connected with the achievements of the team. If you want to measure the social competition of you favourite team or track your own social media channels – contact us.


