Reach and impressions. You probably have heard of those two metrics in social media marketing a lot, right? Why should you even care about them? Well, they are one the most crucial metrics that help evaluate performance in social media and you need you to understand them if you want to manage social media profiles effectively.
That’s why we have this guide for you. After reading it you will not only know what is the difference between reach and impressions, but also how to analyse them and how to use data to set strategic goals in your social media marketing.
Reach in social media – what is it?
Fortunately, reach in various social media is defined similarly. It is a number of people that saw your content, whether it appeared organically on their news feeds, shared or commented by their friends or it was an effect of a paid campaign. The greater the reach, the higher number of people that saw your content – it’s that simple.
Impressions in social media – what are they?
Impressions, on the on the other hand, are a number indicating how many times your content was seen by users. It is always bigger than reach. If your content was first seen by a user in their newsfeed and then appeared in it again (when, for example, someone in their social network shared it), and they saw it, each instance is counted separately. Effectively, it means that impressions are never smaller than your reach.
Reach and impressions – why are they important?
Both metrics are important in social media analytics. They show how many people saw your content and how frequently. In the days of social media and constant scrolling through news feeds on Twitter, Facebook and Instagram, content which is seen once will no longer have an impact.
Impressions are a crucial metric in paid campaigns – you want your content to be remembered. They are also important in organic communication – higher impressions number suggests that people go back to your content or that the algorithms showed it more frequently – both of those things are indicators of matching the interests of your target group.
How to analyze reach and impression is social media?
You can analyze both metrics in the rudimentary analytics tools provided by the social platforms itself, but hey have a lot of constraints. For example, Facebook and Instagram provide limited insights into historic data, either 7 or 28 days. This timeframe is too short to get deep understanding of trends, your performance and how to improve it. For all this you need an external tool that provides you with historic and detailed data on reach and impressions. Like Sotrender.

We offer deep analysis of your reach and impression on Facebook and Instagram. You get an access to at least 30 days of historic data (in need of more, just write us!). You can also check your average reach and impressions number, when you got the higher reach and impressions (and what caused it – you can see stats of everything you posted on a chosen day).
Let’s break it down a little.
Analysing reach and impressions in Sotrender
You can do it for your own profiles (the ones you have an access at least on Analytic level in case of Facebook and the Instagram Business Profiles that are connected to a Facebook Pages you have an access at least on Analytic level). When you add them to Sotrender, you get all the necessary data in Reach & Engagement section.
In there, you get data not only on reach and impressions, but also engagement metrics (which is a completely different story, that we’ll dig on some other occasion). Every tile is clickable and gets you to the more detailed view of a given metric.
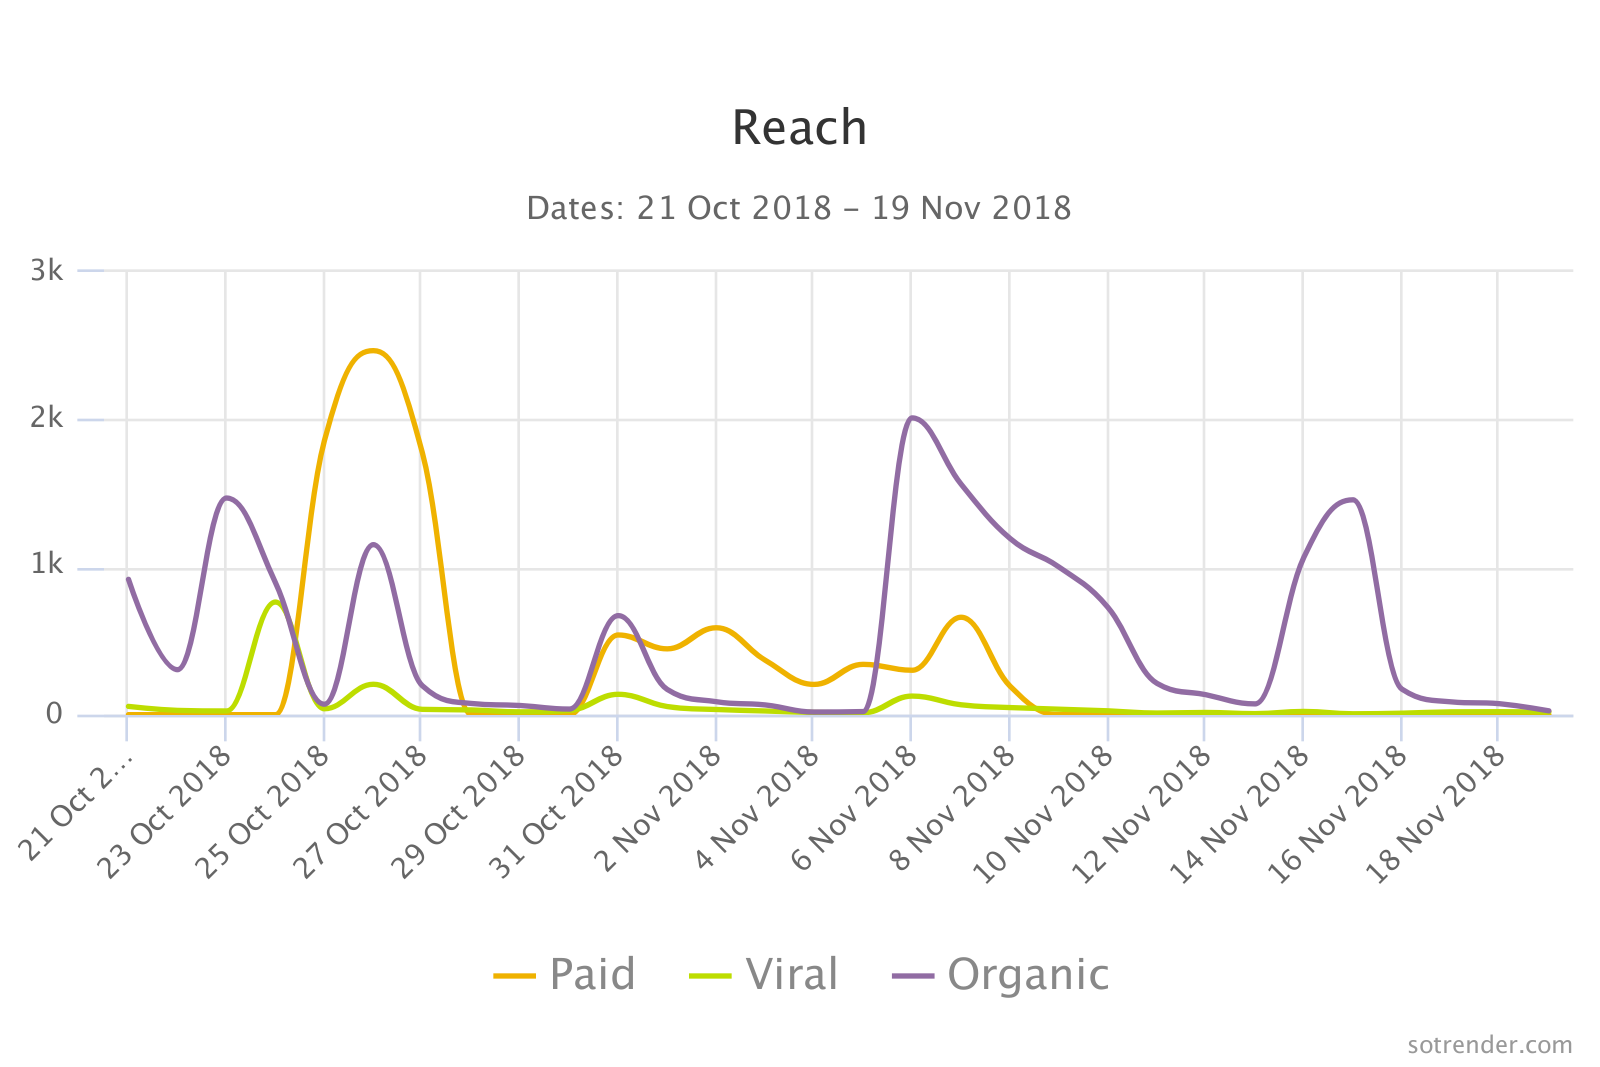
Facebook reach analysis chart in Sotrender
For Facebook, you can check different kinds of reach in Sotrender:
- Organic reach – the number of Page and post views published by a Page without any paid (promotional) activities.
- Paid reach – the number of Page and post views published by a Page which are a result of a paid activities (ads).
- Viral reach – the number of Page and post views published by a Page which are a result of other user activities (e.g. sharing). Information about viral reach is available only within the Sotrender tool; you won’t find this metric in Facebook Insights, for example.
The same goes with impressions. You also can break down the percentage of each kind of reach. Use that knowledge to improve your marketing performance – data is the best teacher.
Analysing Instagram Reach & Impressions in Sotrender
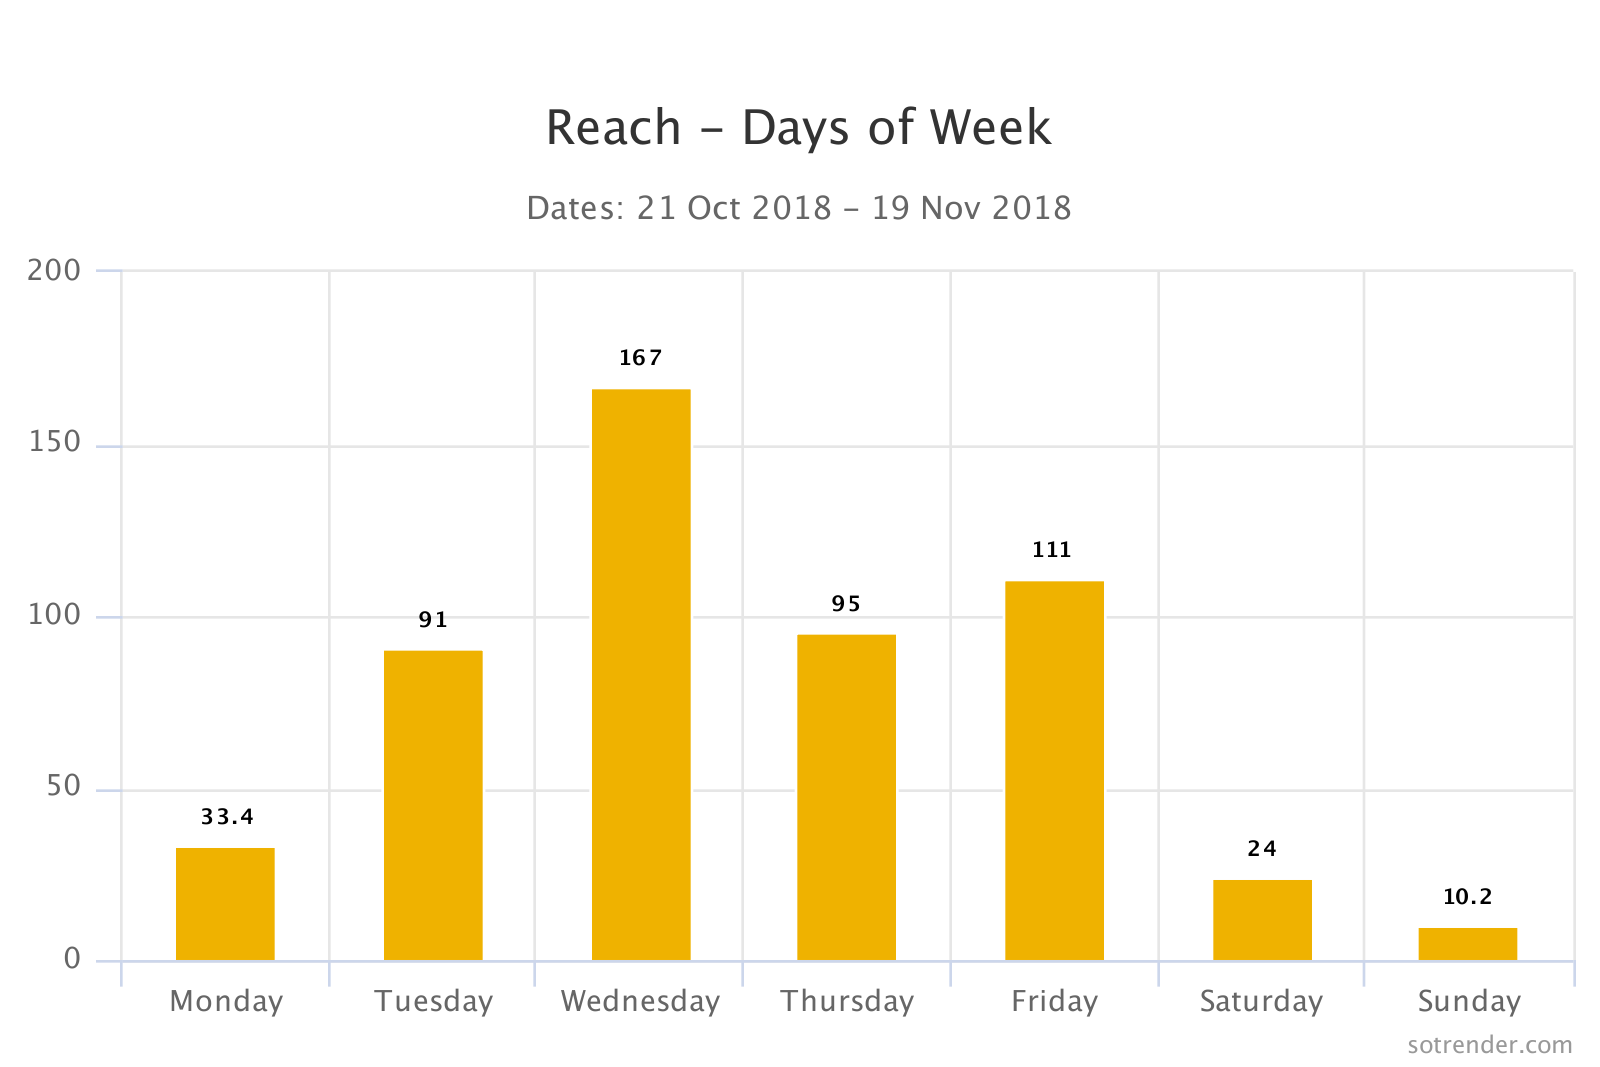
Daily breakdown of reach on Instagram in Sotrender
Analysis of your reach and impressions on Instagram differs slightly in Sotrender. You don’t get data on different kinds of reach, but we provide with the breakdown of days of the week – you can use that to better planning your content publication.
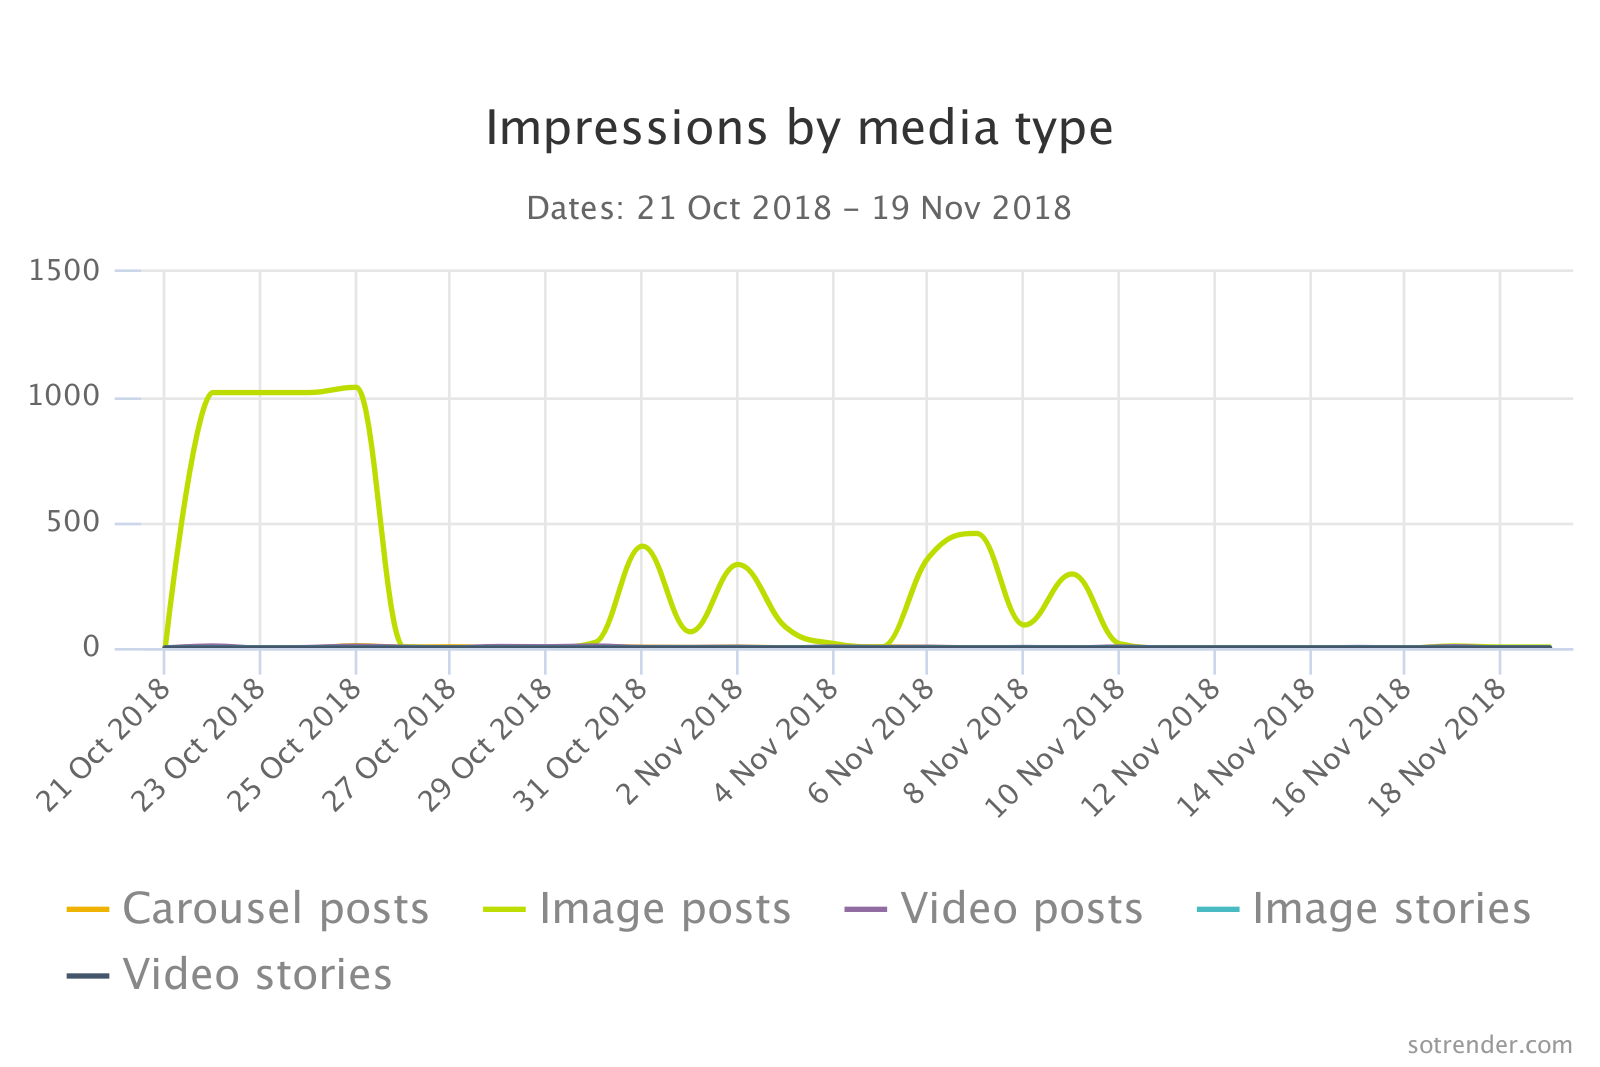
Instagram impression breakdown to different content types in Sotrender
Impressions analysis offers you additionally a chart detailing the percentage of impressions of different kinds of content – photos, videos, carousel posts. This helps you with deciding what to post on Instagram.
What to do with that knowledge?
As I wrote earlier, both reach and impressions are crucial metrics for your social media marketing performance and its evaluation. Understanding them, what caused their rises and falls is extremely important for your brand. Sure, engagement shows how people react to your content, but if they don’t see it, there’s no engagement and your message is being missed. That’s why you should analyse your reach and impressions and based on that knowledge setting goals for your performance and activities in social media.


