Every social media marketer needs to know how to create a report about their ad campaigns. It’s the only way that you can really be sure that your ad campaign was worth the investment. To do that well, you need to know how to navigate Facebook Ads analytics, where to find the most important metrics, and what those metrics indicate.
In this post, we’ll be showing you everything you need to know about Facebook Ads analytics, which metrics matter, and where you can find them.
Why Facebook Ads Analytics matter
Let’s say you and your marketing team want more people to hear about your brand’s latest product. Accounting told you ahead of time that you can only spend a specific portion on the budget, and the head of marketing expects you to get more leads than in Q1. How can you definitively prove to them whether or not you’ve achieved your goals?
Well, for the CMO, you’d have to show them that your ad spending was justifiable in some way. The only way to do that is by presenting them with a report or summary of the most important metrics. Here’s how to create and download a Facebook report.
It’s not just about checking your old results, though. It’s also important that you keep up with your Facebook Ads analytics for future campaigns. By learning from your past results, you can optimize your new Facebook Ads. You’ll know that you’re on the right track if your ads are becoming cost-efficient, the number of leads is increasing, and more people know about your brand.
Let’s see how you can find the most important Facebook Ads metrics and how you can interpret them by using Facebook’s own tool: Ads Manager.
Facebook Ads Analytics in Ads Manager
The first thing that comes to mind when you want to check your ad performance is Ads Manager on Facebook. To get access to it, you have to open up the Facebook Business Suite and go from there. Choose ads, then scroll all the way down until you can click on Ads Manager. Here’s what your main page should look like in Ads Manager.
Ads Manager: overview
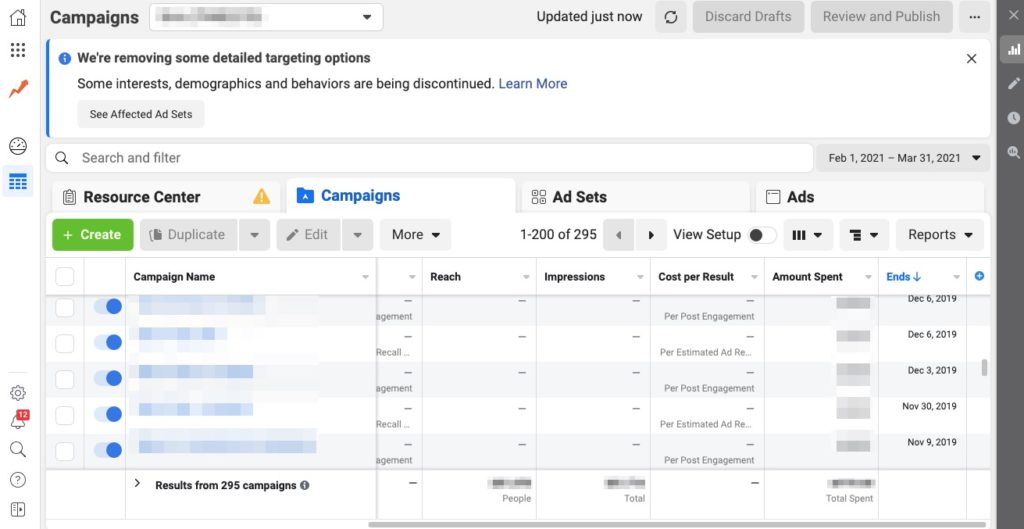
There’s a lot of data on one page, so we’ll help you get acquainted with it. You can scroll through both active and inactive ad campaigns in the “campaigns” section, check the overall reach, impressions, CPR, and the amount of money you’ve spent on the campaign. You can take a glance at most of these columns and see every metric as a single number. However, you’ll have to select individual Facebook campaigns or Facebook ads to see more detailed information.
Just remember: you should look at metrics that match the format and goal of your Facebook Ads. The values that you can see in these columns and charts won’t always be relevant for every campaign. Now we’ll walk you through what Facebook Ads analytics are available here. 😉
Facebook Ads Analytics: Performance
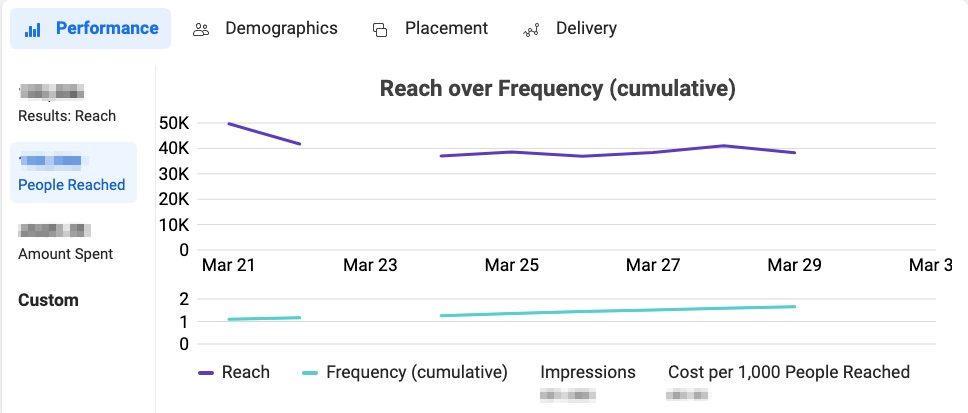
I selected one campaign from the list and chose the option “show charts” which should take you to the performance metrics tab. Just note that you’ll have to change the date range around the top right corner so that you can see the results a bit better.
Now you’ll be able to see the specific longer period.
What exactly do these metrics tell you? According to Facebook, estimated ad recall lift is a metric that indicates how many people would remember having seen your ad after two days. If your ad appealed to your audience, chances are that they’re going to remember seeing it. Ultimately, if your goal was to increase brand awareness or have more people learn about your product, then this is one of the metrics you should be checking.
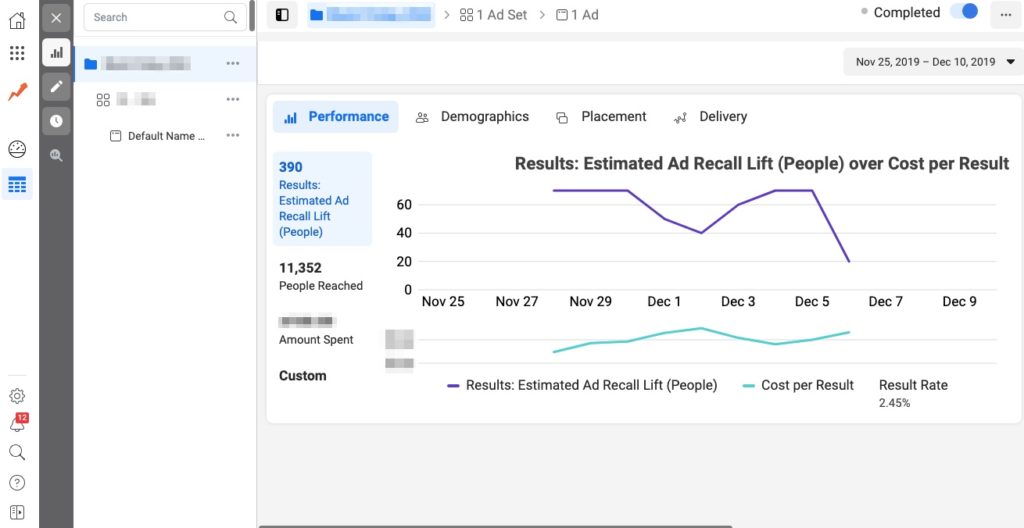
What about CPR? You’ll always want it to be cheaper because it means your ad was financially efficient. If you realize that the Cost per Result started to increase around the same time of the month, you’ll have a good idea of when you should be turning your ads off. 😉
Besides these metrics, you’ll see a quick summary of the campaign’s performance on the left. So far, all these graphs are easy to understand.
Demographics
Okay, so you familiarized yourself with how to check the basic performance metrics. Now we’ll show you how to check who your ad managed to reach by the end of it. Click on the demographics tab and this is what you should see.
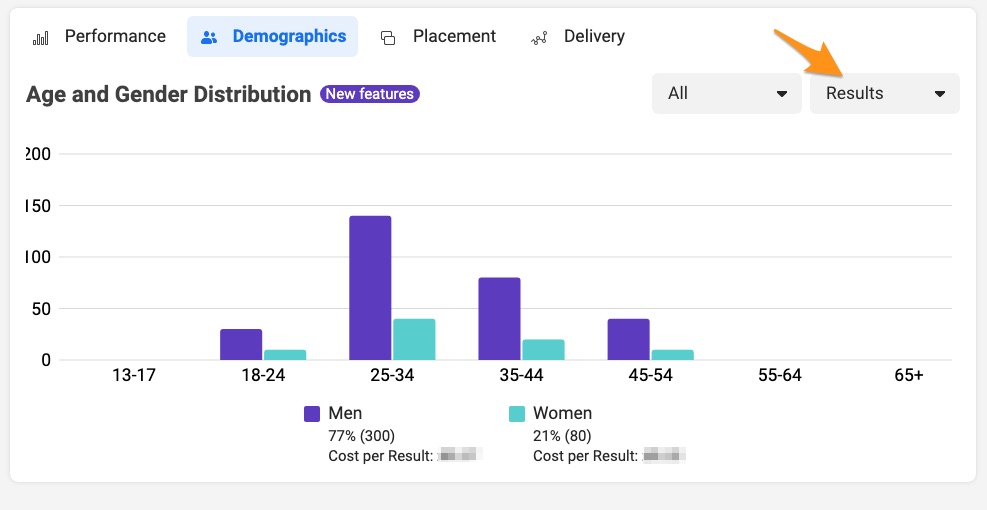
To get all of the necessary information, we recommend looking through all of the potential results, one by one. Click on “Results” as we did in the screenshot, and look through the individual options.
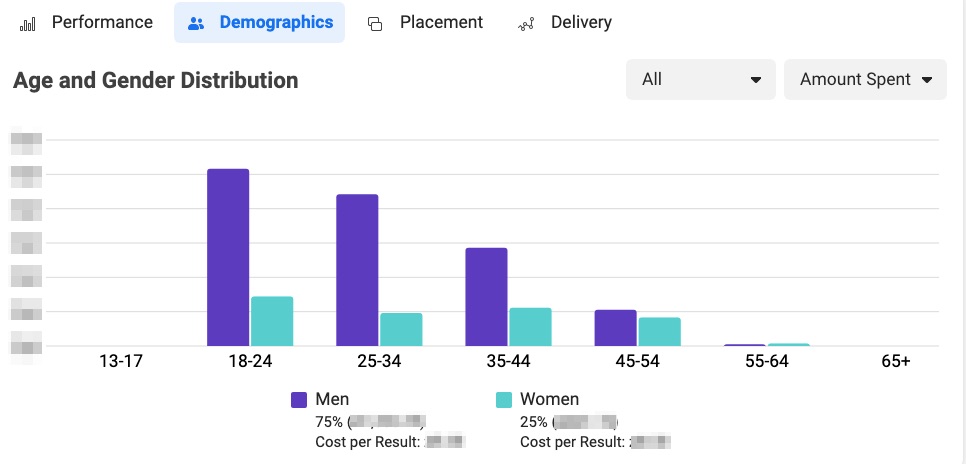
Here’s the amount spent. The name is pretty self-explanatory, but in case you’re not sure what it means, it’s just the amount you spent on these ads. From this tab, you can see how much of your budget was used on each age group, and then men and women within those age groups. Amount spent should give you a clear picture of how much of your budget ended up being used for each group.
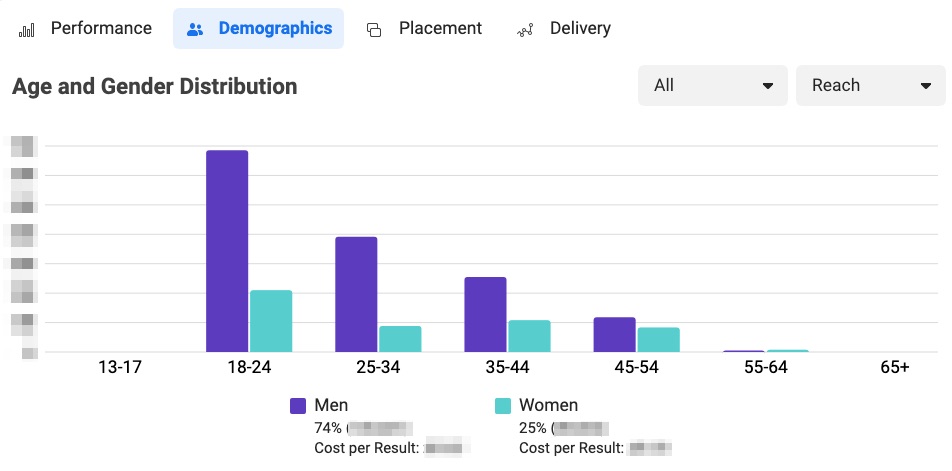
The next metric you should be checking is reach. Reach as a metric gives you an idea of how many unique people have seen your ad. This doesn’t necessarily mean that your target audience actually interacted with the ad, though.
If your goal is awareness, then this is one of the metrics you should be checking. That’s mostly because your goal was to get many more people to either hear about your offer or your company, and whether or not you succeed depends on how many new people learned about you through this ad. Makes sense, right?
Next up, we have impressions. This is a pretty important metric across the board, whether you’re looking at organic or sponsored content. It just tells you how many times people saw your ad. It’s not exactly like reach, because reach counts each individual person once. For impressions, a single person may have seen your ad twice or even three times.
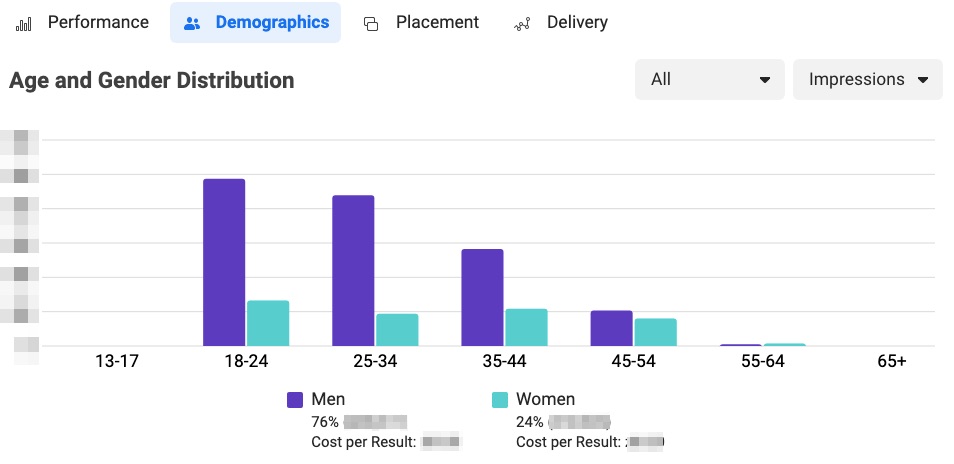
It’s especially important if your ad goal is brand awareness since it directly corresponds to that goal. To decide whether or not your ad was a success, we suggest comparing ads where your ad spending was similar and see which had more impressions.
These were the core demographic metrics we wanted to draw your attention to. Now we can focus on something a little less intuitive, but still pretty important. 😉
Ad Placement
Remember when you were setting up your ad in the first place? One of the first things you needed to consider was where you were going to place your ad and who could potentially see it. This is one of those crucial decisions that really depends on what your goal was in the first place.
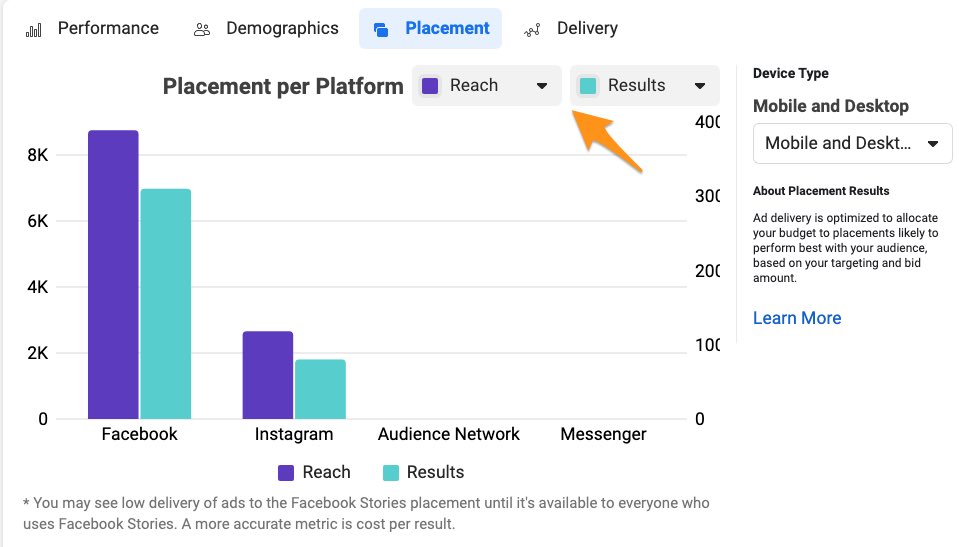
So, what can you find out about your Facebook Ads based on these results? Well, you might realize that it ends up being cheaper to run your ad on one platform over another, for example. You can even be selective about the type of audience you’re interested in: mobile or desktop users.
It might seem irrelevant where you want to place your ad. However, the way that people use features like Messenger, marketplace, or the two platforms (Facebook and Instagram) isn’t always the same. If you’re looking for some good tips about deciding on the placement of your ad, then we recommend WordStream’s article on that topic. 🙂
Ad Engagement Metrics
Even if many people saw your ad, it doesn’t mean that they’re interested enough to buy what you’re selling. This is exactly why engagement metrics matter so much. They’re great for tracking your lead generation objectives.
If users interact with your sponsored content, it’s because they’re interested. High engagement will generally indicate that your ad’s design and copy were so good that you drew their attention and got them to engage with it or even exit Facebook.
So then, which metrics can you see here? They’re probably going to be familiar to you, so we’ll briefly describe what’s what.
Link clicks: Number of times a link featured in the ad was clicked on. Used to check how interested users are in learning more about your product or service.
CPC (Cost per Link Click): The average amount you spend every time someone clicks on your link. Basically, it’s just the total amount spent / link clicks.
Page engagement: Number of interactions on your Facebook Page that came as a result of your ads. A user who saw your ad, visited your Page and liked it counts as Page engagement.
Comments: The number of comments that users left under your ad. Just remember to check what users write there since this is your target audience’s first impression of your brand.
Post shares: Number of times your ads were shared as a post. Although it’s uncommon, it’s possible that a few of your users will share the ad with their friends. This basically just gives you free exposure and can act as a recommendation.
We’d love to show you visualizations of all of the important engagement metrics, but it’s not possible. Facebook Ads Manager only presents these in a rather large table that we showed you at the very beginning of the article.
Okay, you know where to find these and you know what to expect from Ads Manager. Now you need to decide whether or not it’s a solution that makes sense as a Facebook Ads analytics tool for you.
Pros
Of course, one of the perks of using Facebook’s own tool is that it’s free to use. Instead of paying for a tool on a monthly basis, you have access to the already integrated application.
The other benefit of using Ads Manager to track Facebook Ads performance is that it will be easier to find solutions or workarounds online. There are definitely people who learned how to get creative with it to get better results.
Also, you won’t have to wait for an explanation or fix every time something gets updated on Facebook. Since it’s their platform, Facebook will always try to provide users with updates and solutions. This can sometimes be an issue with third-party apps, unfortunately.
Cons
Unfortunately, Facebook Ads Manager doesn’t always offer the best solutions to all of your problems. Here’s what you should consider before sticking to this free option.
For one, it’s not so easy to directly download all of your data (you can only save it as CSV or XLS files). As a social media marketer, you probably need access to your data on the go. Creating social media reports can take a long time, and this is the time you could be using to do something more creative. In that case, a third-party application would be a better fit.
The other issue with Facebook Ads Manager is that the graphs are not easily customizable. In some situations, you might want to focus on one specific element of your ad campaign. It would be better to be able to customize your graphs or report so that you can get exactly what you need.
Another con is that you can’t visualize all of the metrics that you’d like. Sure, you can export some of the data in a spreadsheet, but editing it will take time. We’d still prefer to be able to immediately visualize Facebook Ads engagement metrics. For now, it’s not possible to do it over Facebook Ads Manager. For the time being, you’d have to accept the table that’s visible on the main page of Ads Manager.
Most of the time, when you’re paying for a third-party application, you’re paying for convenience and extra features that don’t come with the original. If these cons are too much from your perspective, it’s time to consider paying for a tool.
Alternatives to Ads Manager
Based on the results you see after an ad campaign is completed, you should make the right adjustments. Remember that you should always optimize your Facebook Ads over time and keep track of what’s working and what isn’t. Before you know it, you’ll be able to calibrate your ads and improve your conversion rates.
Of course, besides Ads Manager, there are many more options that can get you closer to your Facebook Ads analytics. One of those is Sotrender Ads, Sotrender’s extra module which delivers comprehensive ads data. Implementing Sotrender Ads is convenient especially when you are using Sotrender for your organic performance analytics. This way, you can gather all substantive data in one place and you can access them anytime you want.
In Sotrender, you are able to measure, among others:
- reach,
- views,
- CPC,
- CPM,
- audience share.
But you can also track some of these metrics in relation to your campaign spend. See how it looks on the example below.
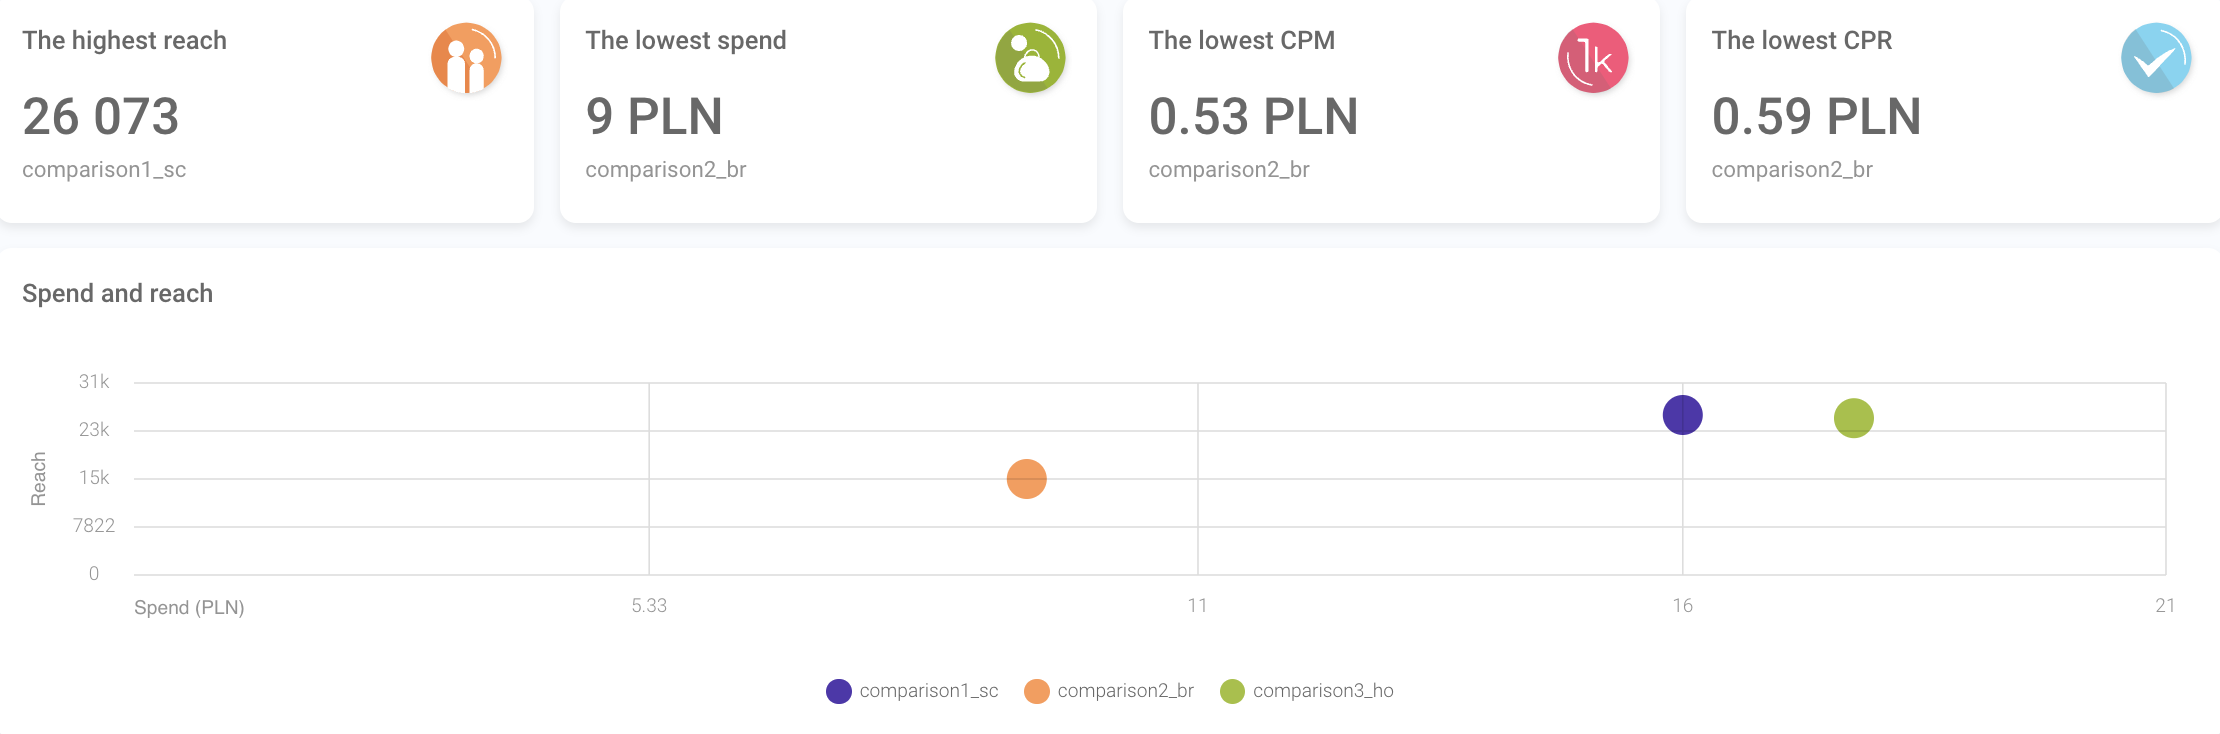
Checking overview of campaign results in Sotrender Ads
So, basically, besides the highlights of selected campaign metrics, like the highest reach, lowest spend or lowest CPM or CPR, you can check, for example, campaign reach with regard to spend for any preferred campaign.
Also, in Sotrender Ads, on contrary to the Facebook Ads Manager, it is possible to compare your ad results with competitors. While, in general, it is hard to check exact competitors’ ad results, Sotrender makes it easy to create an overview of their key ad metrics and campaign expenditures. This is available in Sotrender Ads’ Benchmarking Section.
Sounds great, nah? But how can you even do that?
So, first, you just need to choose one of 25 different categories (industries), and select one of three campaign goals available: Awareness, Consideration or Conversion. Then, you will see your ad results in the background of competitors, with regard to the four different scores:
- median CPC,
- median CPM,
- number of ad views,
- number of ad clicks.
Here’s an example. The results below inform that the CPM score was great during last month when compared to competitive brands in selected industry, however, other scores need serious improvement.
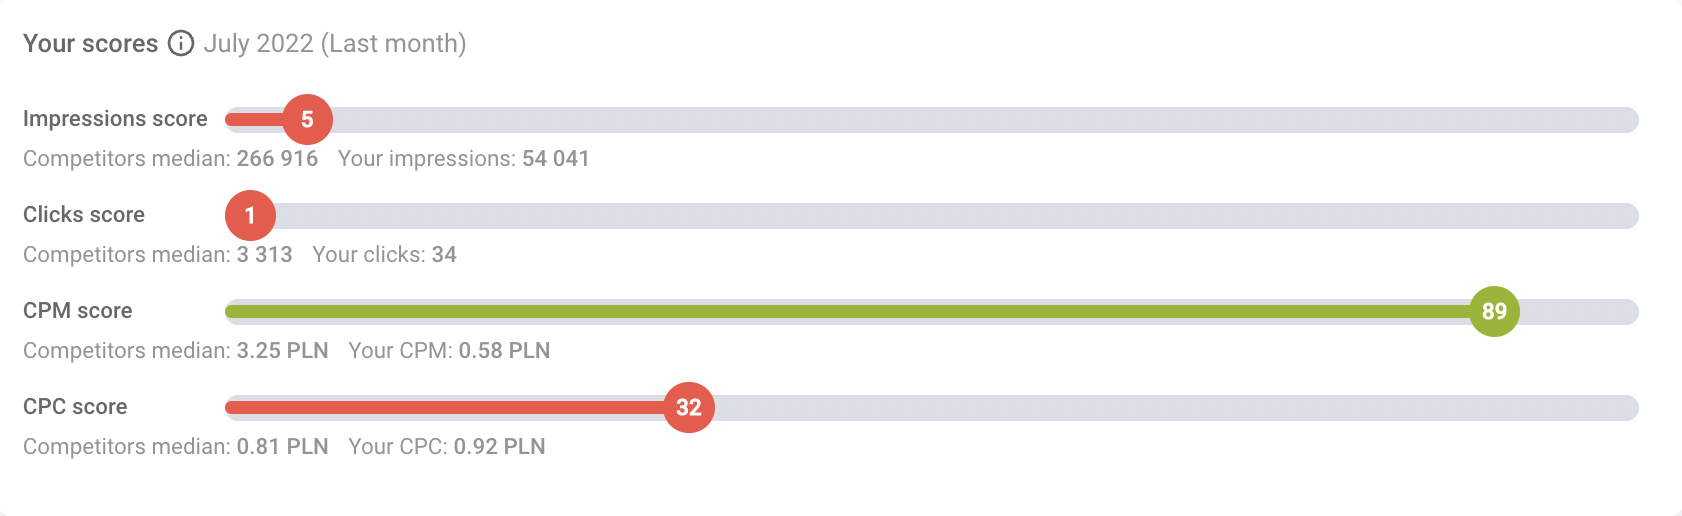
Comparing campaign results with competitors in Sotrender Ads
What is more, in Benchmarking section, you can compare the amount that you spent on advertising in the previous month with the median of competitors’ expenditures. Thanks to that, you can learn how much do the competitive companies invest in advertising, and what campaign goals do they choose.
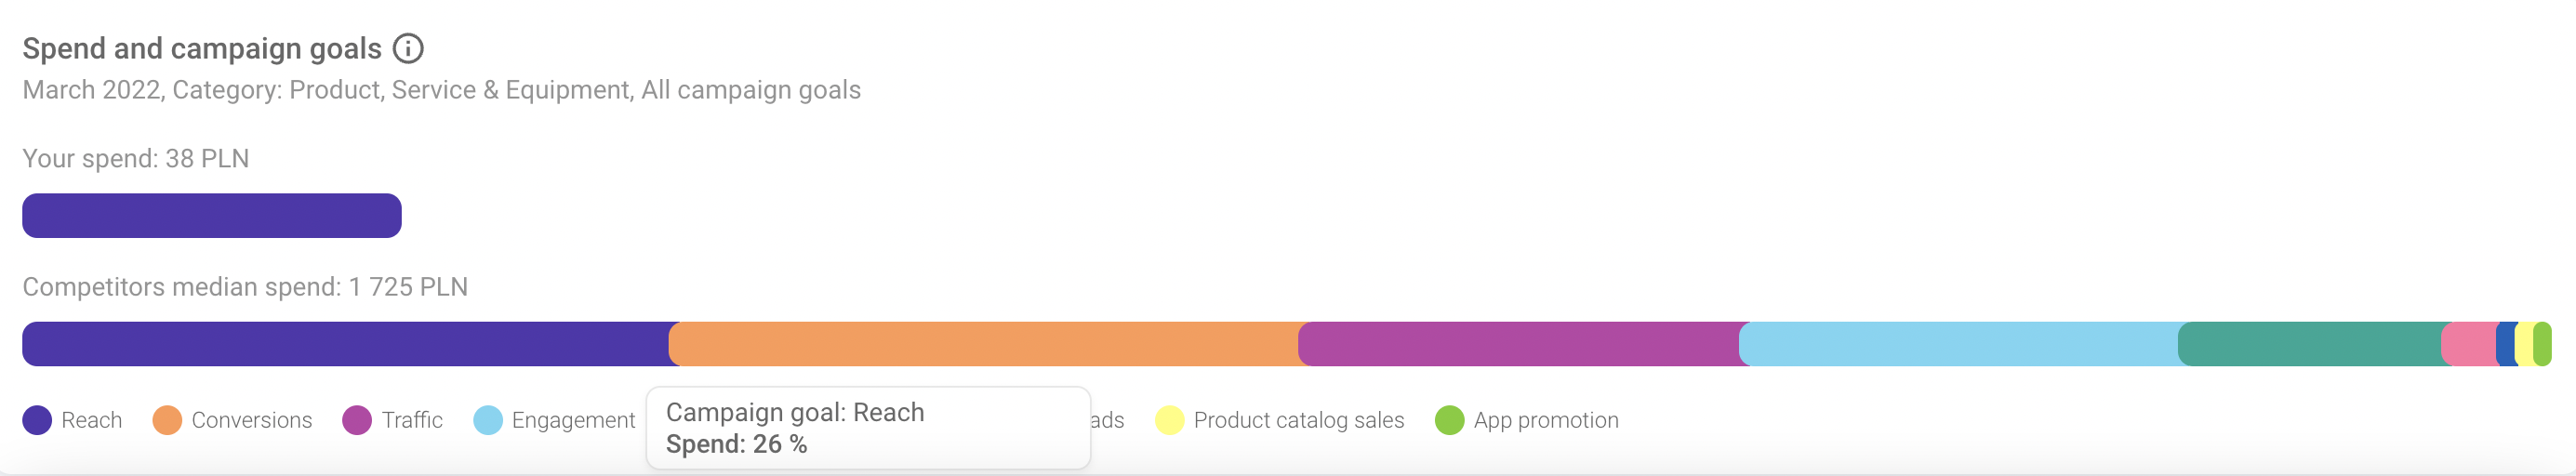
Analyzing competitors’ campaign spend and goals in Sotrender Ads
Now that you have access to such comprehensive data, you can better craft your advertising strategy and optimize it for future improvements. Remember, if you analyze your ad performance frequently, it can result in better optimized campaigns, and most probably, lower ad costs.

Read also:


